Big data in healthcare contain a huge amount of tacit knowledge that brings great value to healthcare activities such as diagnosis, decision support, and treatment. However, effectively exploring and exploiting knowledge on such big data sources exposes many challenges for both managers and technologists. This study proposes a healthcare knowledge management system that ensures the systematic knowledge development process on various data in hospitals. It leverages big data technologies to capture, organize, transfer, and manage large volumes of medical knowledge, which cannot be handled with traditional data-processing technologies. In addition, machine-learning algorithms are used to derive knowledge at a higher level in supporting diagnosis and treatment.
- KMS
- big data
- machine learning
- high blood pressure
- brain hemorrhage
- Spark
1. Introduction
2. Knowledge Management Systems
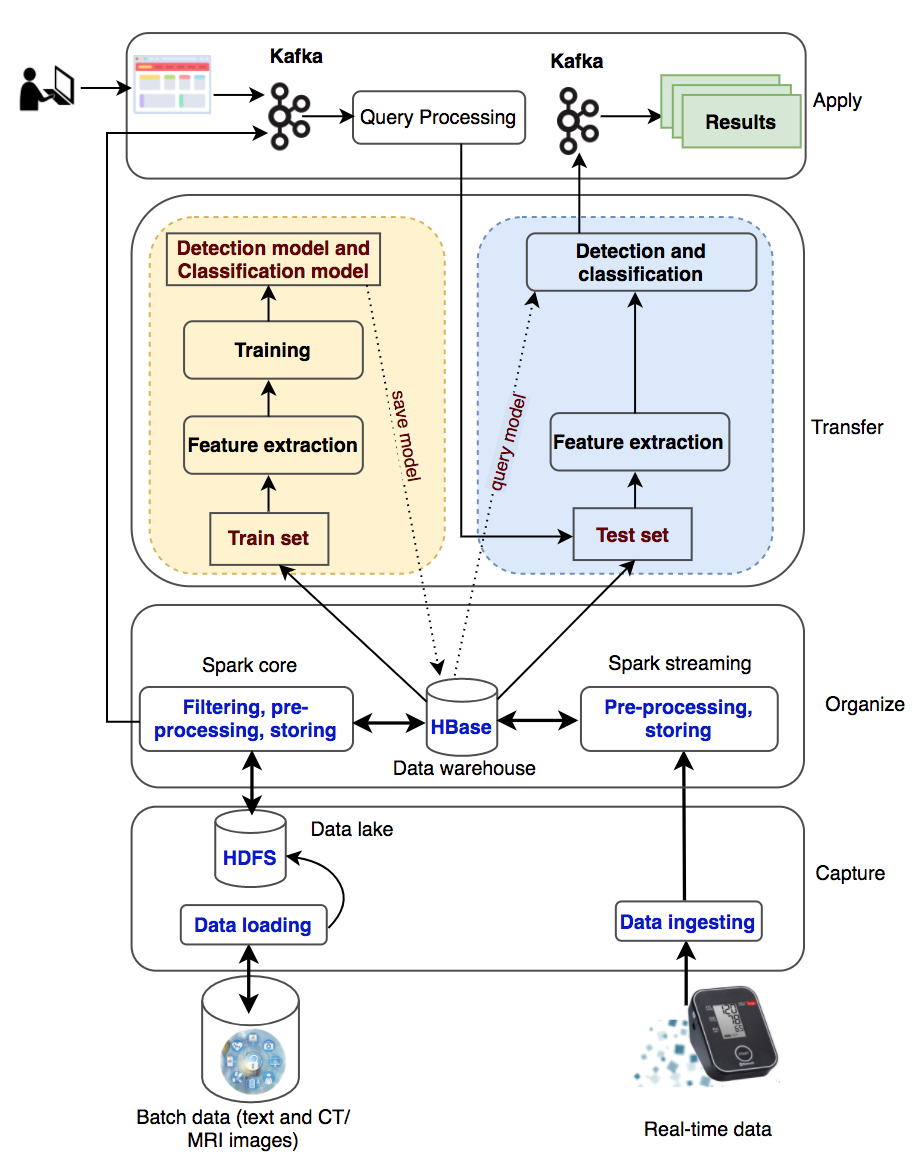
The system processes two types of data: batch data (patient records collected over a long time period) and real-time data (collected from wearable devices). The batch data are loaded into the data lake (HDFS) and the real-time data are ingested into the processing system with Kafka and Spark streaming. With a large amount of medical data, the system will filter out useful information for disease diagnosis and classification, preprocess information, and store information into HBase. The information will be used for knowledge transformation to create machine-learning models. New knowledge is created and made available to users through queries from websites or wearable devices.
2.1. Data Layer
There are two data sources used in this study, including historical datasets collected from hospitals and real-time data collected from patients via health-monitoring wearable devices. The batch data are loaded into Hadoop Distributed File System (HDFS), a well- known fault-tolerant distributed file system. HDFS is designed to store very large datasets reliably and to stream those datasets at high bandwidth to user applications. The real- time data are ingested into the system with Apache Kafka, a distributed, reliable, high-throughput and low-latency publish-subscribe messaging system. Kafka has become popular when it and Apache Spark are coordinated to process stream data as well as to use both of their advantages. We use Kafka to ingest real-time event data, streaming it to Spark Streaming. The data can be in text format or images, especially CT/MRI images that are commonly used in medical diagnosis. These raw data are collected and fed into the system for storage at the data layer.
2.2. Information Layer
Data will be sorted, organized, and filtered accordingly to transform into meaningful information in an organized and retrievable form. This information will be stored as datasets on a distributed file system HBase to serve for distributed and parallel processing in a big data environment. Apache HBase is a distributed column-oriented NoSQL database built on top of HDFS. The system requires the ability to handle batch and real-time data. Consequently, we use Apache Spark for both the batch and real-time data processing. Spark has emerged as the next-generation big-data-processing engine because it works with data in memory that are faster and better able to support a variety of compute-intensive tasks. Spark Core processes the batch data from HDFS to organize content according to their semantics and to create and maintain the knowledge base (HBase) as an organizational memory. Spark Streaming involves mapping continual input of the data from Kafka into real-time knowledge views. Every single event is sent as a message from Kafka to the Spark Streaming. Spark Streaming produces a stream and executes window-based operations on them.
The data collected from the hospital management system consist of many tables and many data fields. Depending on the goals of the medical diagnostic support systems, the appropriate data should be extracted. The historical datasets collected from hospitals will be used for the knowledge generation process, which is the input to the knowledge layer. These data are authentic, and the diagnostic results are given by the doctors with high professional confidence to help the labeling process in building knowledge models more effectively.
2.3. Knowledge Layer
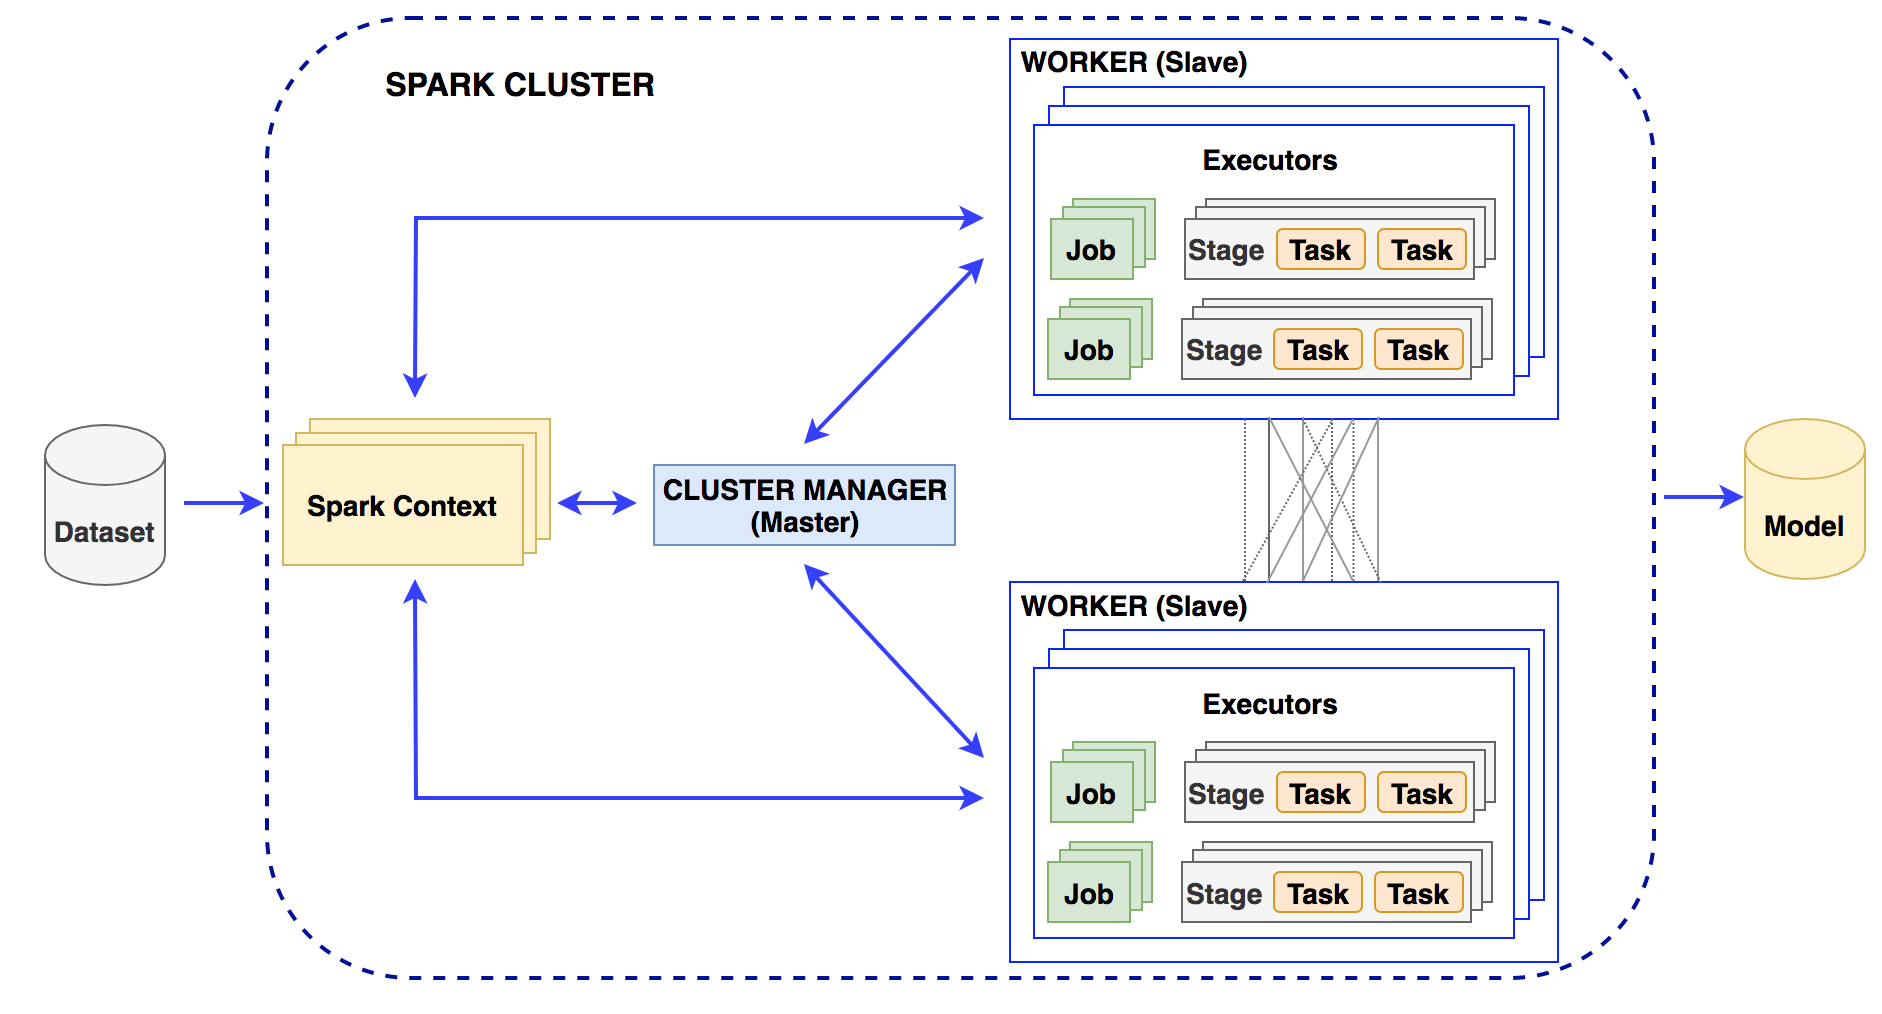
Machine-learning algorithms can be used in the Spark distributed environment to build models for knowledge generation consisting of two phases: the training phase and the testing phase. Spark MLib is a core component to execute the learning service that allows for quickly experimenting and building data models. The appropriate models supporting diagnosis decisions will be made based on accuracy. In this layer, it is necessary to perform preprocessing of the data, which is to select the necessary information for the construction of a diagnosis support system. The diagnosis results previously given by doctors are used for labeling purposes. After data preprocessing, 70% of the random dataset will be used for the training phase and 30% for the testing phase.
The machine-learning algorithms used in the knowledge layer are decision trees and deep neural networks. Decision trees have been successfully used in a wide range of fields such as speech recognition, remote sensing, and medical diagnosis. The reason for choosing a decision tree at the knowledge layer here is that the patient records for hypertension are all in text format. The decision tree uses input data to learn and generate knowledge with the same rules as to how humans think. It breaks down a complex decision-making process into simple rules that are simple to understand and suitable to use for datasets of diverse attributes and data types. Deep learning with Faster R-CNN Inception ResNet v2 is another machine-learning algorithm to be used in the knowledge layer for brain hemorrhage diagnosis. Deep-learning techniques have been successfully applied in a wide range of fields, especially in medical images analysis.
Training phase: In this phase, we perform feature extraction on the input dataset and then train machine-learning models. Model training is performed in a distributed environment and stores the trained model on distributed file systems (Figure 7). We build machine-learning models with the extracted feature dataset.
2.4. Process Layer
In this layer, the applications are built to input patient information into the system and give outputs about diagnosis and diseases classification. The applications are designed to perform patient data entry and then execute knowledge queries to return new knowledge about the patient’s health status. The execution of queries in this layer is implemented in a distributed environment.
3. Healthcare Knowledge Management Systems
3.1. High Blood Pressure Diagnosis Support
| Class | Systolic | Diastolic |
|---|---|---|
| Normal | <120 | and <80 |
| Prehypertension | 120–139 | or 80–89 |
| Stage 1 hypertension | 140–159 | or 90–99 |
| Stage 2 hypertension | ≥160 | or ≥100 |
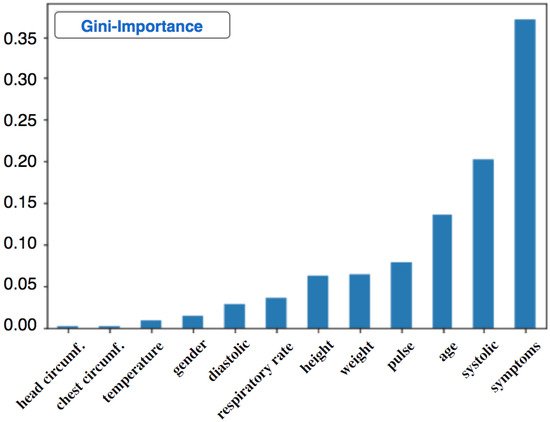
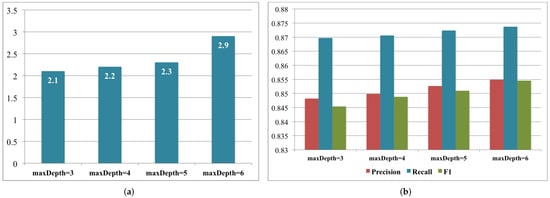
3.1.1. Decision Tree for High Blood Pressure Detection
| Symptoms | Diagnosis | Label | Index | Symptoms Classification | Features |
|---|---|---|---|---|---|
| Headache, vomit | Intracranial injury | 0 | 194 | (25,152, [194], [1.0]) | (25,163, [1, 2, 3, 4, 5, 6, 7, 8, 9, 10, 205], [17.0, 100.0, 60.0, 80.0, 18.0, 1.57, 22, 53, 48.0, 37.0, 1.0]) |
| Fiver | Chickenpox | 0 | 7 | (25,152, [7], [1.0]) | (25,163, [0, 1, 2, 3, 4, 5, 6, 7, 8, 9, 10, 18], [1.0, 36.0, 140.0, 60.0, 78.0, 20.0, 1.7, 39, 68, 50.0, 39.0, 1.0]) |
| Tired | Hypertension | 1 | 1 | (25,152, [1], [1.0]) | (25,163, [0, 1, 2, 3, 4, 5, 6, 7, 8, 9, 10, 12], [49.0, 210.0, 140.0, 104.0, 22.0, 1.73, 40, 55, 80.0, 37.0, 1.0]) |
| Abdominal pain | Acute appendicitis | 0 | 0 | (25,152, [0], [1.0]) | (25,163, [0, 1, 2, 3, 4, 5, 6, 7, 8, 9, 10, 11], [23.0, 110.0, 70.0, 87.0, 20.0, 1.46, 40.0, 50.0, 40.0, 37.0, 1.0]) |
| Dizzy | Vestibular dysfunction; Hypertension | 1 | 4 | (25,152, [4], [1.0]) | (25,163, [0, 1, 2, 3, 4, 5, 6, 7, 8, 9, 10, 15], [1.0, 53.0, 170.0, 100.0, 84.0, 18.0, 1.5, 42, 55, 50.0, 37.0, 1.0]) |
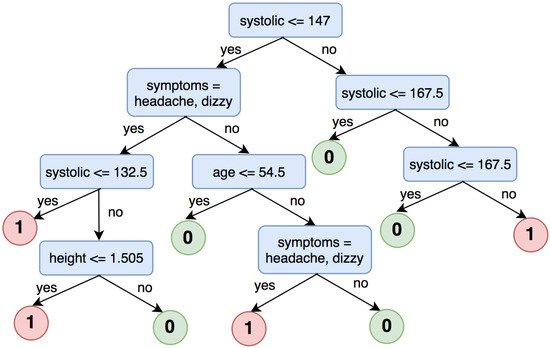
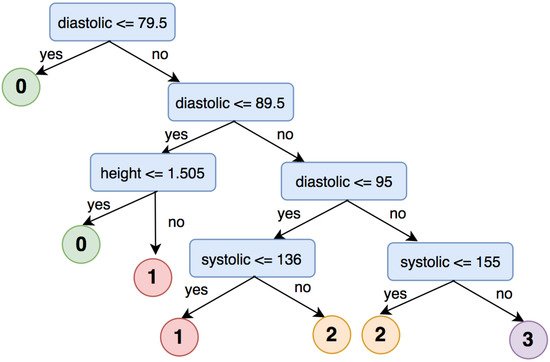
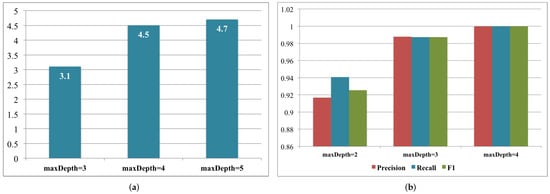
3.1.2. Decision Tree for High Blood Pressure Classification
-
Label 0: systolic < 120 and diastolic < 80
-
Label 1: systolic ≥ 120 and diastolic ≥ 80
-
Label 2: systolic ≥ 140 and diastolic ≥ 90
-
Label 3: systolic ≥ 160 and diastolic ≥ 100
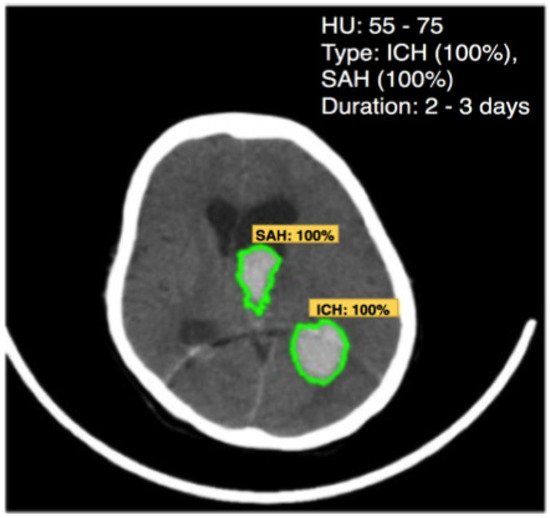
3.2. Brain Hemorrhage Diagnosis Support
| Matter | Density (HU) |
|---|---|
| Air | −1000 |
| Water | 0 |
| White matter | 20 |
| Gray matter | 35–40 |
| Hematoma | 40–90 |
| Bone | 1000 |
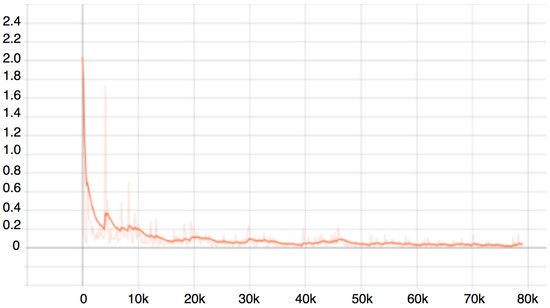
3.2.1. Training Phase
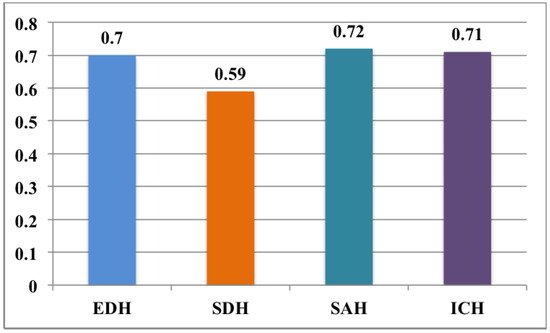
3.2.2. Testing Phase
This entry is adapted from the peer-reviewed paper 10.3390/app12094455
References
- Premier Healthcare Database being used by National Institutes of of Health to Evaluate Impact of COVID-19 on Patients Across the U.S . Premier. Retrieved 2022-5-12
- Benjamin I. Chung; Jeffrey J. Leow; Francisco Gelpi-Hammerschmidt; Ye Wang; Francesco Del Giudice; Smita De; Eric P. Chou; Kang Hyon Song; Leanne Almario; Steven L. Chang; et al. Racial Disparities in Postoperative Complications After Radical Nephrectomy: A Population-based Analysis. Urology 2015, 85, 1411-1416, 10.1016/j.urology.2015.03.001.
- Hoiwan Cheung; Ye Wang; Steven L. Chang; Yash S Khandwala; Francesco Del Giudice; Benjamin I. Chung; Adoption of Robot-Assisted Partial Nephrectomies: A Population-Based Analysis of U.S. Surgeons from 2004 to 2013. Journal of Endourology 2017, 31, 886-892, 10.1089/end.2017.0174.
- Chung, Kyung Jin and Kim, Jae Heon and Min, Gyeong Eun and Park, Hyoung Keun and Li, Shufeng and Del Giudice, Francesco and Han, Deok Hyun and Chung, Benjamin; Changing trends in the treatment of nephrolithiasis in the real world. Journal of Endourology 2019, 33, 248--253, .
- Maryam Alavi; Dorothy Leidner; Review: Knowledge Management and Knowledge Management Systems: Conceptual Foundations and Research Issues. MIS Quarterly 2001, 25, 107-136, 10.2307/3250961.
- U. Of Maryland Maryam Alavi; Insead Dorothy Leidner; Knowledge Management Systems: Issues, Challenges, and Benefits. Communications of the Association for Information Systems 1999, 1, 7, 10.17705/1cais.00107.
- Brent Gallupe; Knowledge management systems: surveying the landscape. International Journal of Management Reviews 2001, 3, 61-77, 10.1111/1468-2370.00054.
- Fabian M. Suchanek; Gerhard Weikum; Knowledge bases in the age of big data analytics. Proceedings of the VLDB Endowment 2014, 7, 1713-1714, 10.14778/2733004.2733069.
- Begoli, E.; Horey, J. Design principles for effective knowledge discovery from big data. In Proceedings of the 2012 Joint Working IEEE/IFIP Conference on Software Architecture and European Conference on Software Architecture, 24 Aug 2012; pp. 215–218.
- Dong, X.; Gabrilovich, E.; Heitz, G.; Horn, W.; Lao, N.; Murphy, K.; Strohmann, T.; Sun, S.; Zhang, W. Knowledge vault: A web-scale approach to probabilistic knowledge fusion. In Proceedings of the 20th ACM SIGKDD International Conference on Knowledge Discovery and Data Mining, 2014; pp. 601–610.
- Nor’Ashikin Ali; Alexei Tretiakov; Dick Whiddett; Inga Hunter; Knowledge management systems success in healthcare: Leadership matters. International Journal of Medical Informatics 2016, 97, 331-340, 10.1016/j.ijmedinf.2016.11.004.
- Maramba, George and Coleman, Alfred and Ntawanga, Felix F; Causes of Challenges in Implementing Computer-Based Knowledge Management Systems in Healthcare Institutions: A Case Study of Private Hospitals in Johannesburg, South Africa. The African Journal of Information Systems 2020, 12, 4, .
- Manogaran, G.; Thota, C.; Lopez, D.; Vijayakumar, V.; Abbas, K.M.; Sundarsekar, R. Big data knowledge system in healthcare. In Internet of Things and Big Data Technologies for Next Generation Healthcare; 2017; pp. 133–157.
- Le Dinh, T.; Phan, T.C.; Bui, T. Towards an architecture for big data-driven knowledge management systems. In Proceedings of the 22nd Americas Conference on Information Systems (AMCIS 2016), 2016; Association for Information Systems: USA, 2016.