Your browser does not fully support modern features. Please upgrade for a smoother experience.
Please note this is an old version of this entry, which may differ significantly from the current revision.
Subjects:
Allergy
Laxogenin C (LGC) is a natural spirostanol deriving from plant hormone which has shown growing regulation similar to those of brassinosteroids.
- plant growth regulator
- LC-MS/MS
- metabolomics
1. Introduction
Plant growth regulators (PGRs) are special chemicals that regulate (promote or inhibit) the growth and development of plants at very low dosages [1], which play no phytotoxic roles. There have been a variety of PGRs successfully used in agriculture, and new types of plant hormones, including brassinosteroids (BRs). They are attractive due to their involvement in many physiological procedures and abilities to promote seed germination [2] and plant growth [3][4], enable plants to resist the harsh living environment [5], and facilitate pesticide metabolism [6]. Thus, PGRs, especially those with new scaffolds, need deep insights into their functions and mechanisms where the yield and quality of vegetable products are increased and higher planting efficiency is achieved.
Saponins are secondary metabolites commonly found in plants and can also be used as nutritional characterization in crops [7], generally having anti-inflammatory, antibacterial and antioxidant effects [8][9]. Among them, spirostanes share similarities in their physiological activity with BRs and have the potential to act as natural plant growth promoters. Steroidal glycosides of the spirostane series extracted from Nicotiana tabacum L. seeds presented growth-stimulating activities [10]. In general, low doses of exogenous auxin can promote plant growth. Meanwhile, high doses of exogenous auxins disturbed the homeostasis of plant hormones and caused plant death, for example, by altering auxin homeostasis, transport, and distribution to modulate root morphology and inhibit root growth [11]. However, most studies of spirostanes have focused on the relationship between regulatory effects and antioxidant enzymes instead of providing detailed insight into metabolic mechanisms.
Laxogenins C (LGC) and Smilaxin A (SA) are spirostanol saponins isolated from the traditional medicine plant Smilax scobinicaulis and have plant hormone activities similar to brassinosteroids [12]. Studies showed that laxogenin, a naturally spirostanic analogue, has a similar structure to BR skeletons and its derivatives show evident plant growth-promoting activity in radish [13]. Laxogenin glycosides also showed a high level of physiological activity in plant growth [14].
2. Tomato Growth Responding to LGC and SA Regulation
The molecular formulae of SA and LGC were determined based on high-resolution mass spectrometry, and their chemical structures were determined by NMR, which were compared with those reported data [15]. Their chemical structures are shown in Figure 1.
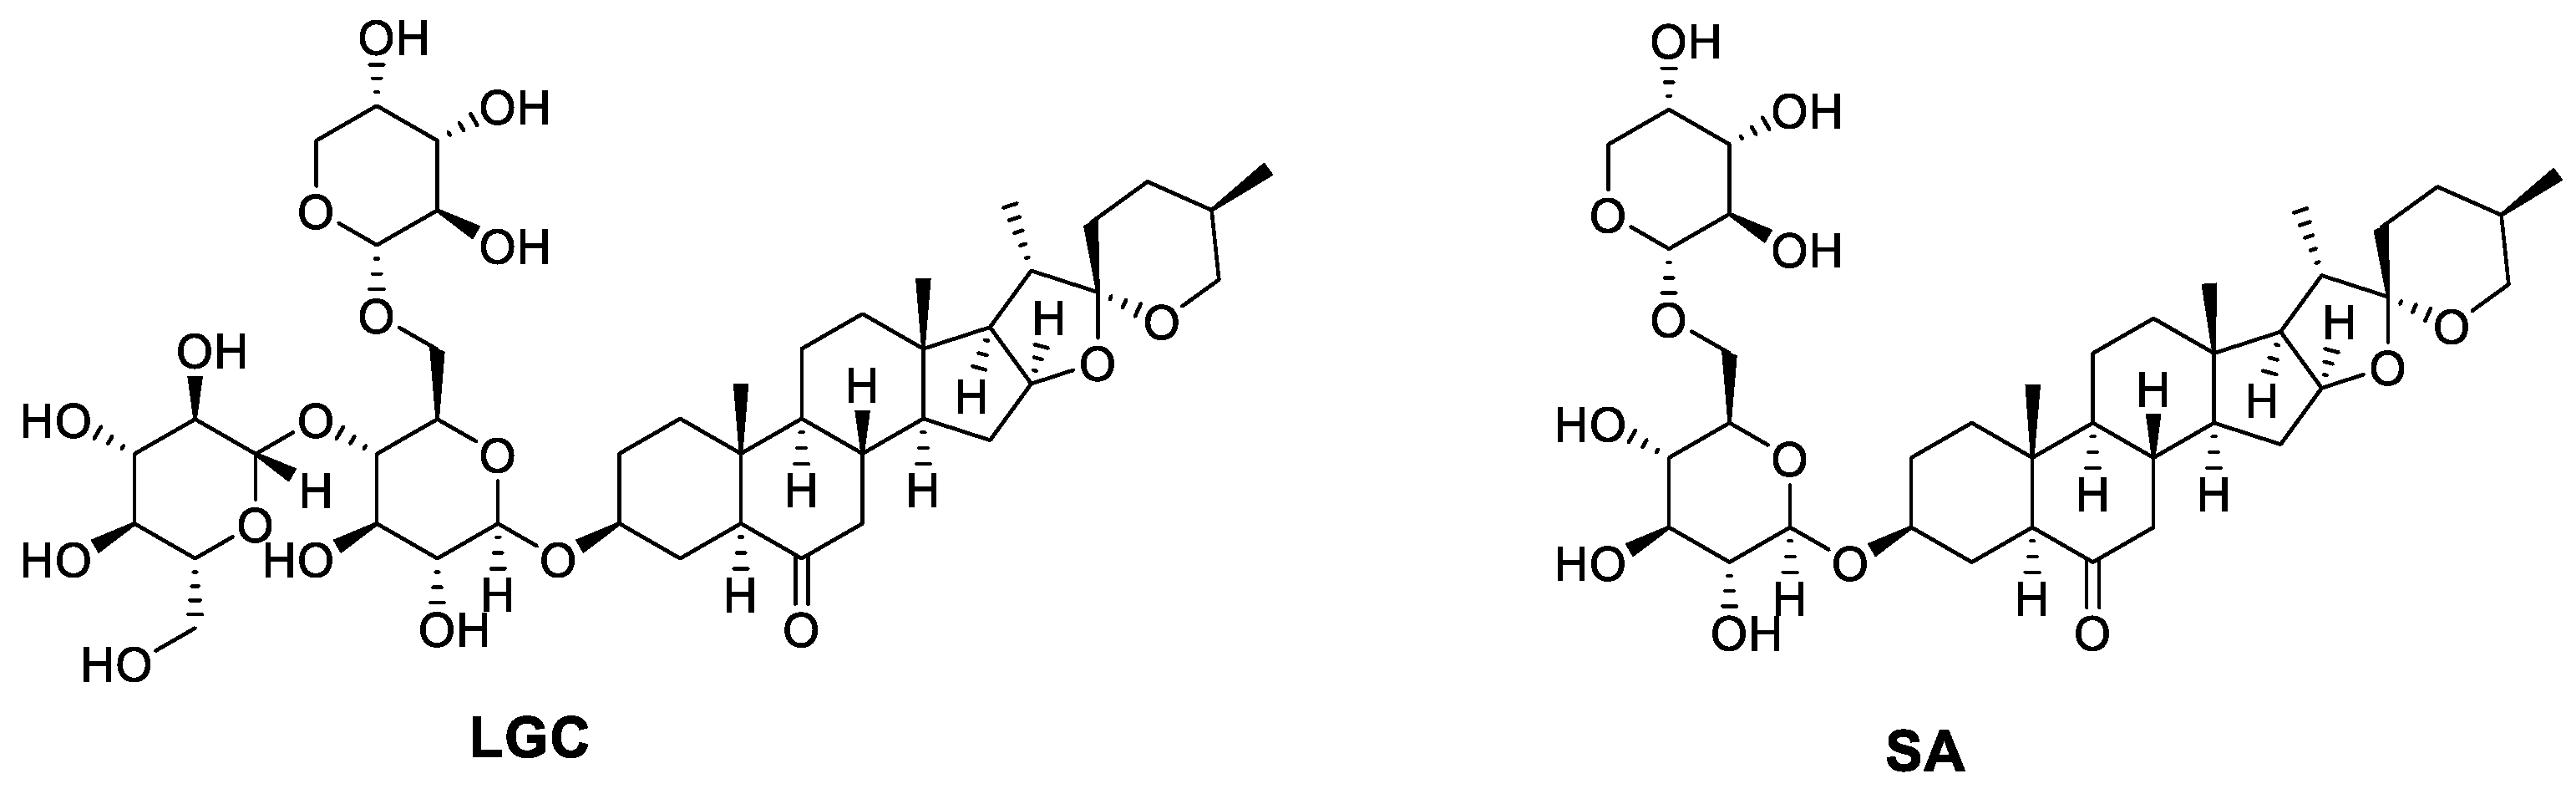
Figure 1. Chemical structures of LGC and SA.
The regulation of tomato seed germination and seedling growth by different concentrations of SA and LGC are shown in Figure 2. The GE (Figure 2A) peaked at 5 μg/L and 10 μg/L when the seeds were treated with LGC and SA, respectively. At the same time, the GI (Figure 2B) peaked at 10 μg/L. Low concentrations (5 μg/L and 10 μg/L) of SA and LGC promoted seed germination. However, LGC was more effective than SA in promoting germination. Furthermore, the daily germination percentage of tomato seeds demonstrated that SA and LGC at low concentrations (1~10 μg/L) caused early seed germination and delayed seed germination at increasing concentrations.
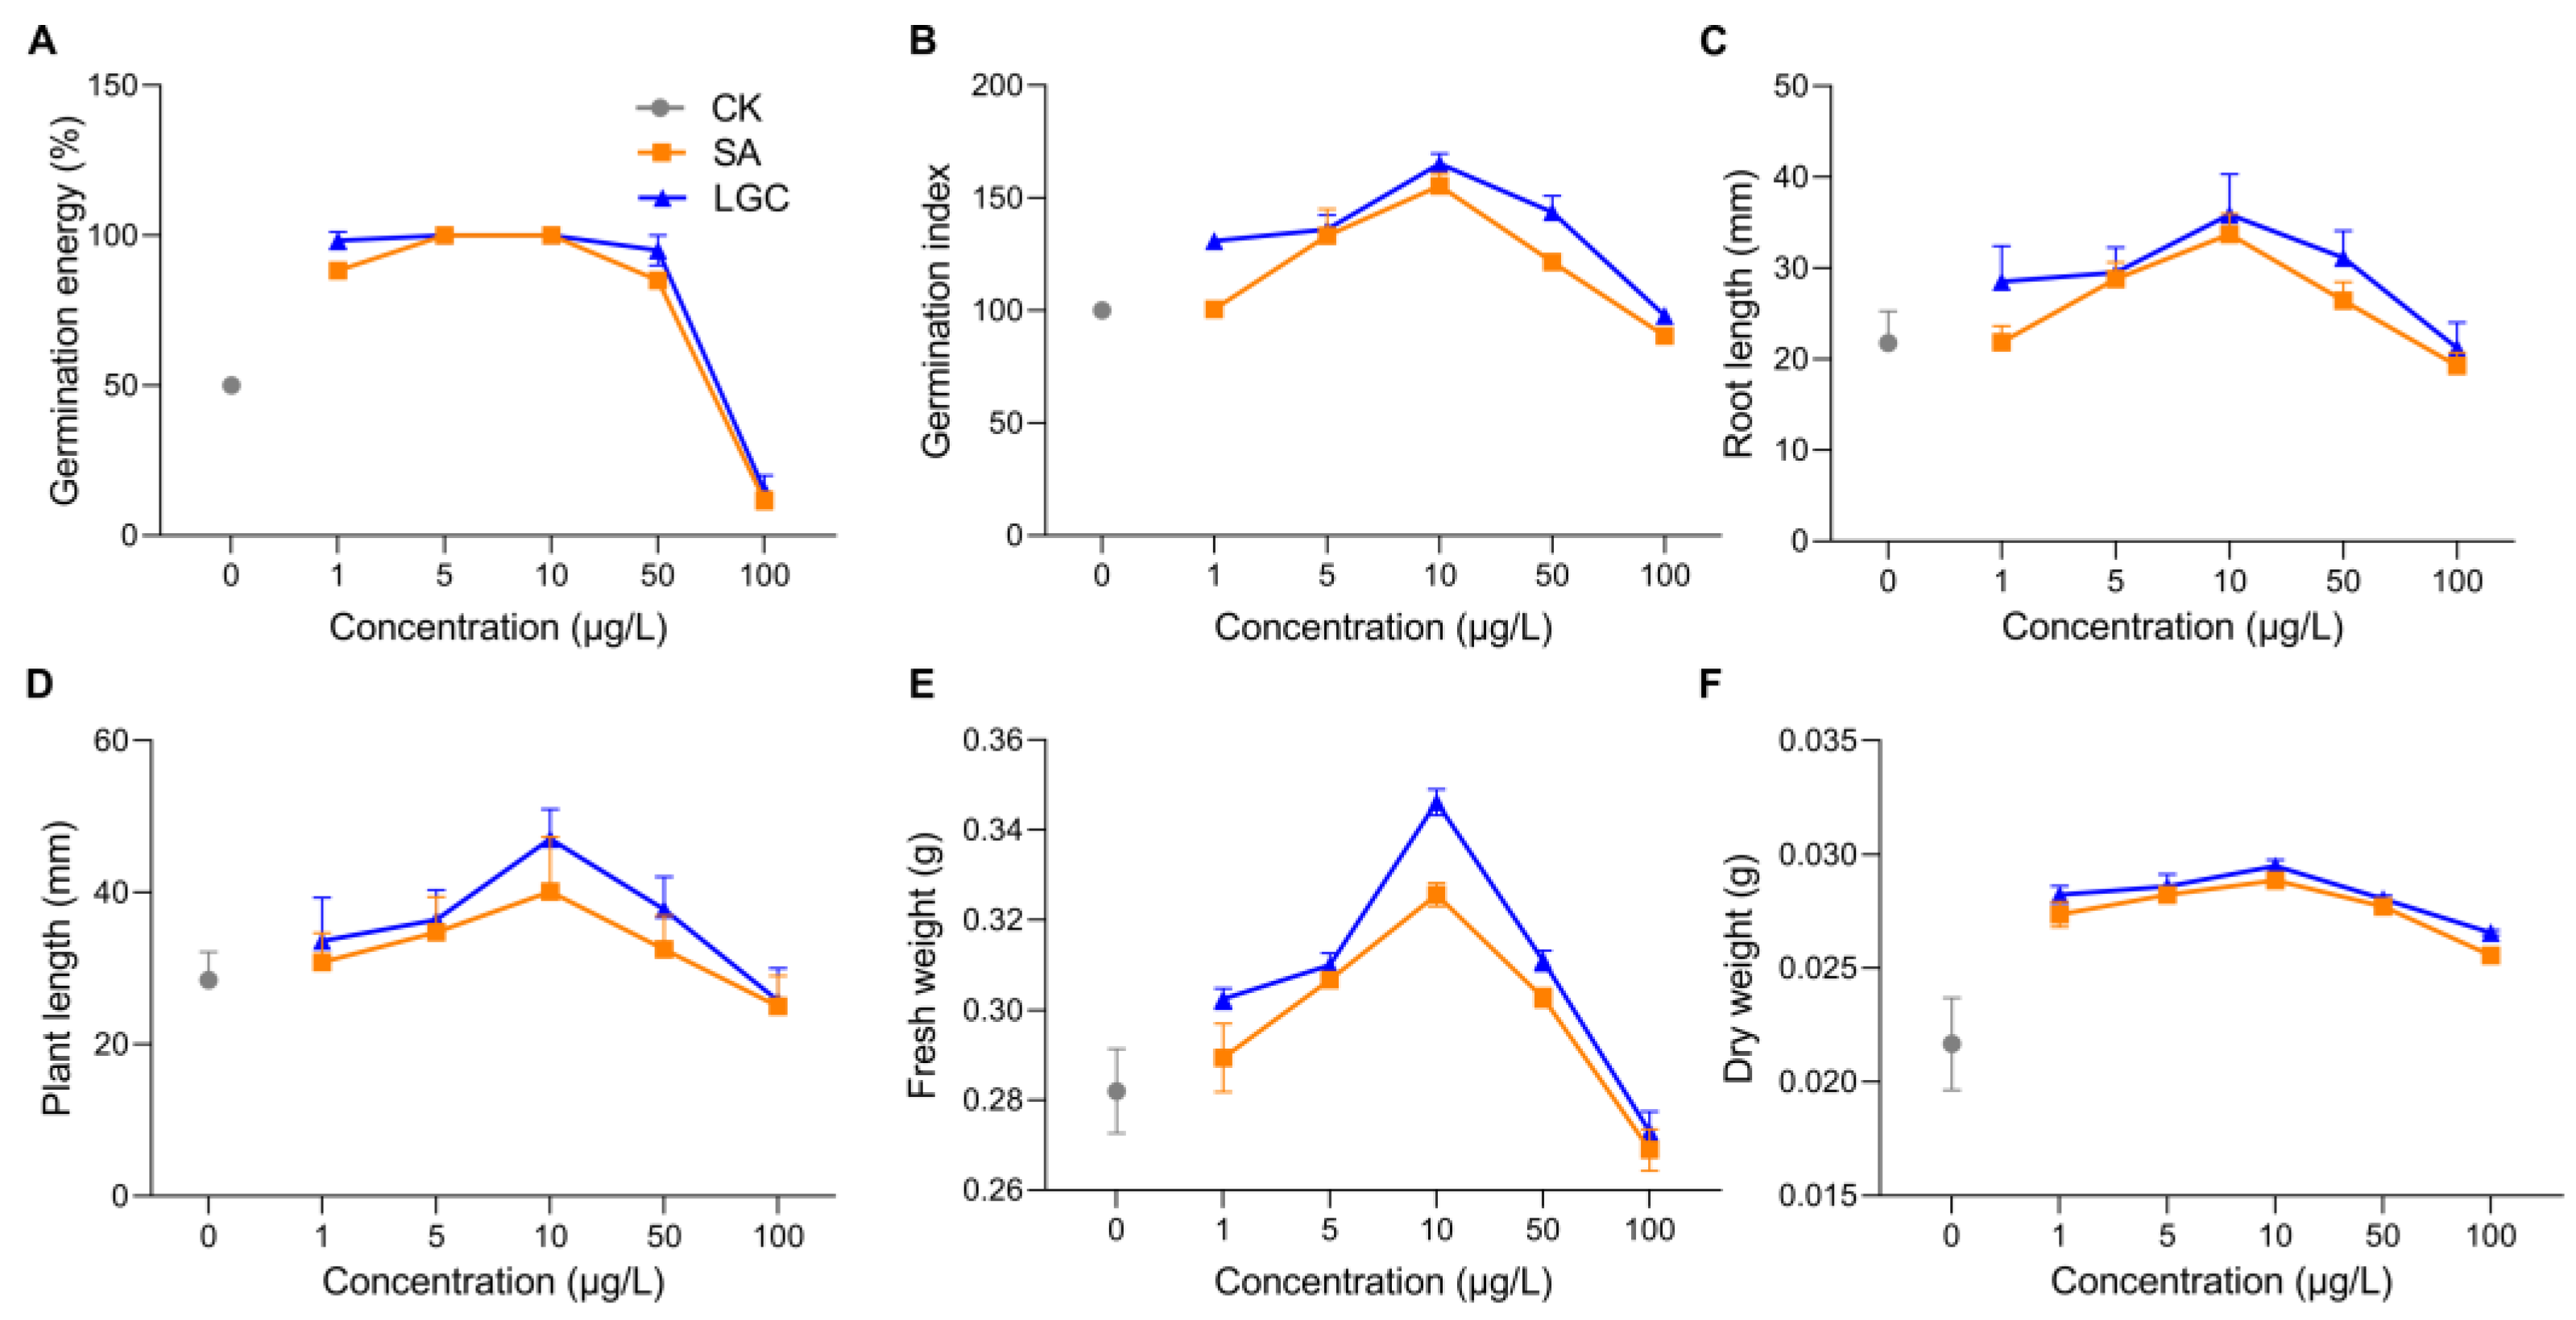
Figure 2. LGC and SA on germination energy (A), germination index (B) as well as seedling root length (C), plant length (D), fresh weight (E), and dry weight (F). Data are mean ± SD. (A,B,E,F), n = 3; (C,D), n = 60.
The growth of plants can be evaluated by root length (Figure 2C), plant length (Figure 2D), fresh weight (Figure 2E), and dry weight (Figure 2F) of seedlings. These data showed the same trend peaking at a concentration of 10 μg/L and then decreasing.
3. LC-MS/MS Metabolome Analysis
To observe the changes of metabolites with the increase of LGC concentration, researchers created three groups for metabolome investigation, including a blank (G1), low dose treated group (G2), and a high dose group (G3). They first analyzed the effect of LGC on the overall metabolome of tomato seedlings (Solanum lycopersicum, sly). As shown in Figure 3A, the PCA diagram indicated that LGC had a limited effect on the overall metabolome with a total difference of 24% in both vertical and horizontal directions. The sPLS-DA plot (Figure 3B) showed that the three groups of samples occupied relatively independent spaces, and the three groups of detected ions were distinguished. These differences of metabolome indicated can be explored further.
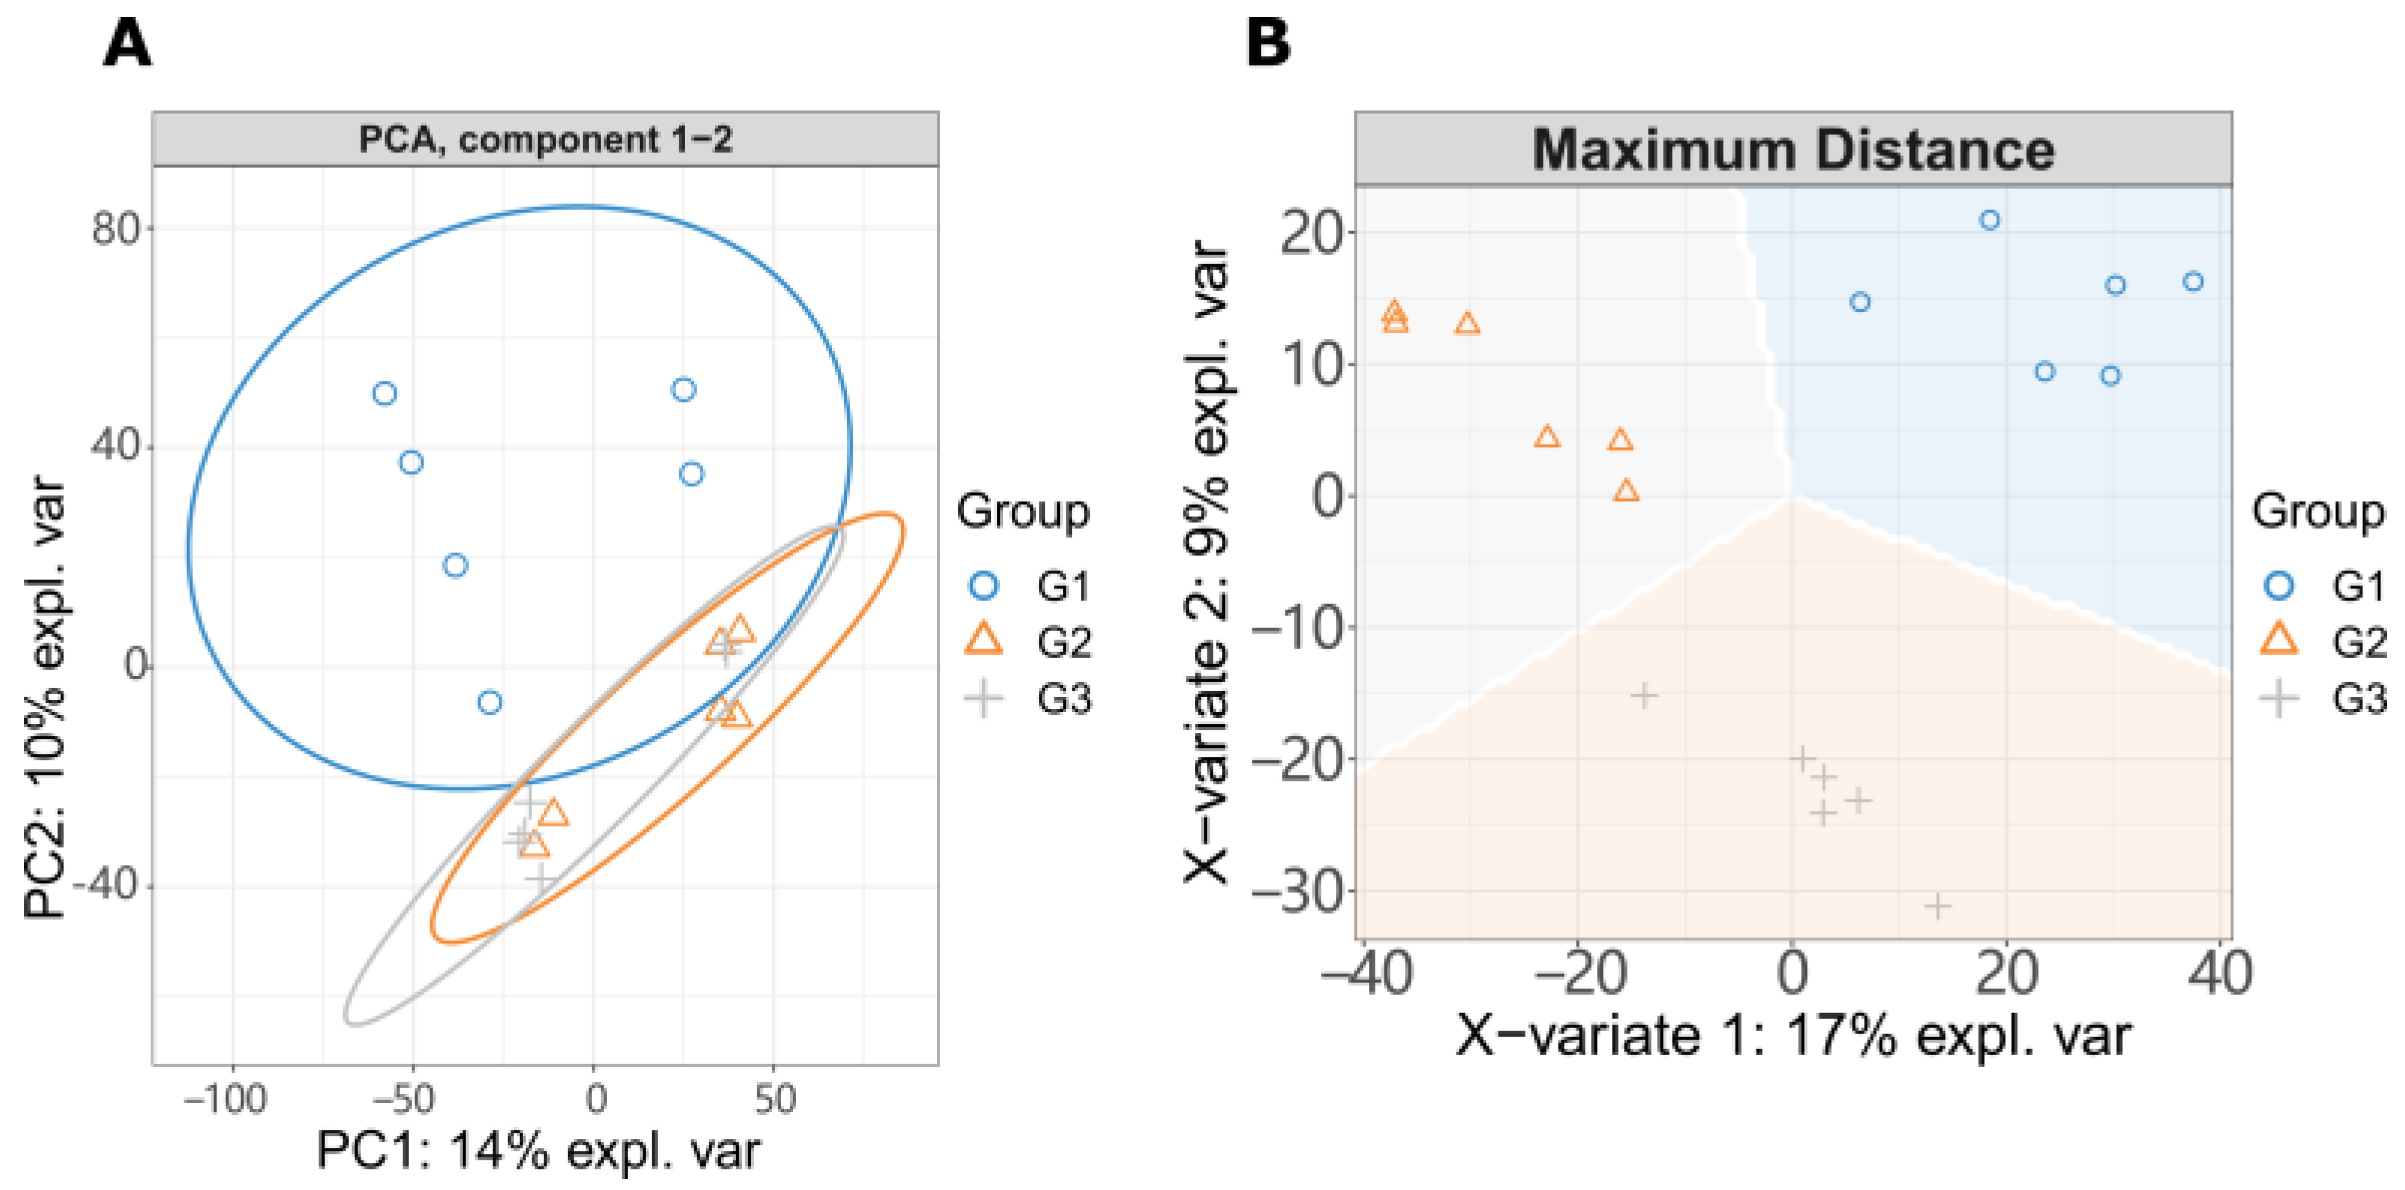
Figure 3. LC-MS/MS detected ions analysis. (A) PCA analysis. G1, tomato seeds soaking in water; G2, tomato seeds treated with 10 μg/L LGC; G3, tomato seeds treated with 100 μg/L LGC. (B) sPLS-DA analysis.
The metabolites were identified based on full MS m/z and MS/MS spectra from the MSP database, whose entries were washed and limited to those KEGG compounds with important physiological roles (KEGG br08001, br08002, br08003, br08021). The mass accuracy was set as ±0.002 m/z for data collection and metabolite annotation. The differential metabolites (DMs) were acquired by comparing G2 vs. G1, G3 vs. G2 and G3 vs. G1, respectively, as shown in the volcano Figure 4A–C. In total, 10 DMs were screened out with the thresholds of p < 0.02, as shown in the Venn plots (Figure 4D). Among them, two metabolites were associated with both comparisons of G2 vs. G1 and G3 vs. G2, which were l-phenylalanine (C00079) and l-tryptophan (C00078). Another three metabolites were related with both comparisons of G2 vs. G1 and G3 vs. G1, which were nicotinamide (C00153), l-pyroglutamic acid (C01879) and glutamine (C00064), respectively.
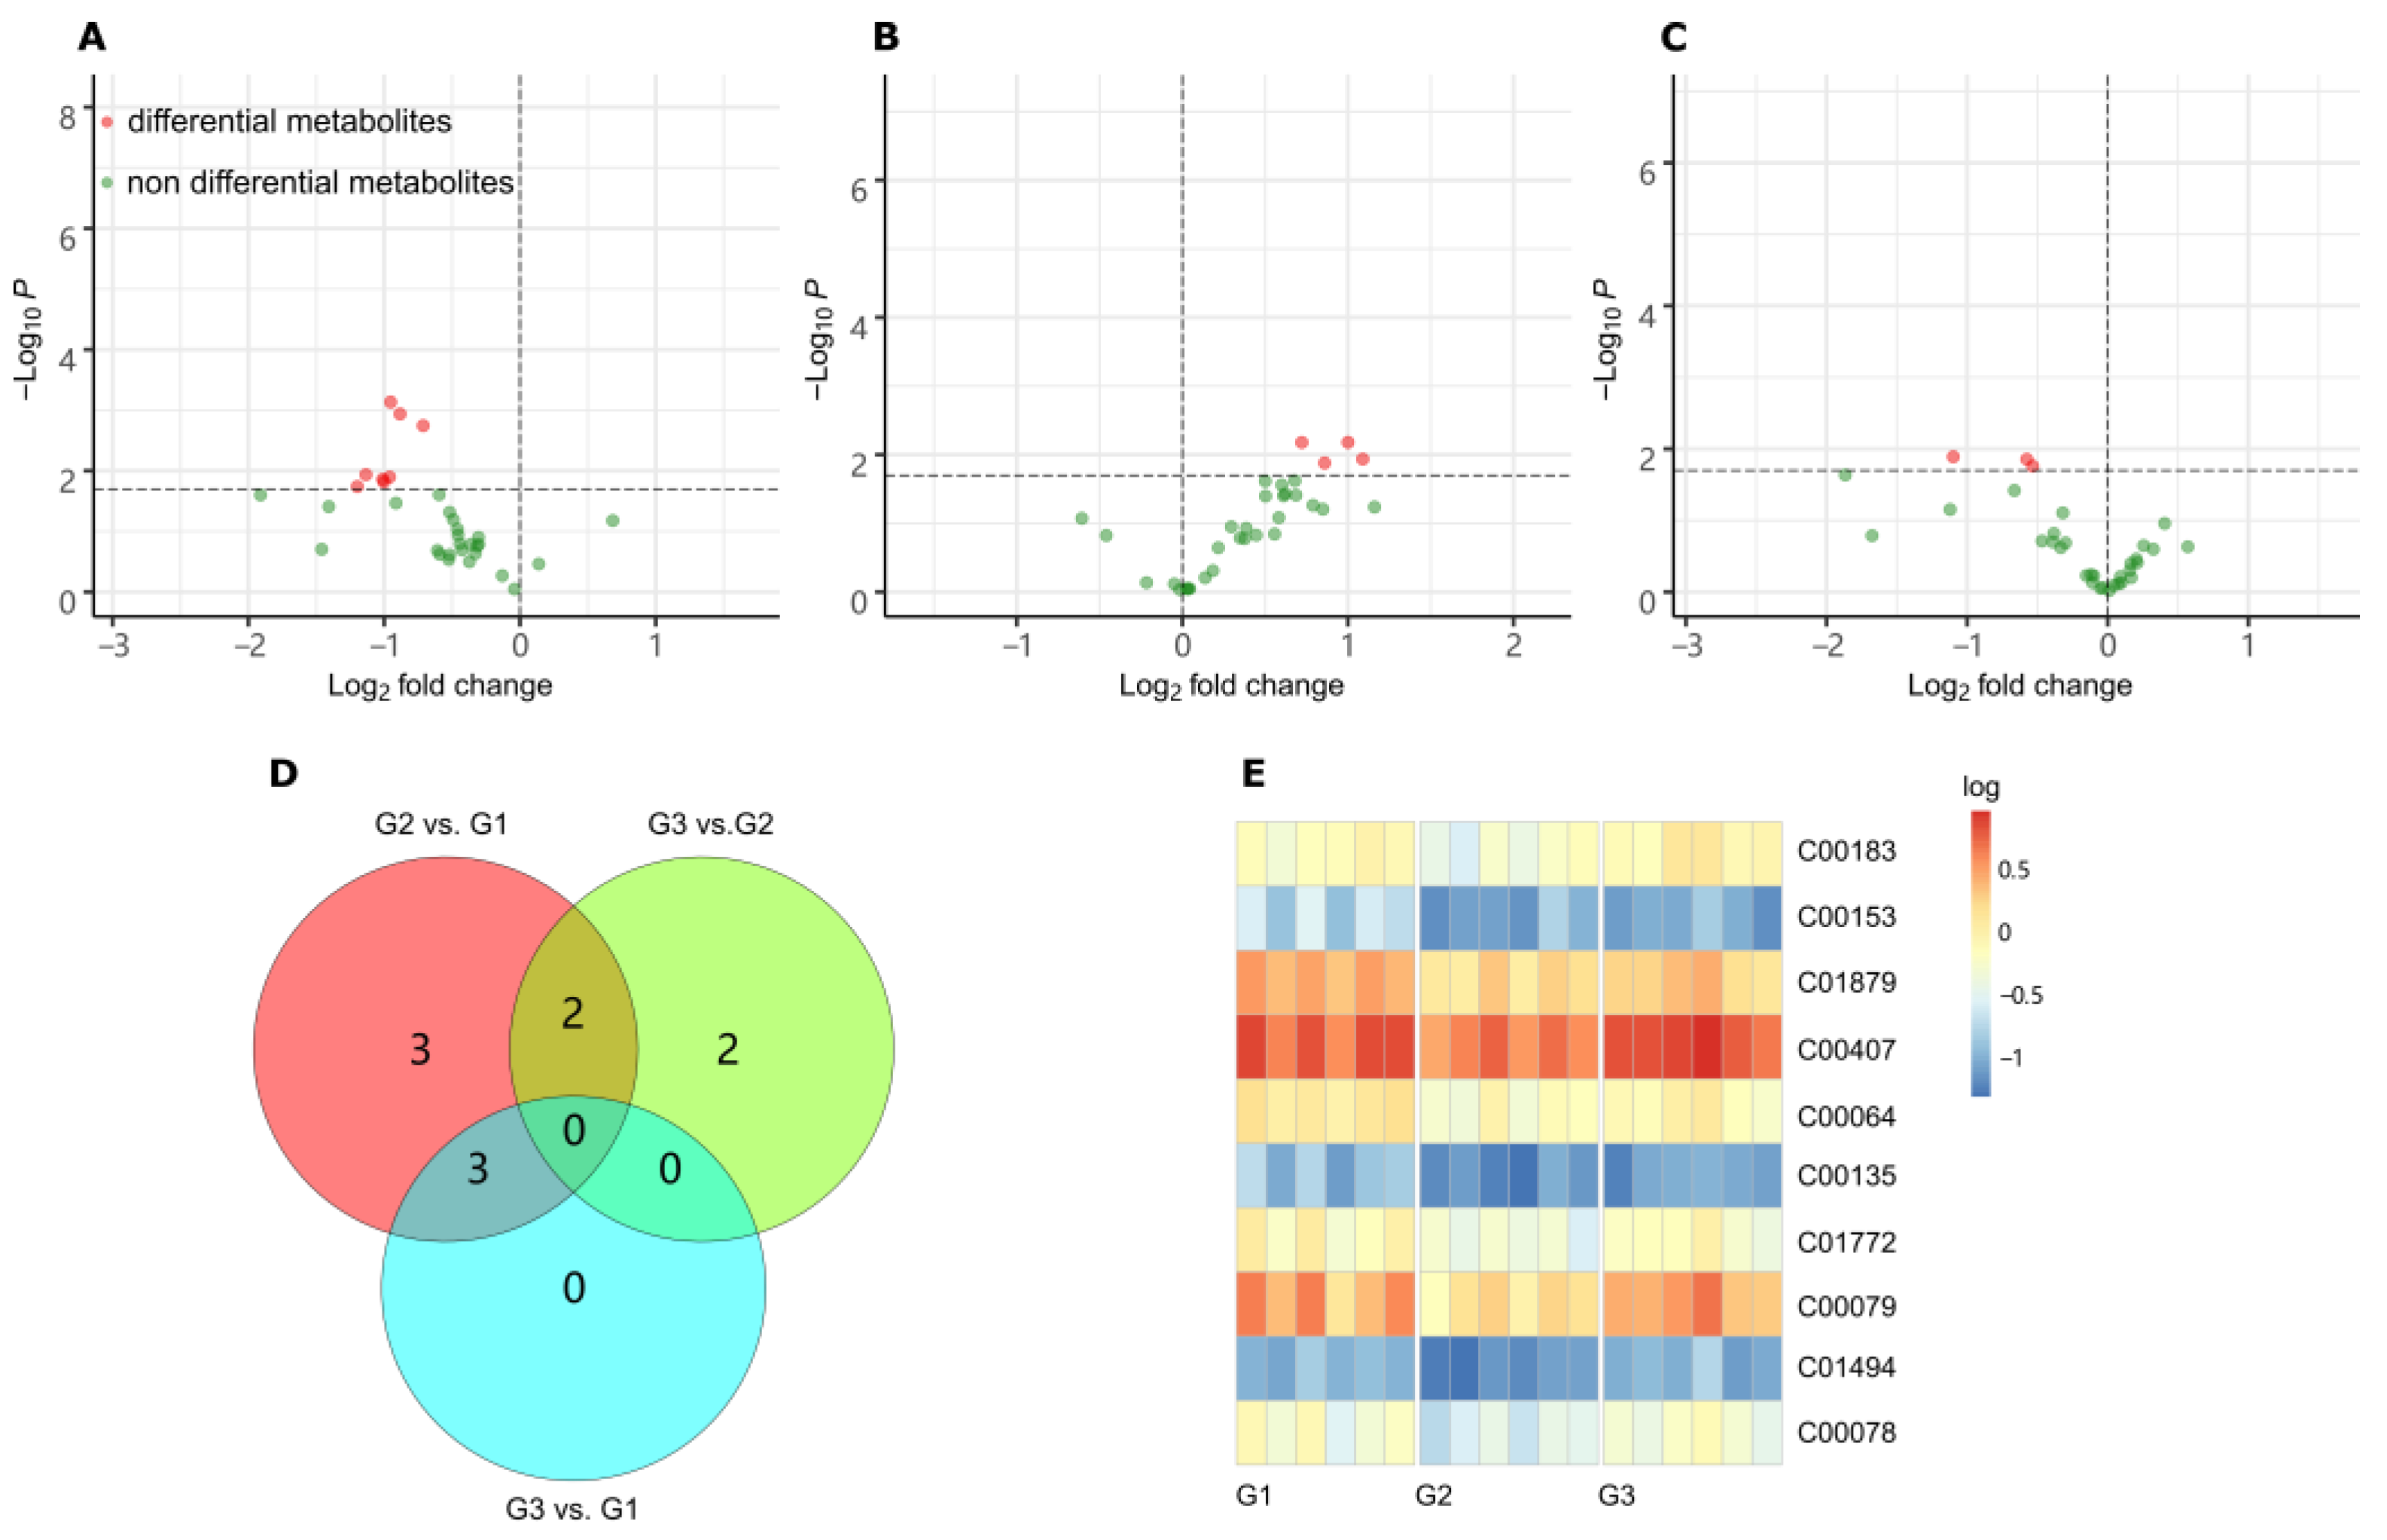
Figure 4. LC-MS/MS Metabolites analysis. (A) Volcano plot of differential metabolites (DMs) in the contrast of G2 vs. G1 (p < 0.02). (B) Volcano plot of DMs in the contrast of G3 vs. G2 (p < 0.02). (C) Volcano plot of DMs in the contrast of G3 vs. G1 (p < 0.02). (D) Venn plot of DM counts based on contrasts. (E) Heatmap of DMs variation. The vertical coordinate is the KEGG ID of DMs. Color represents the logarithm of the relative content.
The changes of the 10 DMs in the three groups were summarized in the heatmap diagram in Figure 4E, seven of which are amino acids. When G2 was compared to G1, the most significant changes were phenylalanine (KEGG ID, C00079), nicotinamide (C00153), tryptophan (C00078), and trans-2-hydroxycinnamate (C01772). They have down-regulated more than 2.0-fold. While G3 was compared to G2, the expression levels of four amino acids (phenylalanine, valine, tryptophan, and isoleucine) increased significantly (more than 2.0-fold). The most increased amino acid was l-phenylalanine, which was also the most significantly decreased amino acid in the other contrast group G3 vs. G1.
4. Pathways Responding to LGC Regulation
The DMs related pathways were enriched by MetaboAnalyst 5.0 associated with the KEGG database. There is no tomato (sly) option in MetaboAnalyst. Researchers therefore used Arabidopsis data for pathway enrichment since both sly and Arabidopsis are Eudicots plants. As shown in Figure 5, significantly related metabolic pathways were gathered. Five pathways were prominent according to the pathway impact and t-test p values. These five pathways were phenylalanine metabolism, alanine, aspartate and glutamate metabolism, tryptophan metabolism, phenylpropanoid biosynthesis and phenylalanine, tyrosine and tryptophan biosynthesis, information for which are shown in Table 1.
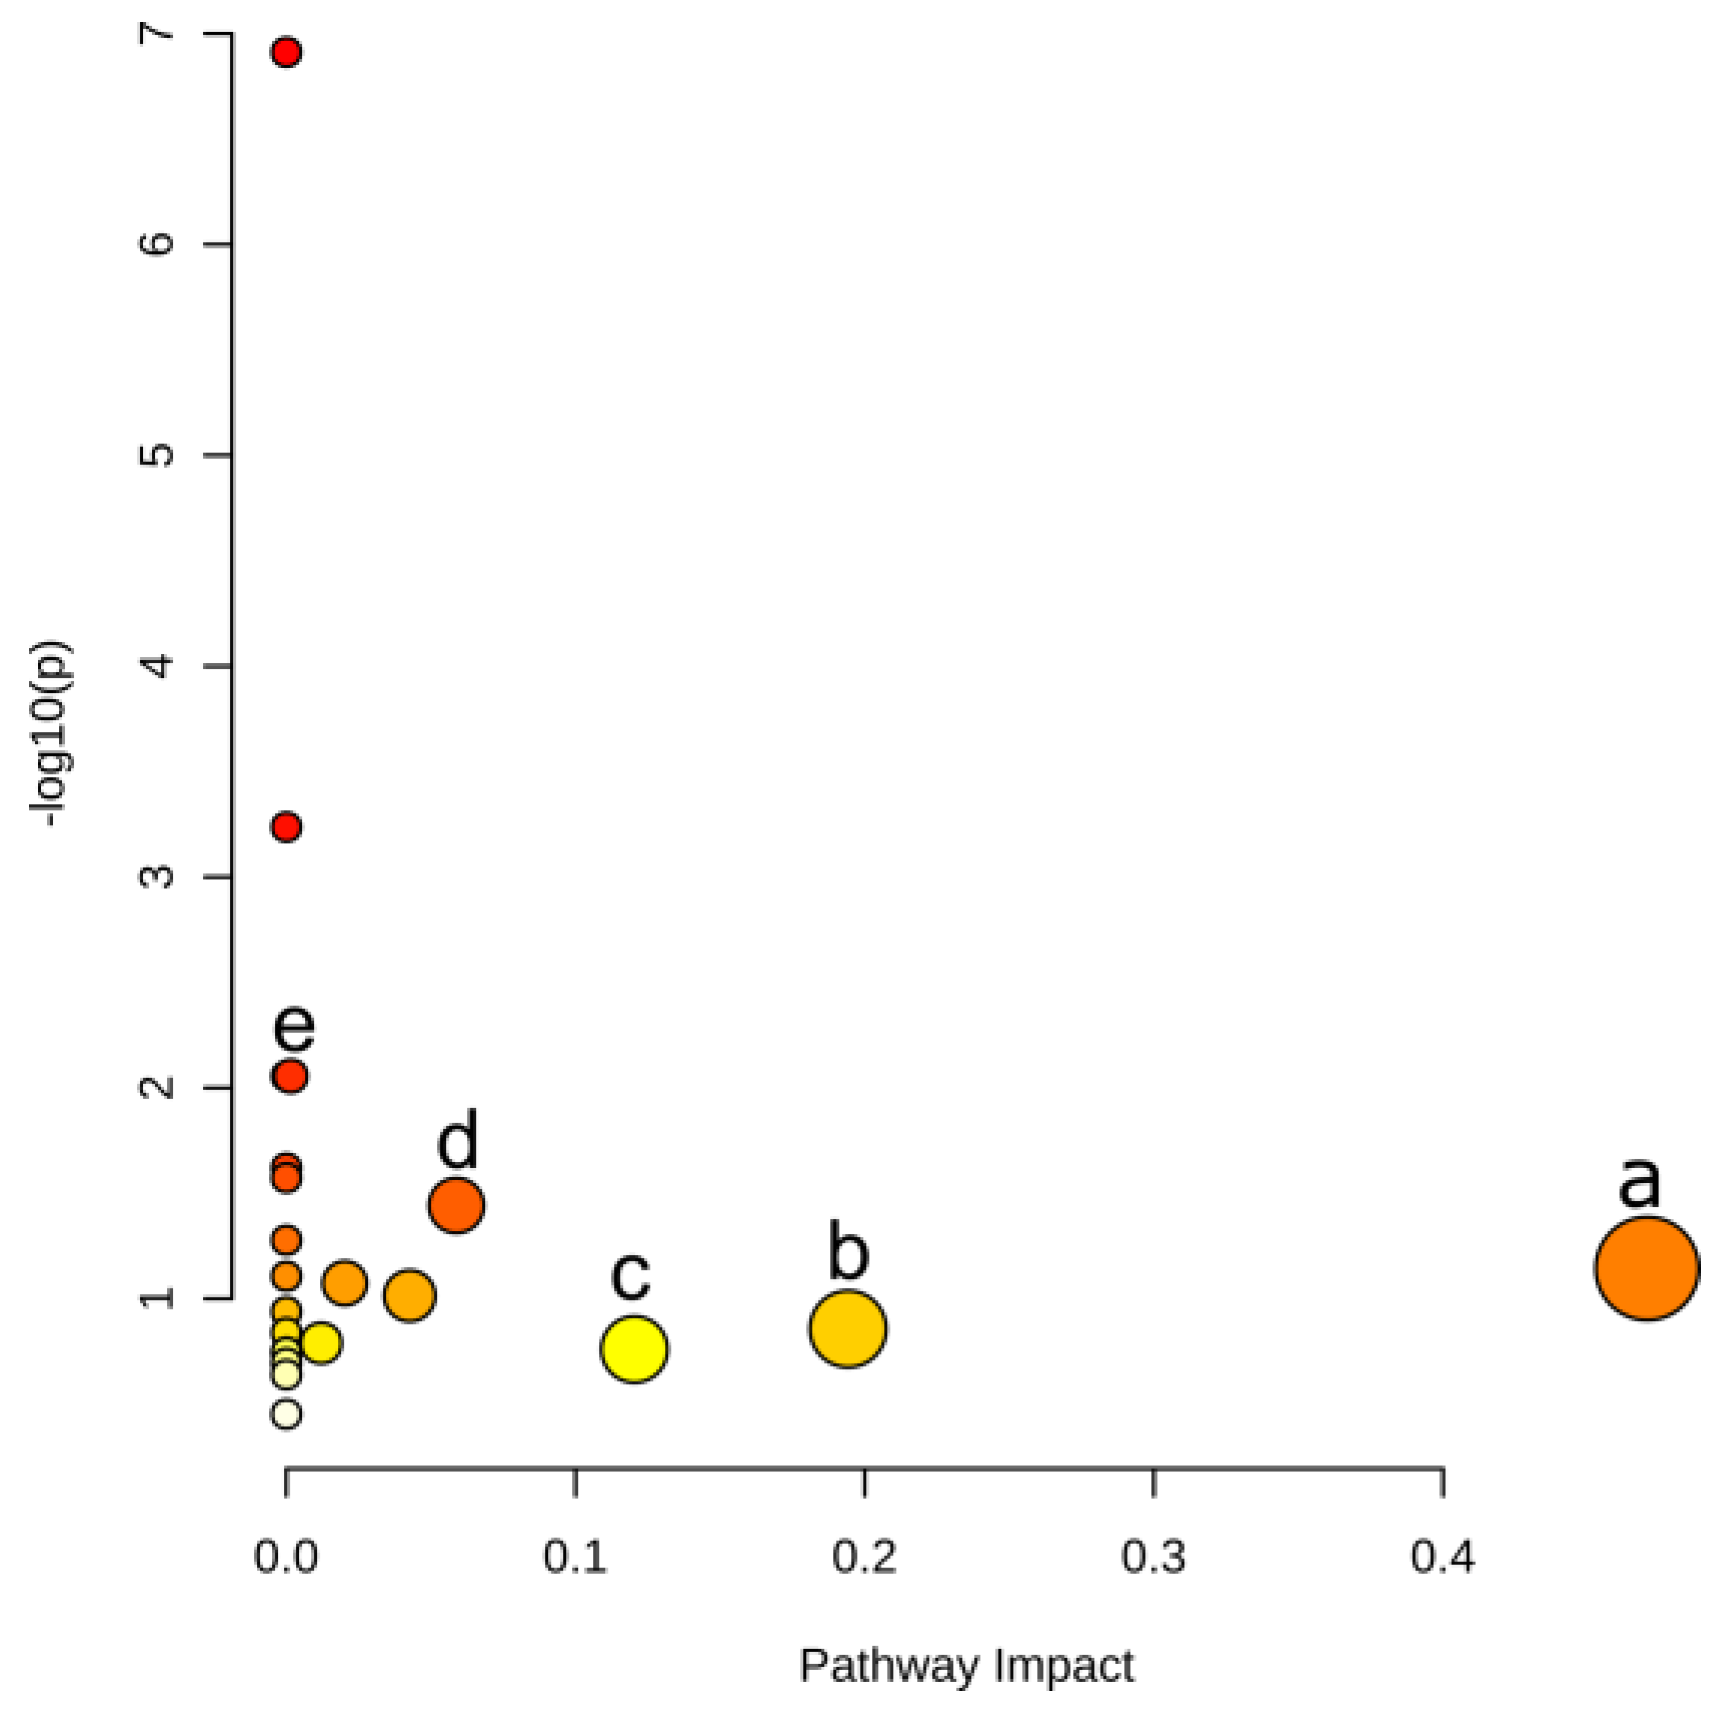
Figure 5. Pathway enrichment based on DMs. Points represent pathways, where size and color are correlated with the pathway impact. (a) Phenylalanine metabolism, (b) Alanine, aspartate and glutamate metabolism, (c) Tryptophan metabolism, (d) Phenylpropanoid biosynthesis, (e) Phenylalanine, tyrosine and tryptophan biosynthesis.
Table 1. Matched features in KEGG pathways analysis.
| Pathway | –logP | Impact | Matched Features |
|---|---|---|---|
| Phenylalanine metabolism | 1.14 | 0.470 | l-phenylalanine (C00079) |
| Alanine, aspartate and glutamate metabolism | 0.86 | 0.194 | l-glutamine (C00064) |
| Tryptophan metabolism | 0.76 | 0.120 | l-tryptophan (C00078) |
| Phenylpropanoid biosynthesis | 1.44 | 0.059 | l-phenylalanine (C00079); ferulate (C01494) |
| Phenylalanine, tyrosine and tryptophan biosynthesis | 2.05 | 0.002 | l-phenylalanine (C00079); l-tryptophan (C00078) |
Enrichment analysis of FELLA (an R package) encompasses the closely associated pathways or metabolic modules to facilitate the observation of the overall metabolic response. Researchers applied FELLA to enrich related reactions, enzymes, and pathways to the DMs. Phenylalanine metabolism, valine, leucine and isoleucine biosynthesis and glutathione metabolism pathways were enriched as shown in Figure 6. Phenylpropane metabolism is one of the most important plant secondary metabolic pathways, producing a variety of metabolites such as lignans. Valine, leucine and isoleucine biosynthesis responds differently when plants experience abiotic stresses during growth, and valine and leucine concentrations increase when plants are subjected to drought stress [16]. Glutathione metabolism is also essential for plant growth, especially in the regulation of ROS [17][18].
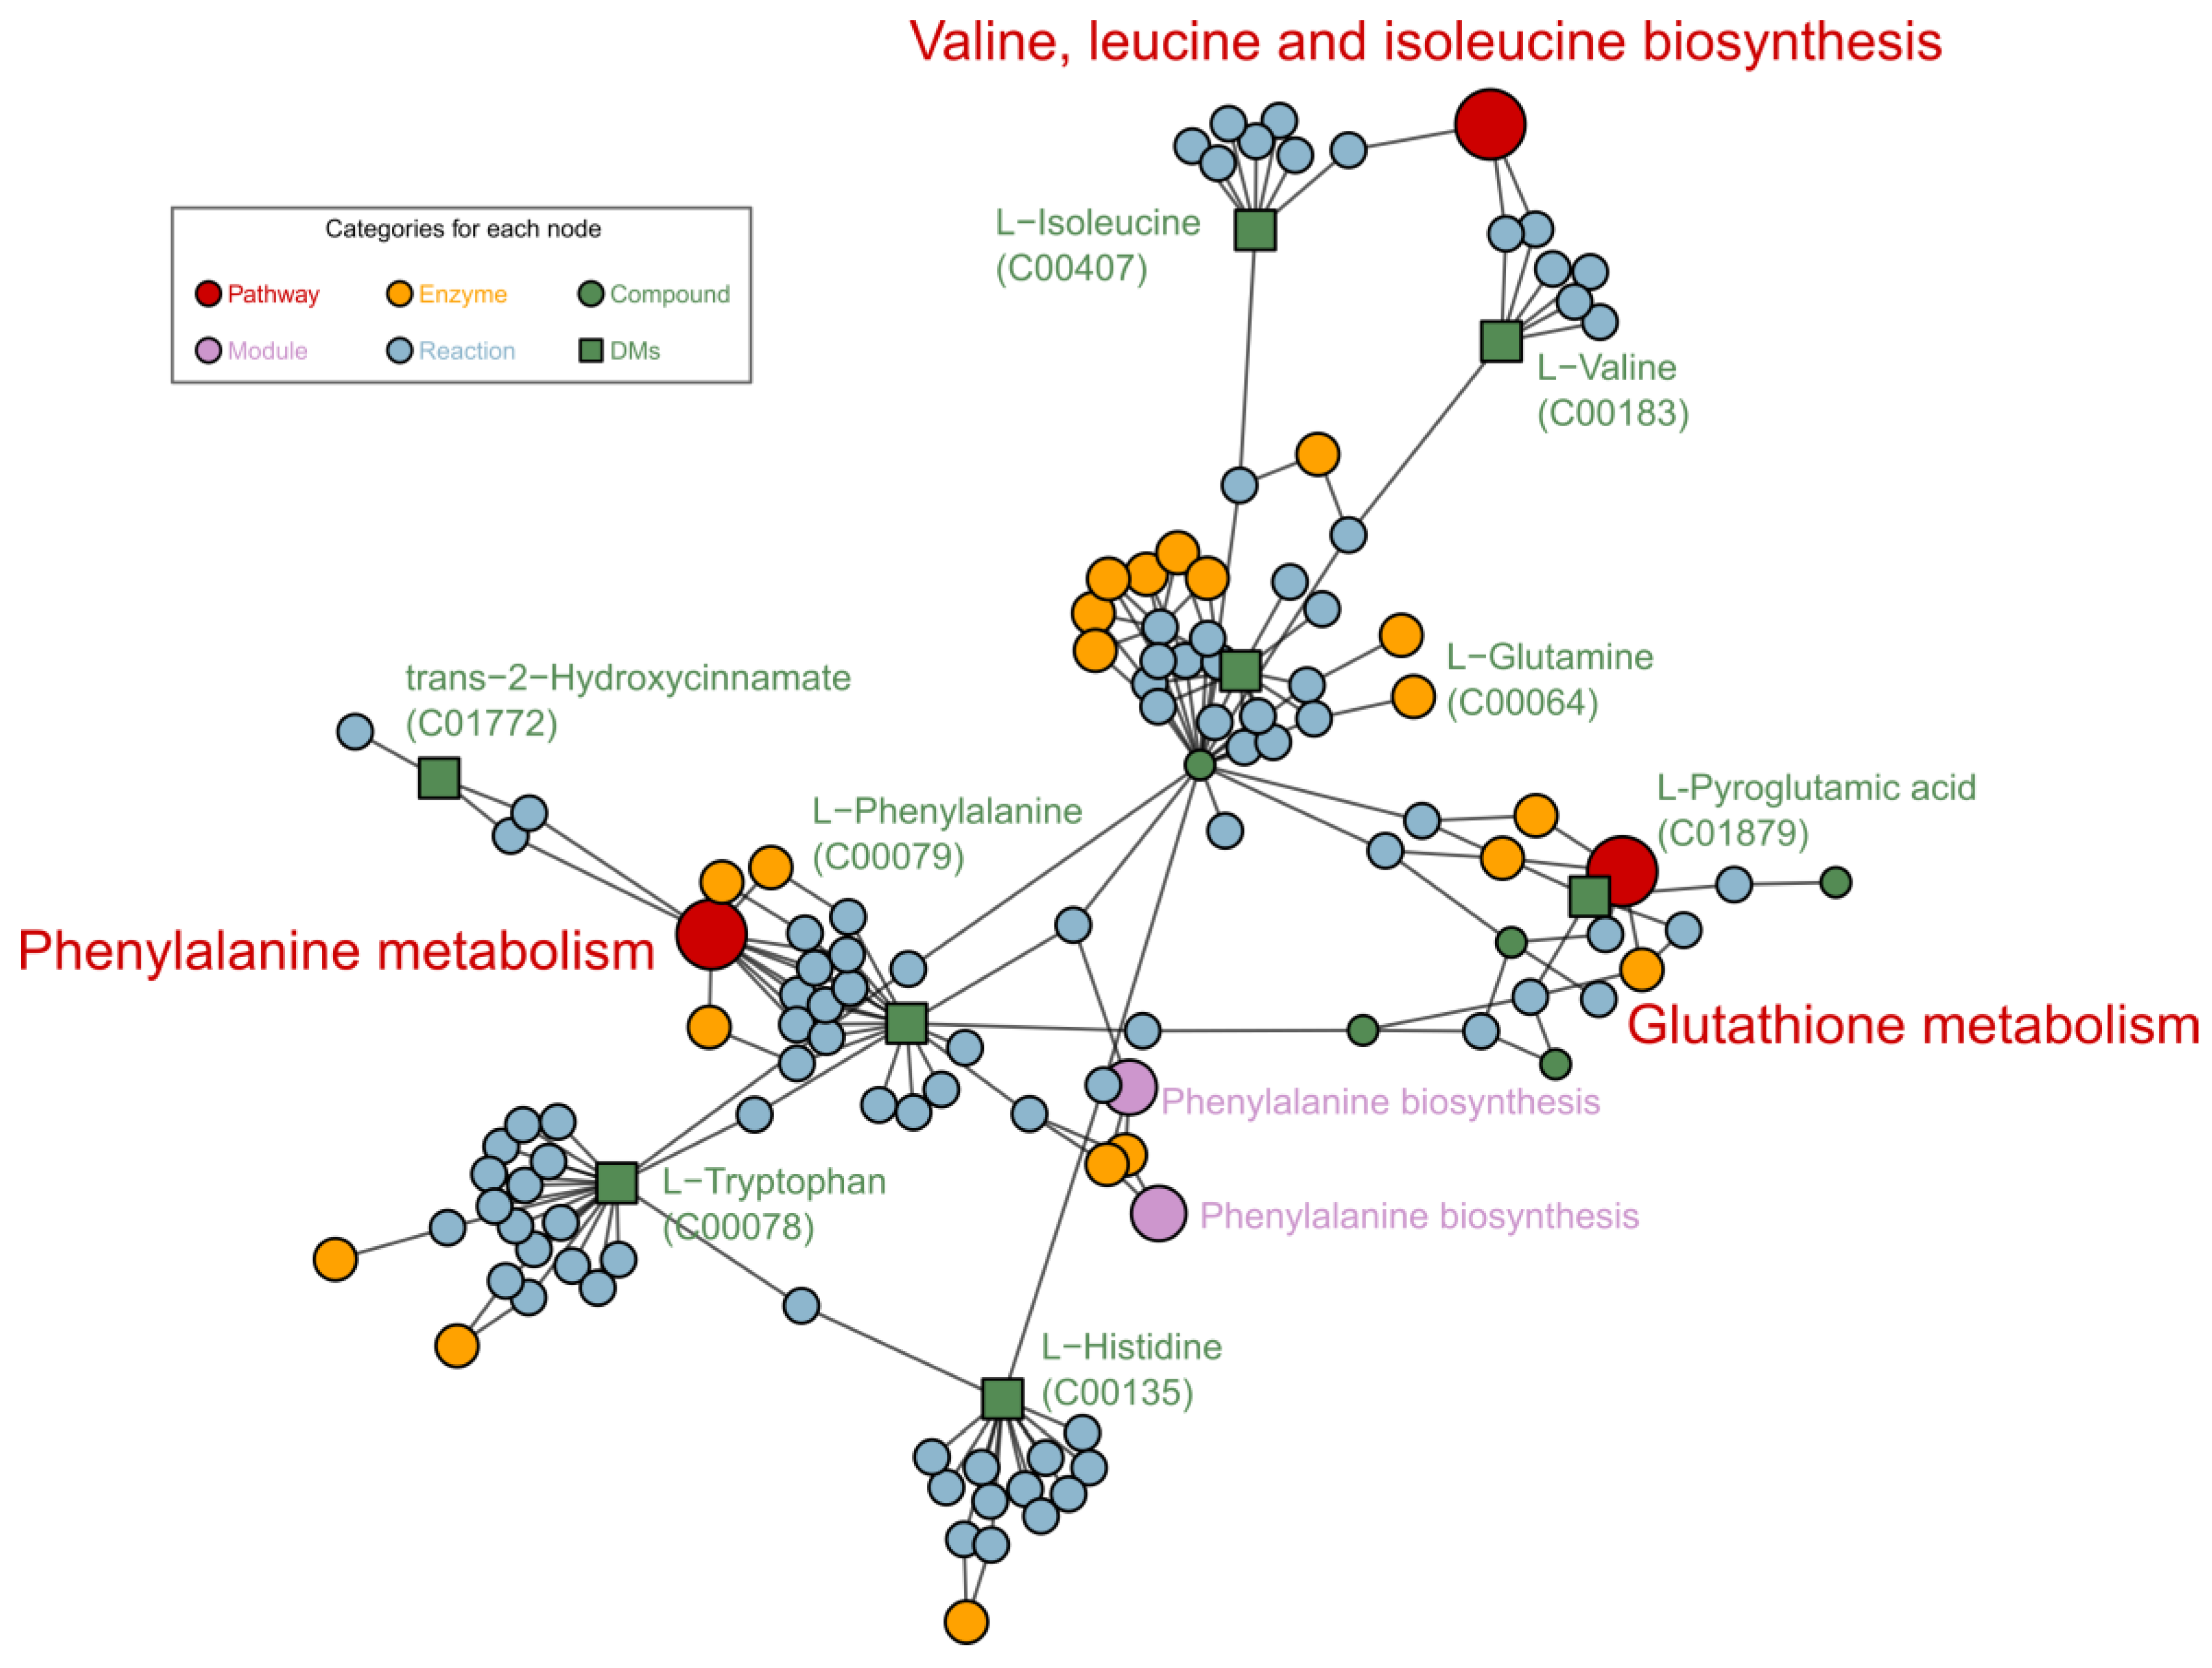
Figure 6. Metabolic pathways generated by FELLA, enriched based on KEGG sly data.
5. Phenotype Verification
Lignin is one of the signature metabolites of the above metabolic pathways and is easily measured. Researchers therefore tested their conjecture by measuring the amount of lignin. As shown in Figure 7, the lignin expression decreased significantly in the G2 group but increased in the G3 group with increasing concentrations of LGC. This trend is consistent with the phenylalanine, ferulate and 2-hydroxycinnamate variations in metabolome analysis.
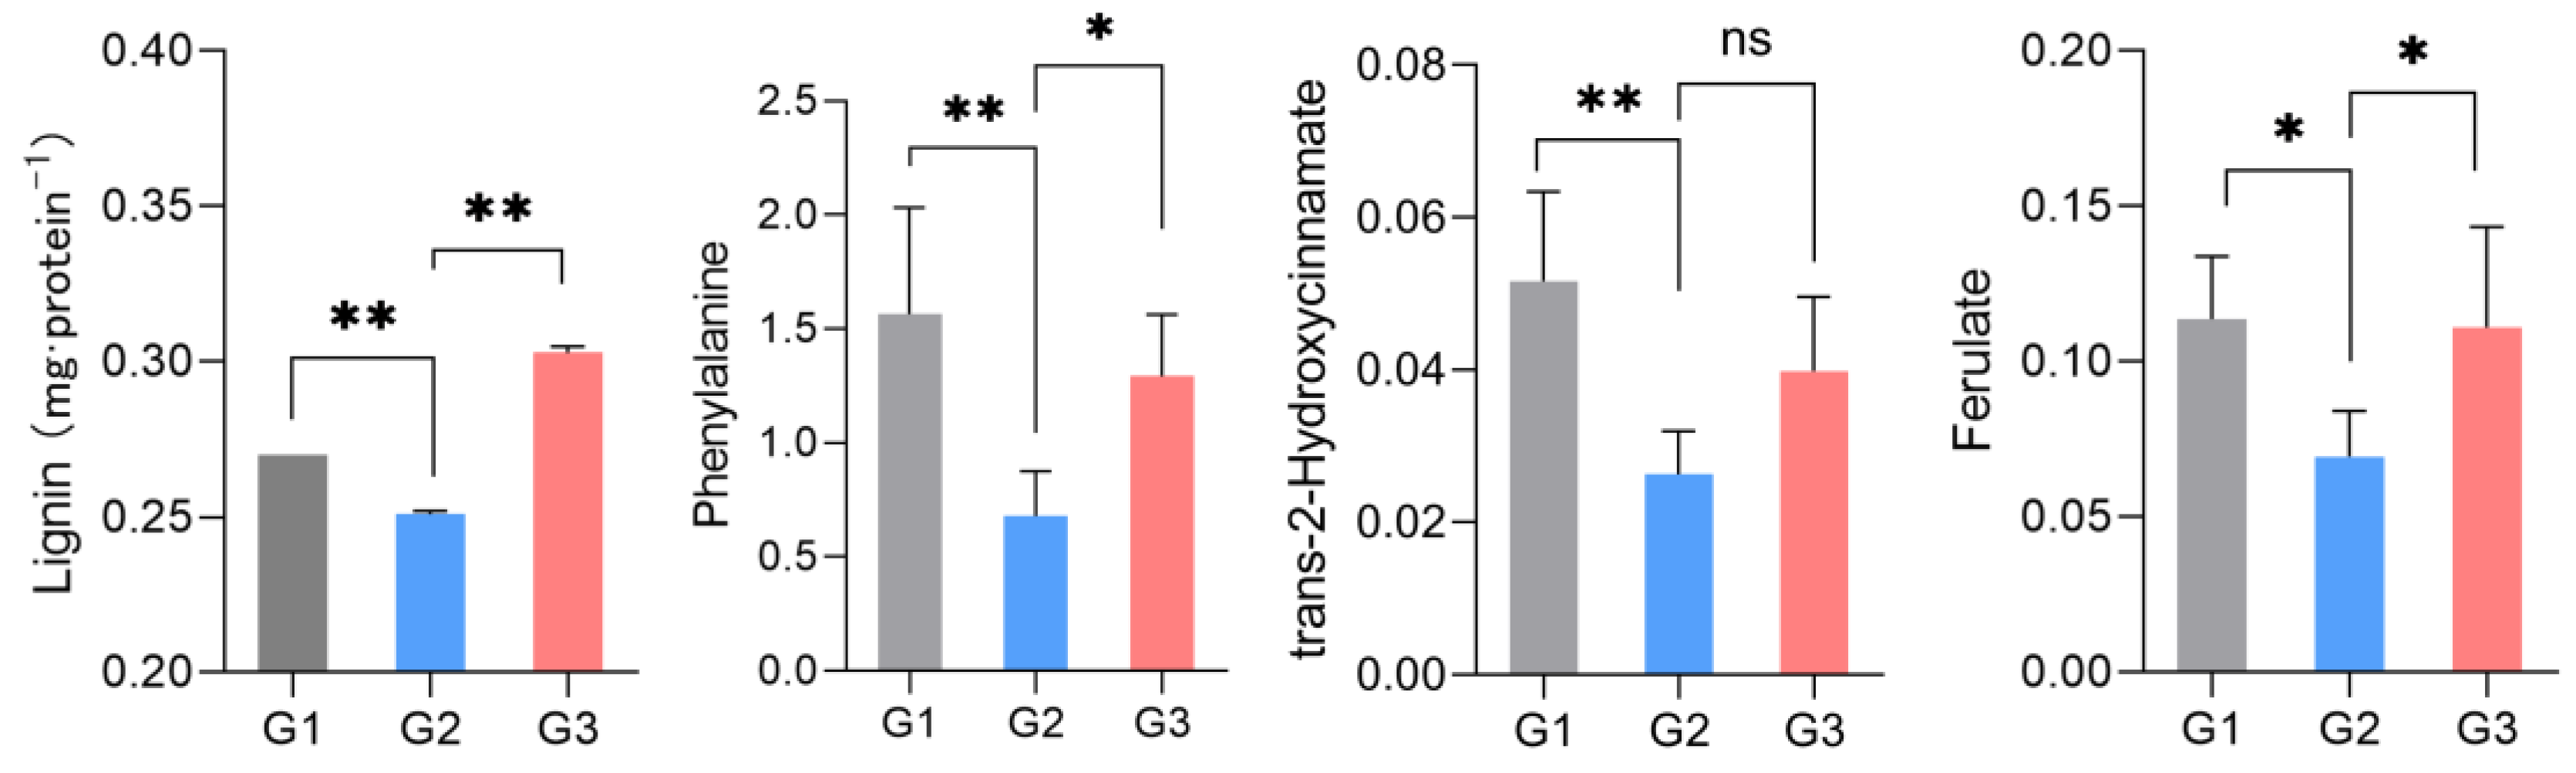
Figure 7. Lignin, phenylalanine, 2-hydroxycinnamate and ferulate expression regulated by LGC. * (p < 0.05), ** (p < 0.01), n = 6. ns = no significant difference.
This entry is adapted from the peer-reviewed paper 10.3390/ijms23062990
References
- Rademacher, W. Plant Growth Regulators: Backgrounds and Uses in Plant Production. J. Plant Growth Regul. 2015, 34, 845–872.
- Steber, C.M.; McCourt, P. A Role for Brassinosteroids in Germination in Arabidopsis. Plant Physiol. 2001, 125, 763–769.
- Li, T.; Lei, W.; He, R.; Tang, X.; Han, J.; Zou, L.; Yin, Y.; Lin, H.; Zhang, D. Brassinosteroids Regulate Root Meristem Development by Mediating BIN2-UPB1 Module in Arabidopsis. PLoS Genet. 2020, 16, e1008883.
- Huang, G.; Han, M.; Yao, W.; Wang, Y. Transcriptome Analysis Reveals the Regulation of Brassinosteroids on Petal Growth Gerbera hybrida. PeerJ 2017, 5, e3382.
- Ye, H.; Liu, S.; Tang, B.; Chen, J.; Xie, Z.; Nolan, T.M.; Jiang, H.; Guo, H.; Lin, H.-Y.; Li, L.; et al. RD26 Mediates Crosstalk between Drought and Brassinosteroid Signalling Pathways. Nat. Commun. 2017, 8, 14573.
- Hou, J.; Zhang, Q.; Zhou, Y.; Ahammed, G.J.; Zhou, Y.; Yu, J.; Fang, H.; Xia, X. Glutaredoxin GRXS16 Mediates Brassinosteroid-Induced Apoplastic H2O2 Production to Promote Pesticide Metabolism in Tomato. Environ. Pollut. 2018, 240, 227–234.
- De Bock, P.; Van Bockstaele, F.; Muylle, H.; Quataert, P.; Vermeir, P.; Eeckhout, M.; Cnops, G. Yield and Nutritional Characterization of Thirteen Quinoa (Chenopodium Quinoa Willd.) Varieties Grown in North-West Europe—Part I. Plants 2021, 10, 2689.
- Baik, I.-H.; Kim, K.-H.; Lee, K.-A. Antioxidant, Anti-Inflammatory and Antithrombotic Effects of Ginsenoside Compound K Enriched Extract Derived from Ginseng Sprouts. Molecules 2021, 26, 4102.
- Le, N.T.M.; Cuong, D.X.; Thinh, P.V.; Minh, T.N.; Manh, T.D.; Duong, T.-H.; Minh, T.T.L.; Oanh, V.T.T. Phytochemical Screening and Evaluation of Antioxidant Properties and Antimicrobial Activity against Xanthomonas Axonopodis of Euphorbia Tirucalli Extracts in Binh Thuan Province, Vietnam. Molecules 2021, 26, 941.
- Shvets, S.A.; Gutsu, O.N.; Kintia, P.K. Steroidal Glycosides from Nicotiana Tabacum L. Seeds and Their Biological Activity. In Saponins Used in Food and Agriculture; Advances in Experimental Medicine and Biology; Waller, G.R., Yamasaki, K., Eds.; Springer: Boston, MA, USA, 1996; pp. 247–257. ISBN 978-1-4613-0413-5.
- Santos Wagner, A.L.; Araniti, F.; Bruno, L.; Ishii-Iwamoto, E.L.; Abenavoli, M.R. The Steroid Saponin Protodioscin Modulates Arabidopsis Thaliana Root Morphology Altering Auxin Homeostasis, Transport and Distribution. Plants 2021, 10, 1600.
- Nikaido, T.; Ohmoto, T.; Kubo, S.; Mimaki, Y.; Sashida, Y. Steroidal Saponins from the Rhizomes of Smilax sieboldii. Phytochemistry 1992, 31, 2445–2450.
- Iglesias-Arteaga, M.A.; Gil, R.P.; Martínez, C.S.P.; Manchado, F.C. Spirostanic Analogues of Teasterone. Synthesis, Characterisation and Biological Activity of Laxogenin, (23S)-Hydroxylaxogenin and 23-Ketolaxogenin (23-Oxolaxogenin). J. Chem. Soc. Perkin Trans. 1 2001, 261–266.
- Wang, Q.; Xu, J.; Liu, X.; Gong, W.; Zhang, C. Synthesis of Brassinosteroids Analogues from Laxogenin and Their Plant Growth Promotion. Nat. Prod. Res. 2015, 29, 149–157.
- Zhang, C.L.; Wang, D.M.; Zhu, W.; Zhang, H.L. Study on Chemical Constituents from Stem of Smilax scobinicaulis. Chin. Pharm. J. 2006, 41, 1540–1542.
- Joshi, V.; Joung, J.-G.; Fei, Z.; Jander, G. Interdependence of Threonine, Methionine and Isoleucine Metabolism in Plants: Accumulation and Transcriptional Regulation under Abiotic Stress. Amino Acids 2010, 39, 933–947.
- Thangamani, S.; Eldesouky, H.E.; Mohammad, H.; Pascuzzi, P.E.; Avramova, L.; Hazbun, T.R.; Seleem, M.N. Ebselen Exerts Antifungal Activity by Regulating Glutathione (GSH) and Reactive Oxygen Species (ROS) Production in Fungal Cells. Biochimica et Biophysica Acta (BBA)—General Subjects 2017, 1861, 3002–3010.
- Zhang, Z.; Lv, Z.; Wei, Z.; Li, C.; Shao, Y.; Zhang, W.; Zhao, X.; Xiong, J. Microsomal Glutathione Transferase 2 Modulates LTC4 Synthesis and ROS Production in Apostichopus Japonicus. Mol Immunol 2017, 91, 114–122.
This entry is offline, you can click here to edit this entry!