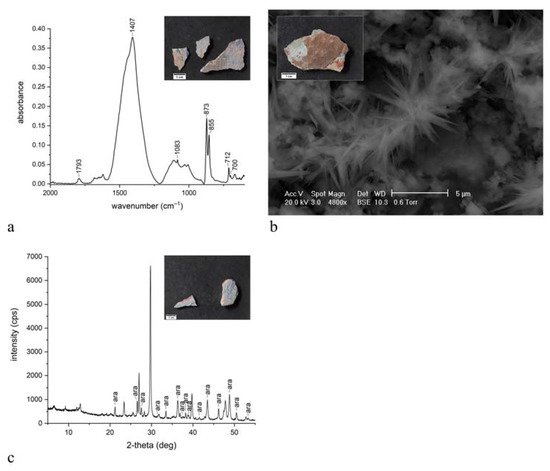
Aragonite is a mineralogical form of calcium carbonate, mainly of biogenic origin. Historical sources report its use in Roman times as an aggregate in mortars, and in the literature it has only been shown in Roman wall paintings. Thus, its use in 16thcentury wall paintings of the church of Santo Stefano in Selva (Cerignale, Apennines of central Italy) is surprising.
- aragonite
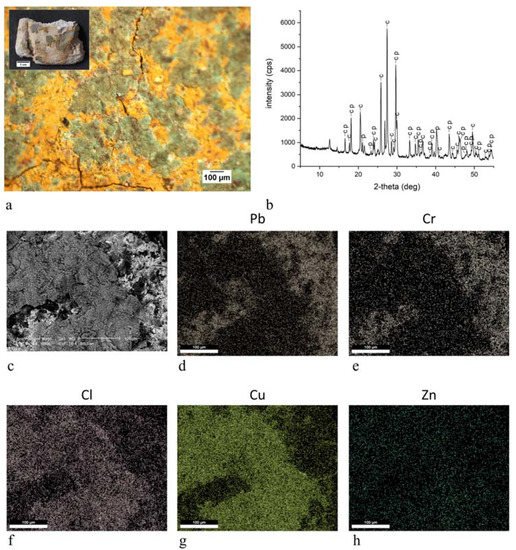
- Brunswick green
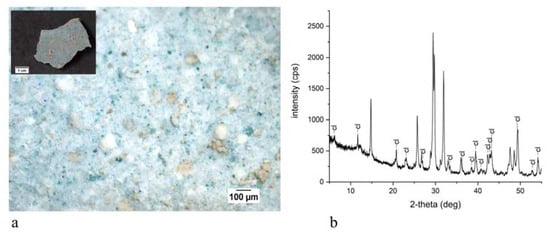
- clinochlore
1. Introduction
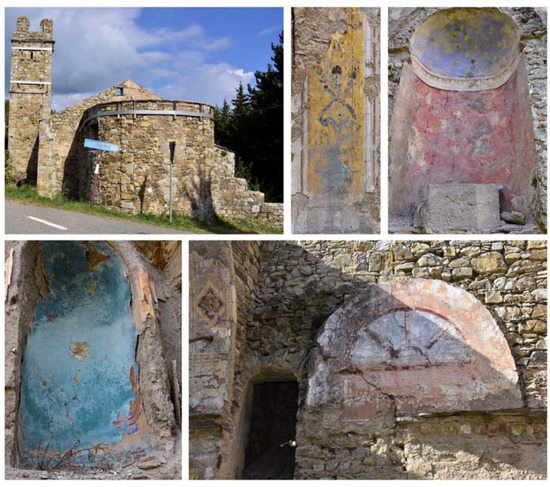
The church of Santo Stefano in Selva (Cerignale) (Figure 1), in the Apennines of Piacenza (central Italy), is in a declining state of neglect and decay. Given its location in a remote area, with no tourism, it is not a high priority for the national heritage. The local community pressed for an analytical campaign on the fragments of the few surviving paintings, in order to preserve their memory.
The area between the Po Valley and the Ligurian Sea was once much travelled, and there were also several historical pilgrimages, along important trade ridgeways, such as the salt routes, which involved the exchange of local goods. One of these routes, the “Strada del Cifalco”, followed the natural path of the Trebbia Valley along the ridge between the Aveto and Trebbia rivers, connecting the north of what today is Liguria with Piacenza. It is thus not surprising that the Apennines, the mountainous system of this area, are rich in artistic testimonies, which unfortunately were neglected during the depopulation after the Second World War. This artistic history can be seen in the municipality of Cerignale too: the village of Ponte Organasco, with its medieval layout and many tower houses; the medieval castle of Cariseto, which hosted Emperor Frederick Barbarossa; and the church of Santo Stefano in Selva. The building is located in an area which was once a point of transit and rest for the muleteers travelling between the Trebbia valley and the Aveto valley, on their way to Liguria.
Documentation on the history of the paintings is scarce. The building is listed in a church register which records the churches that in 1523 sent financial dues to the Papal State. The ruins still reveal the elaborate construction technique adopted to simulate a certain opulence, such as the vaulted ceiling, which looks like it is made of stone, but is actually a wooden structure with the intrados made of reeds covered with painted plaster. The facade of the single-nave church is relatively intact, and recalls the classical Greek temple structure. The lesenes support the very elaborate trabeation and triangular tympanum. Three transverse round arches have also remained intact. No records of the wall paintings have been found in the archives. We can thus only assume that the first cycle of paintings dates back to the construction of the building in the 16th century.
The church has almost completely lost the internal wall paintings (Figure 1). The decay originated from the partial settlement of the ground, around the middle of the last century, and more recently from a bolt of lightning that hit the stone bell tower causing a fire that almost completely destroyed the roof.
The present work reports the analytical campaign conducted on fragments from the few wall paintings still in place. The samples were analyzed with optical microscopy and scanning electron microscopy equipped with an energy-dispersive spectrometer, also on polished cross sections, and with X-ray diffraction and infrared spectroscopy on powders. The analyses obtained important information on the pictorial materials, pigments and binders used for the decoration of the walls. Traditional and unusual pigments were revealed together with the widespread use of aragonite probably from shells utilized as a building material.
2. Research
| Sample | Images | Colors | Identified Pigments | Analytical Techniques |
|---|---|---|---|---|
| ST1 |  |
aqua green | blanc fixe (BaSO4), clinochlore (Mg4Fe2Al(Si3Al) O10(OH)8), ultramarine blue (Na8Al6Si6O24S4) | OM, FTIR-ATR, XRD, SEM-EDX |
| ST2 |  |
aqua green | blanc fixe (BaSO4), ultramarine blue (Na8Al6Si6O24S4) | FTIR-ATR, XRD, SEM-EDX, PCS |
| blue | ultramarine blue (Na8Al6Si6O24S4) | |||
| red | red ochre (Fe2O3, clay) | |||
| white | blanc fixe (BaSO4) | |||
| white | bianco di Sangiovanni (CaCO3) | |||
| yellow | yellow ochre (FeOOH, clay) | |||
| ST3 |  |
aqua green | ultramarine blue (Na8Al6Si6O24S4), ultramarine yellow (BaCrO4) | FTIR-ATR, SEM-EDX, PCS |
| blue | ultramarine blue (Na8Al6Si6O24S4) | |||
| white | bianco di Sangiovanni (CaCO3) | |||
| yellow | yellow ochre (FeOOH, clay) | |||
| ST4 | 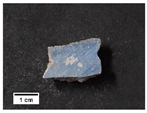 |
blue | ultramarine blue (Na8Al6Si6O24S4) | FTIR-ATR, XRD, SEM-EDX |
| ST5 | 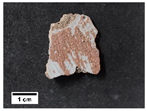 |
blue | ultramarine blue (Na8Al6Si6O24S4) | OM, FTIR-ATR, XRD, SEM-EDX, PCS |
| red | red ochre (Fe2O3, clay) | |||
| white | bianco di Sangiovanni (CaCO3) | |||
| ST6 | 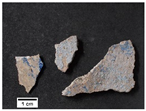 |
blue | ultramarine blue (Na8Al6Si6O24S4) | FTIR-ATR, XRD, SEM-EDX |
| red | red ochre (Fe2O3, clay) | |||
| yellow | cinnabar/vermilion (HgS), yellow ochre (FeOOH, clay) | |||
| ST7 | 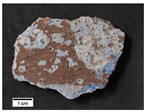 |
black | red ochre (Fe2O3, clay) | OM, FTIR-ATR, SEM-EDX |
| blue | blanc fixe (BaSO4), ultramarine blue (Na8Al6Si6O24S4) | |||
| light blue | blanc fixe (BaSO4), ultramarine blue (Na8Al6Si6O24S4), white lead (2PbCO3 Pb(OH)2) | |||
| grey | manganese black (MnO2), yellow ochre (FeOOH, clay) | |||
| dark ochre | manganese black (MnO2), yellow ochre (FeOOH, clay) | |||
| yellow | yellow ochre (FeOOH, clay) | |||
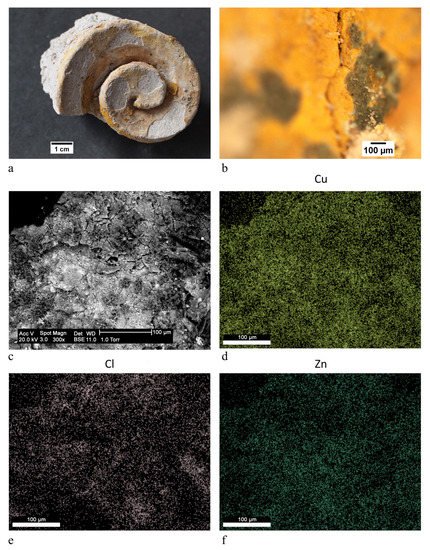
| ST8 | 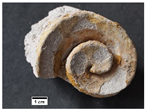 |
green | Brunswick green ((Cu,Zn)2(OH)3Cl) | OM, FTIR-ATR, XRD, SEM-EDX |
| orange | yellow ochre (FeOOH, clay) | |||
| yellow | chrome yellow (PbCrO4) | |||
| ST9 | 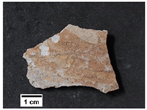 |
ochre | yellow ochre (FeOOH, clay) | FTIR-ATR, SEM-EDX |
| ST10 | 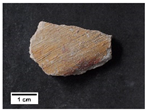 |
red | red ochre (Fe2O3, clay) | OM, FTIR-ATR, SEM-EDX |
| yellow | yellow ochre (FeOOH, clay) | |||
| ST11 | 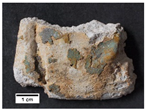 |
green | Brunswick green ((Cu,Zn)2(OH)3Cl) | OM, FTIR-ATR, XRD, SEM-EDX |
| yellow | chrome yellow (PbCrO4), yellow ochre (FeOOH, clay) | |||
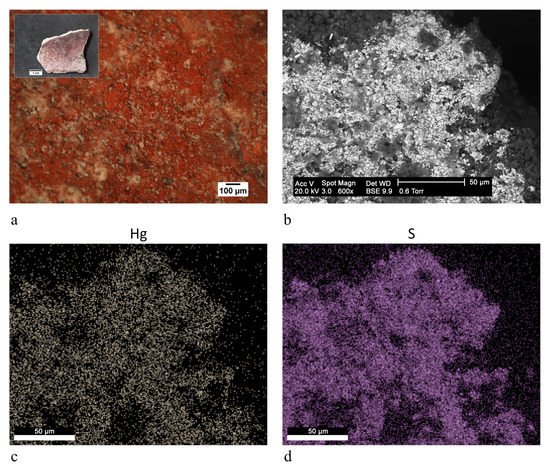
| ST12 |  |
red | cinnabar/vermilion (HgS) | FTIR-ATR, SEM-EDX |
| yellow | chrome yellow (PbCrO4), yellow ochre (FeOOH, clay) | |||
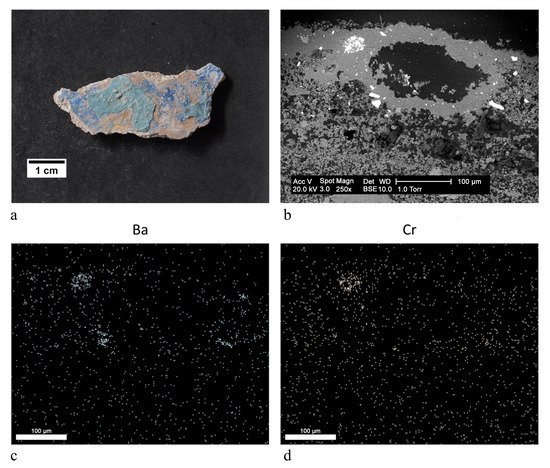
| ST13 |  |
red | cinnabar/vermilion (HgS), yellow ochre (FeOOH, clay) | FTIR-ATR, SEM-EDX |
| yellow | chrome yellow (PbCrO4), ultramarine yellow (BaCrO4) | |||
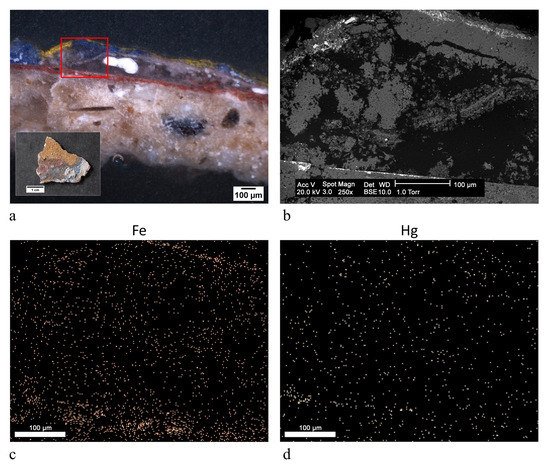
| ST14 |  |
blue | ultramarine blue (Na8Al6Si6O24S4) | FTIR-ATR, SEM-EDX, PCS |
| red | cinnabar/vermilion (HgS), red ochre (Fe2O3, clay) | |||
| white | bianco di Sangiovanni (CaCO3) | |||
| yellow | chrome yellow (PbCrO4), yellow ochre (FeOOH, clay) | |||
| ST15 |  |
red | cinnabar/vermilion (HgS), red ochre (Fe2O3, clay) | OM, FTIR-ATR, SEM-EDX |
| light red | blanc fixe (BaSO4), red ochre (Fe2O3, clay) | |||
| white | bianco di Sangiovanni (CaCO3) | |||
| yellow | chrome yellow (PbCrO4), yellow ochre (FeOOH, clay) | |||
| ST16 | 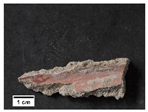 |
light blue | ultramarine blue (Na8Al6Si6O24S4) | OM, FTIR-ATR, SEM-EDX |
| red | cinnabar/vermilion (HgS), red ochre (Fe2O3, clay) | |||
| light red | red ochre (Fe2O3, clay) | |||
| yellow | chrome yellow (PbCrO4) | |||
| ST17 | 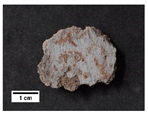 |
blue | ultramarine blue (Na8Al6Si6O24S4) | OM, FTIR-ATR, SEM-EDX, PCS |
| dark red | red ochre (Fe2O3, clay) | |||
| light red | red ochre (Fe2O3, clay) | |||
| white | bianco di Sangiovanni (CaCO3) | |||
| ST18 | 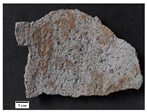 |
blue | ultramarine blue (Na8Al6Si6O24S4) | OM, FTIR-ATR, XRD, SEM-EDX, PCS |
| light blue | ultramarine blue (Na8Al6Si6O24S4) | |||
| red | red ochre (Fe2O3, clay) | |||
| yellow | yellow ochre (FeOOH, clay) | |||
| ST19 | 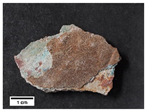 |
blue | ultramarine blue (Na8Al6Si6O24S4) | OM, FTIR-ATR, SEM-EDX, PCS |
| light blue | azurite (2CuCO3 Cu(OH)2 | |||
| dark ochre | yellow ochre (FeOOH, clay) | |||
| red | red ochre (Fe2O3, clay) | |||
| ST20 | 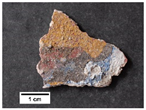 |
blue | ultramarine blue (Na8Al6Si6O24S4) | OM, FTIR-ATR, SEM-EDX, PCS |
| red | cinnabar/vermilion (HgS), red ochre (Fe2O3, clay) | |||
| white | bianco di Sangiovanni (CaCO3) | |||
| yellow | chrome yellow (PbCrO4), yellow ochre (FeOOH, clay) | |||
| ST21 | 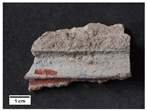 |
light blue | ultramarine blue (Na8Al6Si6O24S4) | OM, FTIR-ATR, SEM-EDX |
| red | red ochre (Fe2O3, clay) | |||
| white | bianco di Sangiovanni (CaCO3) | |||
| yellow | yellow ochre (FeOOH, clay) | |||
| ST22 | 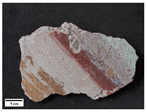 |
light blue | ultramarine blue (Na8Al6Si6O24S4) | OM, FTIR-ATR, SEM-EDX |
| red | red ochre (Fe2O3, clay) | |||
| yellow | yellow ochre (FeOOH, clay) | |||
| ST23 | 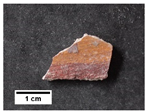 |
red | yellow ochre (FeOOH, clay) | OM, FTIR-ATR, SEM-EDX |
| yellow | red ochre (Fe2O3, clay) |
3. Discussion
This entry is adapted from the peer-reviewed paper 10.3390/heritage4030137
References
- Wilson, M.J. Clay Mineralogy: Spectroscopic and Chemical Determinative Methods; Chapman & Hall: London, UK, 1994; ISBN 9780412533808.
- Bikiaris, D.; Daniilia, S.; Sotiropoulou, S.; Katsimbiri, O.; Pavlidou, E.; Moutsatsou, A.P.; Chryssoulakis, Y. Ochre-differentiation through micro-Raman and micro-FTIR spectroscopies: Application on wall paintings at Meteora and Mount Athos, Greece. Spectrochim. Acta Part A Mol. Biomol. Spectrosc. 2000, 56, 3–18.
- Bugini, R.; Corti, C.; Folli, L.; Rampazzi, L. Unveiling the Use of Creta in Roman Plasters: Analysis of Clay Wall Paintings from Brixia (Italy). Archaeometry 2017, 59, 84–95.
- Crupi, V.; La Russa, M.F.; Venuti, V.; Ruffolo, S.; Ricca, M.; Paladini, G.; Albini, R.; Macchia, A.; Denaro, L.; Birarda, G.; et al. A combined SR-based Raman and InfraRed investigation of pigmenting matter used in wall paintings: The San Gennaro and San Gaudioso Catacombs (Naples, Italy) case. Eur. Phys. J. Plus 2018, 133, 369.
- Eastaugh, N.; Walsh, V.; Chaplin, T.; Siddall, R. Pigment Compendium: A Dictionary and Optical Microscopy of Historical Pigments; Pigment Compendium: A Dictionary and Optical Microscopy of Historical Pigments; Butterworth-Heinemann: Oxford, UK, 2008; ISBN 9780750689809.
- Derrick, M.R.; Stulik, D.; Landry, J.M. Infrared Spectroscopy in Conservation Science; The Getty Conservation Institute: Los Angeles, CA, USA, 1999; ISBN 0892364696.
- Bugini, R.; Corti, C.; Folli, L.; Rampazzi, L. Roman Wall Paintings: Characterisation of Plaster Coats Made of Clay Mud. Heritage 2021, 4, 48.
- Montoya, C.; Lanas, J.; Arandigoyen, M.; Navarro, I.; García Casado, P.J.; Alvarez, J.I. Study of ancient dolomitic mortars of the church of Santa Maria de Zamarce in Navarra (Spain): Comparison with simulated standards. Thermochim. Acta 2003, 398, 107–122.
- Igea, J.; Lapuente, P.; Martínez-Ramírez, S.; Blanco-Varela, M.T. Characterization of mudejar mortars from St. Gil Abbot church (Zaragoza, Spain): Investigation of the manufacturing technology of ancient gypsum mortars. Mater. Constr. 2012, 62, 515–529.
- Biscontin, G.; Pellizon Birelli, M.; Zendri, E. Characterization of binders employed in the manufacture of Venetian historical mortars. J. Cult. Herit. 2002, 3, 31–37.
- Crupi, V.; D’Amico, S.; Denaro, L.; Donato, P.; Majolino, D.; Paladini, G.; Persico, R.; Saccone, M.; Sansotta, C.; Spagnolo, G.V.; et al. Mobile Spectroscopy in Archaeometry: Some Case Study. J. Spectrosc. 2018, 2018, 1–11.
- Zhang, K.; Grimoldi, A.; Rampazzi, L.; Sansonetti, A.; Corti, C. Contribution of thermal analysis in the characterization of lime-based mortars with oxblood addition. Thermochim. Acta 2019, 678, 178303.
- Zhang, K.; Corti, C.; Grimoldi, A.; Rampazzi, L.; Sansonetti, A. Application of Different Fourier Transform Infrared (FT-IR) Methods in the Characterization of Lime-Based Mortars with Oxblood. Appl. Spectrosc. 2019, 73, 479–491.
- Žigovečki Gobac, Ž.; Posilović, H.; Bermanec, V. Identification of biogenetic calcite and aragonite using SEM. Geol. Croat. 2009, 62, 201–206.
- Roy, A. Artists’ Pigments: A Handbook of Their History and Characteristics; Oxford University Press: London, UK, 1993; Volume 2, ISBN 9780894681899.
- Aroke, U.O.; Abdulkarim, A.; Ogubunka, R.O. Fourier-transform Infrared Characterization of Kaolin, Granite, Bentonite and Barite. ATBU J. Environ. Technol. 2013, 6, 42–53.
- Ranalli, G.; Bosch-Roig, P.; Crudele, S.; Rampazzi, L.; Corti, C.; Zanardini, E. Dry biocleaning of artwork: An innovative methodology for Cultural Heritage recovery? Microb. Cell 2021, 8, 91–105.