Your browser does not fully support modern features. Please upgrade for a smoother experience.
Please note this is an old version of this entry, which may differ significantly from the current revision.
Subjects:
Engineering, Manufacturing
Strain rate is a parameter related with dynamic loading phenomena, which are common in industrial applications.
- strain rate sensitivity
- tensile properties
- polycarbonate (PC)
- thermoplastic polyurethane (TPU)
1. Introduction
Strain rate is a parameter related with dynamic loading phenomena, which are common in industrial applications [31,32]. Strain rate sensitivity is a measure that has been widely studied for polymers processed through many manufacturing technologies [33]. On the other hand, not enough research exists in the literature regarding the strain rate sensitivity of polymers processed through AM technologies and especially the FFF technology [33,34]. Strain rate sensitivity is an important parameter for end-use applications when polymers are FFF processed. Studying the behavior change due to the strain rate could provide information for fail-safe mechanisms and other dynamic analysis properties [35], such as the energy absorbed in crashes etc. [36].
A recent study provided critical information for the strain rate sensitivity of several different polymers processed with the FFF technology [33]. The increasing demand for FFF manufactured parts with engineering grade polymers such as polycarbonate (PC) and thermoplastic polyurethane (TPU) has further increased the necessity for a study on the strain rate sensitivity of these polymers, which has not been reported before in literature. PC is a well-known high mechanical performance polymer [37], widely used in many applications which require strong dynamical properties, such as automotive [38], medical [39,40,41,42] and optics [43] applications. In AM, PC applications are still limited in the literature, with research mainly related to acoustic applications [44] and heat pipes [45]. TPU is also an elastic material, employed in many industrial and other environmental parts [46,47]. Indicative applications of TPU material are in mechanical seals [48,49] or more advanced applications, such as flexible electronics [50], force sensors [51], pneumatic actuators [52] and pharmaceutical applications [53]. TPU thermal properties in 3D printing have also been reported [54,55].
The strain rate of these materials has been studied either for homopolymers or for composites [38,56,57], but not for parts built with AM technology. The manufacturing of parts through FFF technology requires the extrusion of melted-state polymer in shells, infills and, of course, in consecutive layers [10]. The interlayer and throughout layer fusion are prone to a wide range of process settings, such as number of shells, layer height, infill percentage, infill geometry pattern, extrusion temperature, extrusion speed etc. [58,59]. As mentioned above, AM built parts have an anisotropic behavior. These parameters are among others, responsible for the anisotropic behavior of the parts manufactured with the FFF process [19]. This anisotropy can create unpredicted behavior, especially when dynamic stresses are applied to AM processed parts.
2. Tensile Properties
Figure 3 shows representative graphs from the tensile tests conducted during the present study. Specifically, in Figure 3a, typical stress (MPa) to strain (mm/mm) curves are shown for PC material for the 10 mm/min strain rate. The layer thickness of the specimens, in this case, was 0.2 mm and curves shown are for the three different 3D printing temperatures studied in this work (one graph per temperature). Through this comparison, it can be observed that increasing the 3D printing temperature to 270 °C improved the mechanical performance of the material, probably due to increased inter and intra layer fusion. In Figure 3b, PC stress (MPa) to strain (mm/mm) typical curves for the different layer thicknesses studied are shown for the elongation speed of 10 mm/min and 3D printing temperature of 260 °C. The figure shows that varying the layer height had little effect on the strength of the specimen, as the difference was less than 10%. This difference could be plausibly attributed to the anisotropy of the process followed (AM). Figure 3c shows the effect of the strain rate on the PC polymer, at three different elongation speeds (10 mm/min, 100 mm/min and 300 mm/min), for specimens built with a 0.20 mm layer thickness at 260 °C. As it is shown, the strain rate had an effect on the typical stress to strain curve of the PC polymer, although the maximum strength developed on the specimens was similar in the three cases shown.
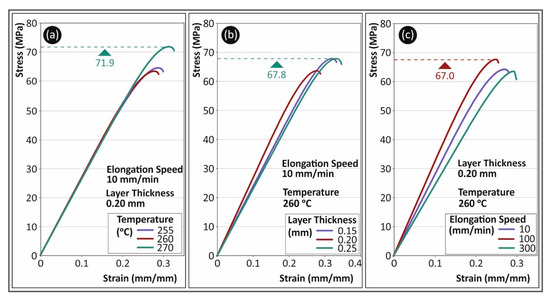
Figure 3. Stress (MPa) to strain (mm/mm) typical curves for PC material for (a) different 3D printing temperatures, (b) different layer thicknesses and (c) different elongation speeds.
In Figure 4, the corresponding results are shown for the TPU polymer. In Figure 4a, a strong effect of temperature on the behavior of the materials is observed. Results shown could lead to the selection of the optimum 3D printing temperature among the three temperatures studied in this work. The temperature increase had an opposite effect on the TPU polymer, when compared to the PC polymer. When the temperature increased from 215 °C to 225 °C, a decrease of approximately 40% in the tensile strength was observed. It should be mentioned that these sharp drops shown by the stress graphs are caused by local breaks on the specimen, which occurred, during the test, either in its shell or in the infill structure. At higher 3D printing temperatures, TPU material developed smoother curves during the tensile tests. This could be probably attributed to a more isotropic behavior in this case. A better inter and intra layer bonding was possibly achieved, which had a clear effect on the properties of the material, as the specimen became stiffer.
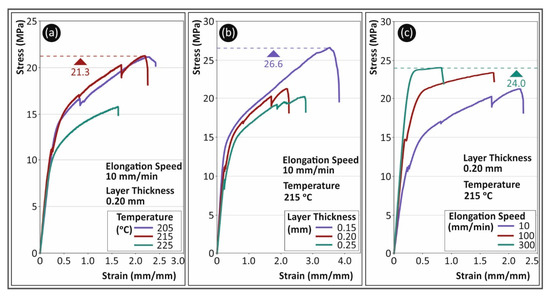
Figure 4. Stress (MPa) to strain (mm/mm) typical curves for TPU material for (a) different 3D printing temperatures, (b) different layer thicknesses and (c) different elongation speeds.
The effect of layer height on the tensile stress behavior is shown in Figure 4b. In this figure, typical stress (MPa) to strain (mm/mm) curves of the TPU specimens tested at 10 mm/min strain rate, with a 215 °C nozzle temperature are shown for the three different layer heights studied. Layer height exhibited a strong effect on the deformation (especially in the non-elastic area) and the tensile strength of TPU material, with lower layer heights developing higher tensile strength and deformation values. The 0.15 mm layer height developed approximately 30% higher tensile strength and almost 25% higher strain values than the 0.20 mm layer height. Figure 4c shows indicative graphs for the TPU specimens from tensile tests with three different strain rate values. Specimens in these three cases were 3D printed with a 0.2 mm layer thickness at a temperature of 215 °C. The strain rate had a strong effect on the brittleness of the material. The increase in the strain rate significantly increased the stiffness of TPU material. The tensile strength, on the other hand, was not affected in the same way, as the difference among the developed values for the three different strain rates was not higher than 10%.
Figure 5 shows a comparison between the parameters studied in this work. Specifically, Figure 5a shows, for PC material, the average tensile strength values and their deviation for the different strain rates and 3D printing temperatures studied in this work, for a 0.2 mm layer height. The nozzle temperature created a different trend regarding the tensile strength for the various strain rate values. This was probably due to the different inter and intra layer fusion of the material caused by the different 3D printing nozzle temperatures. The lower sensitivity of the strain rate to the tensile strength was observed for the highest nozzle temperature studied in this work. A similar trend was observed in PC material regarding the sensitivity of the material and the strain rate, when altering the layer height. In Figure 5b, it is shown that the tensile strength for the lowest layer height had a more consistent behavior at the different elongation speeds, when compared to the calculated tensile strengths for higher layer thicknesses. The calculated tensile modulus of elasticity (MPa) is shown in Figure 5c for the different 3D printing temperatures studied and, in Figure 5d, the corresponding values are presented for the different layer heights, for the five elongation speeds tested herein. It can be further assumed that 3D printing temperature constitutes an important parameter affecting the tensile properties of the material.
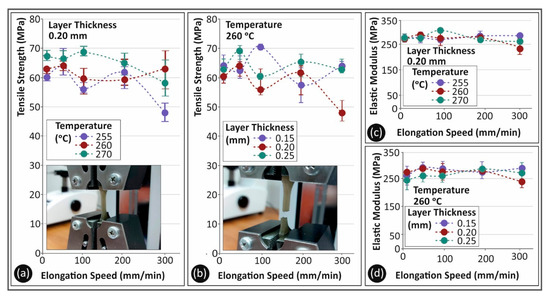
Figure 5. (a,b) Average tensile strength (MPa) and (c,d) average tensile elastic modulus (MPa) to elongation speeds (mm/min) for PC material as follows: (a,c) 3D printing temperatures; (b,d) layer heights.
This entry is adapted from the peer-reviewed paper 10.3390/polym13162752
This entry is offline, you can click here to edit this entry!