Lately, polyethylene glycol with nanoparticles has been demarcated as an innovative class of phase change materials with conceivable uses in the area of convective heat transfer. The amplified thermal conductivity of these nanoparticle enhanced phase change materials (PCMs) over the basic fluids (e.g., polyethylene glycol—PEG) is considered one of the driving factors for their improved performance in heat transfer.
- PEG
- nanoparticles
- convective heat transfer
Note:All the information in this draft can be edited by authors. And the entry will be online only after authors edit and submit it.
1. Introduction
Phase change materials (PCMs) have formed one of the most popular topics in research for the last 25 years. Despite the large body of existing research on phase change material properties and applications and the several published review papers, it is worth outlining the polyethylene glycol (PEG) family as one of the challenging classes of phase change materials with direct application in heat transfer enhancement.
One of the first comprehensive reviews on thermal storage systems and PCMs was accomplished by Zalba et al. [1] in 2003. The authors listed more than 150 materials used in research as PCMs, extracted from 230 references. This outstanding contribution is presented under three sections: materials, heat transfer, and applications. PCM applications can be classified as ice storage, building applications, conservation and transportation of temperature sensitive materials, water tanks vs. PCM tanks, and many others.
Sharma et al. [2] also conducted a review on thermal energy storage (TES) systems with phase change materials and their applications. The authors discussed energy storage methods, outlining mechanical, electrical, thermal, and thermochemical energy storage applications. They also discussed the sufficient properties needed for a specific PCM to be used in the design of a TES system and concluded that a good phase change material should have good thermophysical, kinetic, and chemical properties, as follows [2]:
- Thermal properties: good phase transition temperature, good heat transfer capabilities (i.e., especially high thermal conductivity, high specific heat capacity), and a high latent heat;
- Physical properties: good phase equilibrium, high values for density, and small vapor pressure;
- Kinetic properties: no conditions for supercooling and a good crystallization rate;
- Chemical properties: a very good chemical stability over time, lack of toxicity and absence of fire hazard (i.e., lack of flammability), a very good compatibility with other materials from the same system (for example, the construction materials, if applicable to buildings), lack of or low degradation after a number of freezing or melting processes;
- Preferable economic indicators, such as abundancy, large scale availability, and low costs.
The classification of PCMs is illustrated in Figure 1. A complete list of all PCMs by category can be found in both Zalba et al. [1] and Sharma et al. [2].
The advantages and drawbacks of classes of PCMs are depicted in Figure 2.
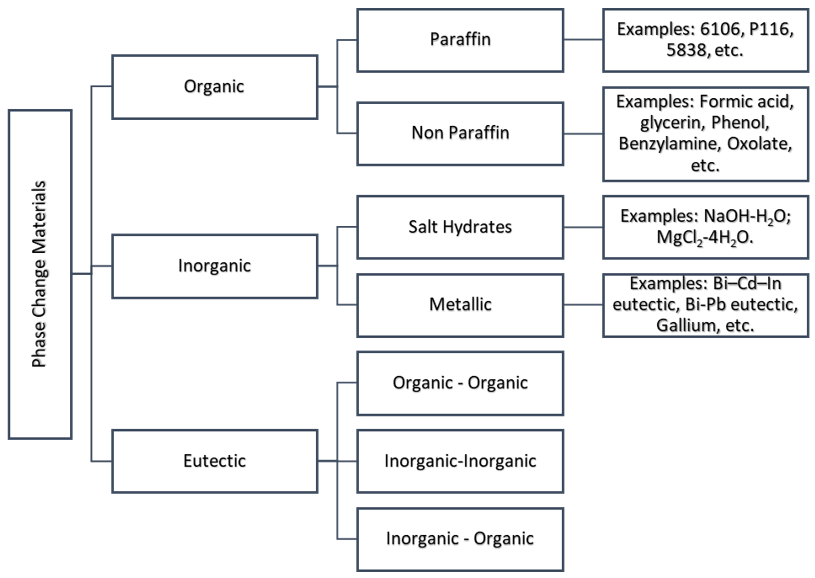
Figure 1. Phase change material (PCM) classification with several examples.
2. Polyethylene Glycol as a Phase Change Material
Polyethylene glycol (PEG), alongside paraffin and fatty acid, is an organic PCM, and it has a congruent phase change with a good nucleation rate (see Cabeza [7] for more details). Chemically, PEG is a polyether compound with countless uses, from industrial manufacturing to medicine. The structure of PEG is commonly expressed as H–(O–CH2–CH2)n–OH, and its application areas are outlined as follows:
- Chemical applications (as a lubricator, in biochemistry or biomembrane experimental studies, as a surfactant, as a calibration compound in mass spectrometry, etc.);
- Medicine (use as an excipient, for example);
- Biology (as a crowding agent, for protein crystallization)
- Commercial uses (in tattoos for monitoring diabetes, as an anti-foaming agent in several food and drink products, as a compound in skin creams, as a dispersant for toothpaste, etc.)
- Industrial applications (as an anti-foaming agent, in technical ceramics, as an insulator, etc.);
- Recreational applications.
The name PEG is usually followed by a number that signifies the average molecular weight of the compound. Table 1 depicts some basic data on studied forms of PEG, while Table 2 shows a summary of their thermophysical properties at ambient temperature (i.e., 25 °C) unless otherwise specified (see the viscosity values column).
Table 1. Polyethylene glycol (PEG) type PCMs used for cool energy storage applications.
|
|
Average Molecular Weight |
Melting Point/Range, °C |
Heat of Fusion, kJ/Kg |
References |
|
PEG 200 |
200 |
−50 |
not available |
Gomez-Merino et al. [8] |
|
PEG 400 |
400 |
5.8 |
105.3 |
Marcos et al. [9] |
|
PEG 600 |
600 |
22.2 |
127.2 |
Demirbas [10] Ahmad et al. [11] |
|
PEG 1000 |
1000 |
35–40 |
159 |
Azizi and Sadrameli [12] |
|
PEG 1000 + PEG 600 |
|
23–26 |
150.5 |
Ismail and Castro [13] |
|
PEG 2000 |
2000 |
35.93 |
172.13 |
Zhang et al. [14] |
|
PEG 6000 |
6000 |
39.6 |
177.9 |
Tang et al. [15] |
|
PEG 1500 |
1500 |
47.23 |
161.43 |
Kou et al. [16] |
|
PEG 4000 |
4000 |
55.95 |
173.62 |
Kou et al. [16] |
|
PEG 8000 |
8000 |
59.74 |
177.53 |
Kou et al. [16] |
|
PEG 10000 |
10000 |
58.01 |
182.86 |
Kou et al. [16] |
|
PEG 12000 |
12000 |
60.93 |
173.4 |
Kou et al. [16] |
|
PEG 20000 |
20000 |
62.27 |
168.5 |
Kou et al. [16] |
Table 2. Thermophysical properties of several forms of PEG, as identified in the literature.
|
|
Thermal Conductivity, W/m K (at 298.15 K) |
Viscosity, mPa s (at Different Temperatures) |
Specific Heat Capacity (at 298.15 K) |
Density, kg/m3 (at 298.15 K) |
References |
|
PEG 200 |
0.190 |
49.72 at 298.15 K |
not available |
1120.9 |
Gomez-Merino et al. [8] |
|
PEG 400 |
0.152 |
70.44 at 298.15 K |
not available |
1003.8 |
Gomez-Merino et al. [8] |
|
0.184 |
73.4 at 303.15 K |
2.350 kJ/kg K |
1125.3 |
Marcos et al. [9] |
|
|
PEG 600 |
not available |
150 at 298.15 K |
2.490 kJ/kg K |
1128 |
Ahmad et al. [11] |
|
PEG 1000 |
0.23 |
not available |
2.142 kJ/kg K |
1093 |
Azizi and Sadrameli [12] |
|
PEG 1500 |
0.31 |
not available |
2.473 kJ/kg K |
1200 |
Kou et al. [16] |
|
PEG 2000 |
0.31 |
not available |
3.116 kJ/mol K |
1210 |
|
|
PEG 4000 |
0.33 |
not available |
5.996 kJ/mol K |
1200 |
|
|
PEG 6000 |
0.2124 (0.34) |
not available |
not available (8.996 kJ/mol K) |
1200 |
Tang et al. [15] (Kou et al. [16]) |
|
PEG 8000 |
0.33 |
not available |
11.772 kJ/mol K |
1270 |
Kou et al. [16] |
|
PEG 10000 |
0.33 |
not available |
14.455 kJ/mol K |
1070 |
Kou et al. [16] |
|
PEG 12000 |
0.32 |
not available |
17.550 kJ/mol K |
1200 |
Kou et al. [16] |
|
PEG 20000 |
0.32 |
not available |
28.180 kJ/mol K |
1200 |
Kou et al. [16] |
3. Nanoparticle Enhanced PEG for Convective Heat Transfer Applications
PEG reveals high latent heat storage capacities at melting temperatures that can be adjusted by fluctuating the molecular mass of the polymer, as outlined in Table 1. In order to improve the thermal conductivity and the heat transfer behavior, nanoparticles are added to PEG, as in nanofluid or nanocomposite manufacturing.
This paper is dedicated to outlining and briefly discussing the thermophysical properties of state-of-the-art PEG-based heat transfer fluids obtained by suspending different kinds of nanoparticles in liquid polyethylene glycol. The suspension manufacturing follows the regular procedures applied to nanofluids, which include the mixing of the liquid with the nanoparticles, according to calculated quantities, depending on the final mass or volume fraction of nanoparticles in the fluid, and applying several sonication treatments (see [8] for example).
This section outlines the outcomes of studies on nanoparticle enhanced PEG in terms of its relevance as a new heat transfer fluid. In short, a new nanoparticle enhanced heat transfer fluid has to comply with several guidelines, such as high thermal conductivity and a moderate increase in viscosity. The discussion starts with thermal conductivity, which is by far the most examined thermophysical property. This section also contains an outline of density, viscosity, and specific heat capacity experimental results.
3.1. Thermal Conductivity
As stated, thermal conductivity of nanoparticle enhanced PEG is the most studied property, and a summary of experimental results identified from the open literature is presented in Table 3 [9,15,17–24].
As seen in Table 3, all the studies revealed an augmentation of thermal conductivity when nanoparticles were added to the base fluids. In terms of thermal conductivity variation with temperature, one can easily notice that most of the researchers found a decrease (see for example [9,17]), while some found that temperature has no major influence on experimental values (see for example [18,22]).
Marcos et al. [17] studied MWCNTs (Multi Wall Carbon Nanotubes) suspended in PEG 400 and compared the experimental data with several theoretical correlations. The researchers affirmed that all semi-empirical models underpredict the experimental values of thermal conductivity by at least 5.6%.
Since most of the studies do not compare the experimental thermal conductivity of nanoparticle enhanced PEG, this paper gives an overview of the nanoparticle or base fluid influence. Figure 3 shows the nanoparticle type influence on thermal conductivity of PEG 400.
In Figure 3 it can clearly be seen that the influence of nanoparticle type and concentration is not consistent, since for 0.1 wt. % the augmentation is maximum for MWCNT addition, while for 0.5 wt. % the maximum is attained for graphene (GnP).
Unfortunately, no valid explanation on NP type influence was found in the literature, and a further comparison is not possible due to data scattering, as can be seen from Table 3.
To conclude, most of the experimental studies on PEG do not go deeper into the phenomenon of increasing the thermal conductivity. Overall, the thermal conductivity enhancement was found to be due to addition of highly conductive nanoparticles into the base fluids. Due to the lack of insight into experimental outcomes from different researchers, this author believes that the thermal conductivity augmentation mechanisms are similar to the ones noticed for other nanofluids. More exactly, these mechanisms are summarized in the open literature as: Brownian motion, surface charge, liquid–solid interface layer, and nanoparticle clustering. On the other hand, some influences have to be carefully studied, for example nanoparticle driven convection and convection prompted by electrophoresis or thermophoresis. Nevertheless, intense experimental studies on thermal conductivity are needed to completely reveal the processes that appear in these new nanoparticle enhanced fluids.
3.2. Density
Density experimental results are depicted in Table 4, and it can be noticed that very few studies have been conducted. Nevertheless, an initial conclusion is clear, pointing to two major conclusions:
- Density decreases when temperature increases.
- Density of the nanoparticle enhanced PEG slightly increases with nanoparticle concentration.
Table 3. Results for thermal conductivity.
|
Reference |
Base Fluid |
Nanoparticles |
Concentration |
Conditions |
Observation |
|
Marcos et al. [17] |
PEG 400 |
MWCNT |
0.01–1 wt. % |
Temperature variation in the range 288.15–343.15 K |
1. Thermal conductivity slightly decreases when temperature increases. 2. Thermal conductivity of the liquid inceases with nanoparticle concentration. |
|
Marcos et al. [9] |
PEG 400 |
GnP |
0.05–0.5 wt. % |
Temperature variation in the range 283–333 K |
1. Thermal conductivity slightly decreases when temperature increases. 2. Thermal conductivity of the liquid inceases up to 23% with nanoparticle concentration. |
|
Marcos et al. [18] |
PEG 400 |
Ag |
0.1–1.1 wt. % |
Temperature variation in the range 283.15–333.15 K |
1. Thermal conductivity remains almost constant when temperature increases. 2. Thermal conductivity of the liquid inceases with nanoparticle concentration. |
|
Singh et al. [19] |
PEG 1000 |
carbon powder |
0.78 and 2.5 wt. % |
Ambient temperature |
Thermal conductivity of the liquid inceases up to 31% with nanoparticle concentration. |
|
Yang et al. [20] |
PEG 1000 |
GnP |
up to 2.5 wt. % |
Ambient temperature |
Thermal conductivity of the liquid inceases up to 36% with nanoparticle concentration. |
|
Liu et al. [21] |
PEG 6000 + SiO2 |
carbon fiber |
1–5 wt. % |
Ambient temperature |
Thermal conductivity inceases by 73% if compared to the base fluid and by 164% if compared to PEG 6000. |
|
Qian et al. [22] |
PEG 6000 |
SWCNT |
2–10 wt. % |
Temperature variation in the range 293.15–353.15 K |
1. Thermal conductivity remains almost constant when temperature increases. 2. Thermal conductivity of the liquid inceases by 8.55 times at 10% nanoparticle concentration. |
|
Tang et al. [15] |
PEG 6000 + SiO2 |
Al2O3 |
3.3, 9.2, 12.6 wt. % |
Ambient temperature |
Compared to the pure PEG 6000 and PEG 6000/SiO2 data, the thermal conductivity of the composite PCM with Al2O3 inceases up to 46.5% and 20.8%, respectively. |
|
Tang et al. [23] |
PEG 6000 + SiO2 |
MWCNT |
1–4 wt. % |
Ambient temperature |
Compared to the pure PEG 6000 and PEG 6000/SiO2 data, the thermal conductivity of the composite PCM with MWCNTs inceases up to 56% and 29%, respectively. |
|
Cabaleiro et al. [24] |
PEG 400 |
carbon black nano-diamonds graphite/diamond nanomixture |
0.5 and 1 wt. % |
Temperature variation in the range 288.15–318.15 K |
1. Thermal conductivity remains almost constant when temperature increases. 2. Thermal conductivity of the liquid inceases up to 3.6% depending on nanoparticle type and concentration. The largest increase was for graphite/diamond nanomixture. |
Table 4. Results for density.
|
Reference |
Base Fluid |
Nanoparticles |
Concentration |
Conditions |
Observation |
|
Marcos et al. [17] |
PEG 400 |
MWCNT |
0.01–1 wt. % |
Temperature variation in the range 288.15–313.15 K |
1. Density decreases when temperature increases 2. Density of the liquid increases up to 0.5% depending on nanoparticle concentration. |
|
Marcos et al. [9] |
PEG 400 |
GnP |
0.05–0.5 wt. % |
Temperature variation in the range 288.15–313.15 K |
1. Density decreases when temperature increases 2. Density of the liquid increases up to 1.5% depending on nanoparticle concentration. |
|
Marcos et al. [18] |
PEG 400 |
Ag |
0.1–1.1 wt. % |
Temperature variation in the range 288.15–313.15 K |
1. Density decreases when temperature increases 2. Density of the liquid increases up to 2.5% depending on nanoparticle concentration. |
|
Cabaleiro et al. [24] |
PEG 400 |
carbon black nano-diamonds graphite/diamond nanomixture |
0.5% and 1 wt. % |
Temperature variation in the range 288.15–313.15 K |
1. Density decreases when temperature increases 2. Density of the liquid increases up to 40% depending on nanoparticle concentration and type. |
|
Navidbakhsh and Majdan-Cegincara [25] |
PEG 400, PEG 400 + PEG 2000, PEG 400 + PEG 6000 |
Fe2O3 |
0.1–31.8 vol. % |
Temperature variation in the range 298.15–318.15 K |
1. Density decreases when temperature increases 2. Density of the liquid increases up to 1.5% depending on nanoparticle concentration. |
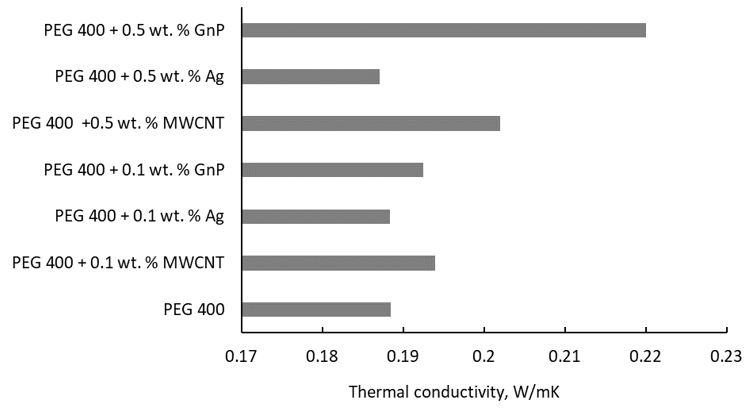
Figure 3. Thermal conductivity of several PEG-400-based fluids at 293 K [9,15,17].
3.3. Viscosity
Viscosity results are also very few and are scattered in the literature, and this is mainly because this parameter was not monitored for most of these nanoparticle enhanced PEG due to their final application in real life cases.
Some comprehensive studies on PEG-based fluids were conducted by Marcos et al. [9,17,18], and their conclusion was that the viscosity increases with nanoparticle addition and decreases with temperature. All the base fluids were found to be Newtonian as while adding nanoparticles the flow behavior changed. This phenomenon is also observed for nanofluids.
Marcos et al. [17] found a shear-thinning behavior that was more pronounced with the growing MWCNT concentration. Similarly, a shear-thinning non-Newtonian behavior was also noticed by Yapici et al. [26] in their study of 1–10 wt. % TiO2 nanofluids based on PEG 200. More details are given in Table 5.
Table 5. Results for viscosity.
|
Reference |
Base Fluid |
Nanoparticles |
Concentration |
Conditions |
Observation |
|
Marcos et al. [17] |
PEG 400 |
MWCNT |
0.01–1 wt. % |
Temperature variation in the range 288.15–343.15 K |
Viscosity increases with nanoparticle addition up to 30% and decreases with temperature. |
|
Marcos et al. [18] |
PEG 400 |
Ag |
0.1–1.1 wt. % |
Temperature variation in the range 273.15–343.15 K |
Viscosity increases with nanoparticle addition is very low. Viscosity decreases with temperature. |
|
Cabaleiro et al. [24] |
PEG 400 |
carbon black nano-diamonds graphite/diamond nanomixture |
0.5 and 1 wt. % |
Temperature variation in the range 288.15–318.15 K |
1. Viscosity decreases when temperature increases 2. Viscosity of the suspensions increases up to 31.8% depending on nanoparticle type and concentration. The largest increase was for carbon black at 1 wt. %, and the minimum was 5% for 0.5% nanodiamond. |
|
Yapici et al. [26] |
PEG 200 |
TiO2 |
1–10 wt. % |
Temperature variation in the range 263.15–313.15 K |
PEG 200 has a Newtonian behaviour, and all new fluids are non-Newtonian. Viscosity increases with nanoparticle addition. An increasing shear thinning trend with temperature was noticed. Viscosity decreases with temperature. |
|
Navidbakhsh and Majdan-Cegincara [25] |
PEG 400, PEG 400 + PEG 2000, PEG 400 + PEG 6000 |
Fe2O3 |
0.1–31.8 vol. % |
Temperature variation in the range 298.15–318.15 K |
Several models existing in the literature were checked for compliance with experimental data. Newtonian behavior was observed for PEG 400 and shear thickening for both PEG 400 + PEG 2000 and PEG 400 + PEG 6000. A pseudoplastic behavior was noticed for all fluids with nanoparticles. |
|
Marcos et al. [27] |
PEG 200 PEG 300 |
MWCNT |
0.025–0.7 wt. % |
Temperature variation in the range 278.15–303.15 K |
PEG 200 and PEG 300 have a Newtonian behaviour, and all new fluids are non-Newtonian. Viscosity increases with nanoparticle addition up to 105% and decreases with temperature. |
From the results depicted in Table 5 it can be seen that as the temperature increases, the viscosity decreases, and this is a normal phenomenon for most of the fluids. The phenomenon relies on the intermolecular attraction between the nanoparticles and their base fluids failing. Heating of most liquids leads to an increase of energy in the fluid. This intensification in energy increases the molecules’ random motion and fading of intermolecular forces holding the fluid molecules. This results in an decreased resistance of the fluid to shearing flow and thus a decrease in viscosity [28].
The comparison of literature data in Figure 4 shows that the addition of Ag nanoparticles produces a slight increase in the viscosity of PEG, while 1% MWCNTs highly upsurge the PEG 400 viscosity.
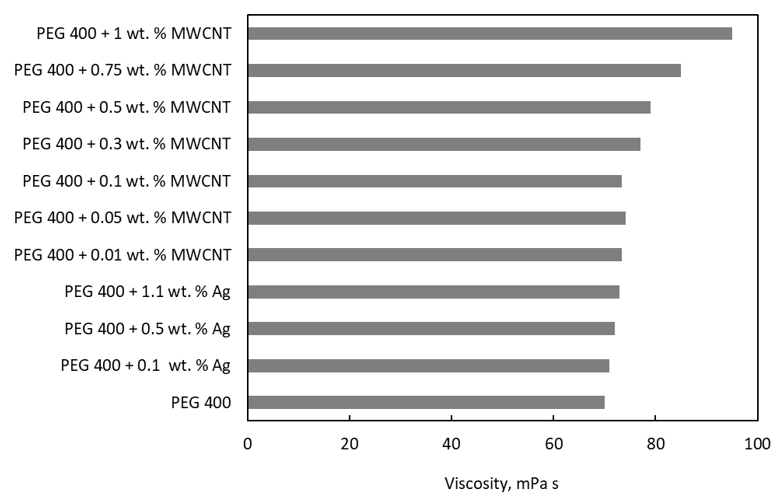
Figure 4. A comparison of viscosity values with PEG 400 as the base fluid.
Figure 5 depicts a comparison of experimental data on viscosity upsurge when MWCNT nanoparticles are added to three PEG base fluids (i.e., PEG 200, PEG 300, and PEG 400). Numbers show that if highly conductive nanoparticles are added to less viscous fluids (i.e., PEG 200 versus PEG 300 and PEG 400), the viscosity increase is higher, up to 110% for 0.5 wt. % MWCNTs in PEG 200.
To conclude, even various PEG base fluids were found to have a Newtonian flow behavior, nanoparticle addition modifies the flow into a non-Newtonian one, as all of available results demonstrated. Another observation is that adding nanoparticles increases the viscosity. This phenomenon is a normal one also encountered for regular nanofluids, and the explanation relies on the increase in shear rate particle–particle interactions that become weaker or are even broken down. Another explanation relies on the drag effect of individual nanoparticles (i.e., due to Brownian motion). Consequently, the global drag effect present in the medium is amplified, leading to an escalation in energy dissipation generating the augmentation in the nanofluid viscosity [28].
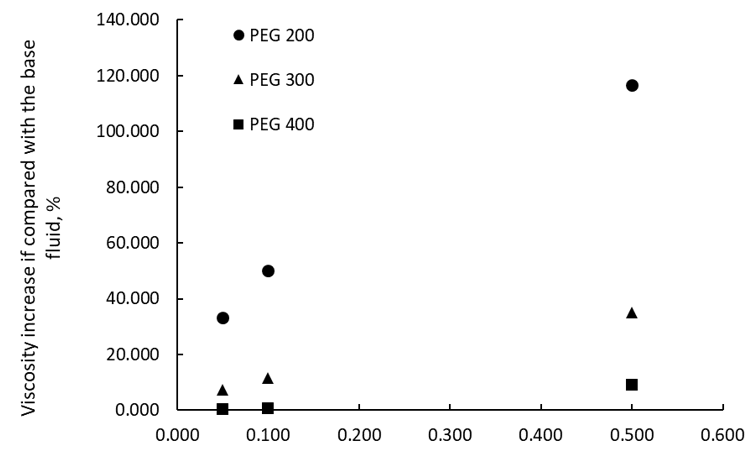
Figure 5. A comparison of adding MWCNTs to different PEG base fluids at 288.15 K.
3.4. Specific Heat Capacity
Results for specific heat capacity are rather limited in the open literature and are briefly discussed, since no valid conclusion can be formed. Results of Marcos et al. [9,18] show that the specific heat capacity increases when nanoparticles are added and also increases with temperature.
Marcos et al. [9] performed experiments in the range 283.15–333.15 K with Ag–PEG 400 and found that adding nanoparticles to the phase change material has very low influence on specific heat capacity values.
Marcos et al. [18] measured specific heat capacity in the range 293–473 K and found an increase of 0.02–0.34% in specific heat capacity depending on the temperature and GnP weight concentration in PEG 400 phase change material. The maximum value was attained for 0.5% GnP at 293 K and the minimum for 0.05 wt. % GnP at 473 K.
References
- Zalba, B.; Marın, J.M.; Cabeza, L.F.; Mehling, H. Review on thermal energy storage with phase change: Materials, heat transfer analysis and applications. Therm. Eng. 2003, 23, 251–283.
- Sharma, A.; Tyagi, V.V.; Chen, C.R.; Buddhi, D. Review on thermal energy storage with phase change materials and applications. Sustain. Energy Rev. 2009, 13, 318–345.
- Waqas, A.; Din, Z.U. Phase change material (PCM) storage for free cooling of buildings—A review. Sustain. Energy Rev. 2013, 18, 607–625.
- Zhou, D.; Zhao, C.Y.; Tian, Y. Review on thermal energy storage with phase change materials (PCMs) in building applications. Energy 2012, 92, 593–605.
- Osterman, E.; Tyagi, V.V.; Butala, V.; Rahim, N.A.; Stritih, U. Review of PCM based cooling technologies for buildings. Energy Build. 2012, 49, 37–49.
- Giro-Paloma, J.; Martínez, M.; Cabeza, L.F.; Fernández, A.I. Types, methods, techniques, and applications for microencapsulated phase change materials (MPCM): A review. Sustain. Energy Rev. 2016, 53, 1059–1075.
- Cabeza, L.F. Advances in Thermal Energy Storage Systems—Methods and Applications; Elsevier: Amsterdam, The Netherlands, 2014.
- Gómez-Merino, A.I.; Jiménez-Galea, J.J.; Rubio-Hernández, F.J.; Arjona-Escudero, J.L.; Santos-Ráez, I.M. Heat Transfer and Rheological Behavior of Fumed Silica Nanofluids. Processes 2020, 8, 1535.
- Marcos, M.A.; Cabaleiro, D.; Guimarey, M.J.G.; Comuñas, M.J.P.; Fedele, L.; Fernández, J.; Lugo, L. PEG 400-Based Phase Change Materials Nano-Enhanced with Functionalized Graphene Nanoplatelets. Nanomaterials 2018, 8, 16.
- Demirbas, M.F. Thermal energy storage and phase change materials: An overview. Energy Sources Part. B 2006, 1, 85–95.
- Ahmad, M.; Bontemps, A.; Sallée, H.; Quenard, D. Thermal testing and numerical simulation of a prototype cell using light wallboards coupling vacuum isolation panels and phase change material. Energy Build. 2006, 38, 673–681.
- Azizi, Y.; Sadrameli, S.M. Thermal management of a LiFePO4 battery pack at high temperature environment using a composite of phase change materials and aluminum wire mesh plates. Energy Convers. Manag. 2016, 128, 294– 302.
- Ismail, K.A.R.; Castro, J.N.C. PCM thermal insulation in buildings. J. Energy Res. 1997, 21, 1281–1296.
- Zhang, D.; Chen, M.; Wu, S.; Liu, Q.; Wan, J. Preparation of expanded graphite/polyethylene glycol composite phase change material for thermoregulation of asphalt binder. Build. Mater. 2018, 169, 513–521.
- Tang, B.; Wu, C.; Qiu, M.; Zhang, X.; Zhang, S. PEG/SiO2—Al2O3 hybrid form-stable phase change materials with enhanced thermal conductivity. Chem. Phys. 2014, 144, 162–167.
- Kou, Y.; Wang, S.; Luo, J.; Sun, K.; Zhang, J.; Tan, Z.; Shi, Q. Thermal analysis and heat capacity study of polyethylene glycol (PEG) phase change materials for thermal energy storage applications. Chem. Thermodyn. 2019, 128, 259–274.
- Marcos, M.A.; Podolsky, N.E.; Cabaleiro, D.; Lugo, L.; Zakharov, A.O.; Postnov, V.N.; Charykov, N.A.; Ageev, S.V.; Semenov, K.N. MWCNT in PEG-400 nanofluids for thermal applications: A chemical, physical and thermal approach. Mol. Liq. 2019, 294, 111616.
- Marcos, M.A.; Cabaleiro, D.; Hamze, S.; Fedele, L.; Bobbo, S.; Estellé, P.; Lugo, L. NePCM Based on Silver Dispersions in Poly(Ethylene Glycol) as a Stable Solution for Thermal Storage. Nanomaterials 2020, 10, 19.
- Singh, R.; Sadeghi, S.; Shabani, B. Thermal conductivity enhancement of phase change materials for low-temperature thermal energy storage applications. Energies 2019, 12, 75.
- Yang, J.; Tang, L.-S.; Bao, R.-Y.; Bai, L.; Liu, Z.-Y.; Yang, W.; Xie, B.-H.; Yang, M.-B. Largely enhanced thermal conductivity of poly (ethylene glycol)/boron nitride composite phase change materials for solar-thermal-electric energy conversion and storage with very low content of graphene nanoplatelets. Eng. J. 2017, 315, 481–490.
- Liu, Z.; Wei, H.; Tang, B.; Xu, S.; Shufen, Z. Novel light–driven CF/PEG/SiO2 composite phase change materials with high thermal conductivity. Energy Mater. Sol. Cells 2018, 174, 538–544.
- Qian, T.; Li, J.; Feng, W.; Nian, H. Single-walled carbon nanotube for shape stabilization and enhanced phase change heat transfer of polyethylene glycol phase change material. Energy Convers. Manag. 2017, 143, 96–108.
- Tang, B.;Wang, Y.; Qiu, M.; Zhang, S. A full-band sunlight-driven carbon nanotube/PEG/SiO2 composites for solar energy storage. Energy Mater. Sol. Cells 2014, 123, 7–12.
- Cabaleiro, D.; Hamze, S.; Fal, J.; Marcos, M.A.; Estellé, P.; Zyła, G. Thermal and Physical Characterization of PEG Phase Change Materials Enhanced by Carbon-Based Nanoparticles. Nanomaterials 2020, 10, 1168.
- Navidbakhsh, S.; Majdan-Cegincara, R. Effect of c-Fe2O3 nanoparticles on rheological and volumetric properties of solutions containing polyethylene glycol. J. Ind. Chem. 2017, 8, 433–445.
- Yapici, K.; Cakmak, N.K.; Ilhan, N.; Uludag, Y. Rheological characterization of polyethylene glycol based TiO2 Korea-Aust. Rheol. J. 2014, 26, 355–363.
- Marcos, M.A.; Lugo, L.; Ageev, S.V.; Podolsky, N.E.; Cabaleiro, D.; Postnov, V.N.; Semenov, K.N. Influence of molecular mass of PEG on rheological behaviour of MWCNT-based nanofluids for thermal energy storage. Mol. Liq. 2018, 318, 113965.
- Meyer, J.P.; Adio, S.A.; Sharifpur, M.; Nwosu, P.N. The Viscosity of Nanofluids: A Review of the Theoretical, Empirical, and Numerical Models. Heat Transf. Eng. 2016, 37, 387–421.
This entry is adapted from the peer-reviewed paper 10.3390/nano11010086