Your browser does not fully support modern features. Please upgrade for a smoother experience.
Please note this is an old version of this entry, which may differ significantly from the current revision.
Stock prediction has garnered considerable attention among investors, with a recent focus on the application of machine learning techniques to enhance predictive accuracy. Prior research has established the effectiveness of machine learning in forecasting stock market trends, irrespective of the analytical approach employed, be it technical, fundamental, or sentiment analysis.
- machine learning
- fundamental analysis
- artificial intelligence models
- financial ratios
- random forest
- feedforward neural network
1. Introduction
In recent years, numerous studies have explored the application of machine learning techniques in stock prediction. H. Yu et al. [10] introduced SVM and PCA in 2014, while X. D. Zhang et al. [11] experimented with AdaBoost in 2016. Additionally, K. Sabbar et al. [12] ventured into stock prediction in 2023, incorporating machine learning and deep learning models. Notably, V. Dhingra et al. [13] in 2021 and K. Olorunnimbe et al. [14] in 2023 delved into deep learning models for this purpose. Most of these studies center on technical and sentiment analysis.
Beyond predictive modeling, there have been surveys and reviews in recent years. I. Ibidapo et al. [15] conducted a study in 2017, and R. M. Dhokane et al. [16] carried out a review in 2023.
In a historical context, the works of B. Graham [17] in 1962 profoundly influenced stock selection and investment. These works span diverse topics, encompassing value investing, fundamental analysis, behavioral finance, risk management, and various investment philosophies rooted in Graham’s enduring principles.
In 1999, Quah and Srinivasan [18] developed a model employing a Feedforward Neural Network (FNN) for stock selection based on quarterly fundamental financial factors. The model demonstrated remarkable success in outperforming the market during testing.
In 2003, Eakins and Stansell [19] employed neural networks to predict stock prices using financial ratios and yearly financial data from 1975 to 1996. Their portfolio of the predicted top 50 stocks outperformed the S&P 500 and Dow Jones Industrial Average.
In 2008, T.S. Quah [20] focused on applying neural networks to fundamental analysis for stock selection in the Dow Jones Industrial Average (DJIA). This research aimed to enhance decision-making processes, offering valuable insights for portfolio management.
In 2018, Namdari and Li [1] utilized an FNN for fundamental analysis to predict stock trends by analyzing 12 financial ratios. Their dataset included 578 companies listed on Nasdaq between June 2012 and February 2017. The FNN model employing fundamental analysis outperformed the one using historical prices.
In 2021, Z.Y. Lu and S.M. Yuan [3] employed an FNN model with 18 financial ratios and sector dummy variables to predict potential stock returns for the next quarter. This approach improved prediction accuracy by incorporating sectors as dummy variables.
In the same year, Huang Y., Capretz L.F., and Ho D. [2] used FNN, Random Forest (RF), and the Adaptive Neural Fuzzy Inference System (ANFIS) to predict potential stock returns by analyzing 20 financial statements and returns. Their portfolio selections yielded substantial excess returns.
W. Chen [21] et al. proposed a novel model, the Graph Convolutional Feature-based Convolutional Neural Network (GC-CNN), for stock prediction in 2021. This model incorporates both individual stock information and stock market data, demonstrating superior performance and adaptability for long-term stock trend prediction.
In 2021, D. Zhang et al. [22] explored the backpropagation algorithm in neural networks for stock price pattern classification and prediction, offering valuable insights for investors and traders.
In 2022, J. Hong et al. [23] introduced a correlational strategy focusing on the analysis of stock technical indicators (STI) and stock movement using neural networks and other machine learning tools. This approach aims to improve prediction accuracy and reduce error rates in stock market analysis, catering to various stockholders’ investment decisions.
2. Random Forest (RF)
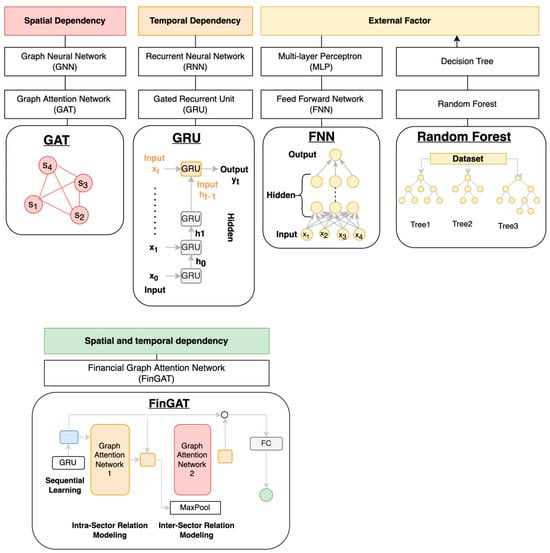
Random Forest (RF) stands out as an ensemble learning technique purposefully tailored for stock selection. It draws its inspiration from the concept of decision trees and, during the training process, constructs a multitude of trees. Initially developed by Leo Breiman [5] and Adele Cutler [6], this algorithm is engineered to forge a predictive model for a target variable’s value by assimilating straightforward decision rules from the dataset’s features.
In the realm of stock selection, Random Forest employs a strategic approach. It leverages a random subset of training data and input characteristics to craft each tree within the set. This approach serves the dual purpose of mitigating overfitting concerns and bolstering the model’s capacity to generalize effectively when confronted with unseen data. By incorporating the practice of bootstrap aggregation (bagging), the algorithm further augments tree diversity and curtails variance.
The paramount aim of employing Random Forest for stock selection revolves around forecasting stock performance and behavior, guided by a mosaic of characteristics and factors. Via an examination of historical data and patterns, this model can furnish insights into the potential value or trajectory of stocks, as depicted in Figure 3. Such insights are of paramount importance to investors and traders as they navigate the terrain of making well-informed decisions.
3. Feedforward Neural Network (FNN)
The Feedforward Neural Network (FNN) [7,19,24,25,26,27,28,29] emerges as a robust artificial neural network model with notable relevance in the domain of stock selection. Typically, it consists of three or more layers, encompassing an input layer, at least one hidden layer, and an output layer. As depicted in Figure 3, each neuron within a layer establishes connections with every neuron in the subsequent layer.
In the context of stock selection, FNNs are harnessed to model and dissect intricate non-linear relationships between input variables and desired outcomes, such as forecasting stock returns or identifying potential investment prospects. The FNN’s prowess in grasping complex data patterns and dependencies positions it as a highly suitable tool for this endeavor.
The inception of FNN can be traced back to 1990 when Kimoto et al. [24] published its use for forecasting buying and selling signals for the TOPIX index, spanning from January 1987 to September 1989.
In summary, the FNN plays an invaluable role in stock selection by adeptly modeling and scrutinizing non-linear associations between inputs and outputs. Leveraging the backpropagation algorithm, the FNN can be trained to enhance its performance and elevate the precision of stock predictions and investment decisions.
4. Gate Recurrent Unit (GRU)
The Gated Recurrent Unit (GRU) is a recurrent neural network (RNN) architecture introduced by Kyunghyun Cho et al. [8] in 2014. It exhibits similarities with the long-short-term memory (LSTM) [26] network and delivers comparable performance. Nevertheless, GRU stands out for its efficiency, as it necessitates fewer parameters, resulting in computational savings compared to LSTM. You can observe the architecture of GRU in Figure 3.
GRU is expressly tailored to handle sequential data, enabling the smooth flow of information from one step to the next. In 2018, M.A. Hossain et al. [30] successfully demonstrated its efficiency in capturing temporal dependencies in sequential data, making it a promising tool for stock selection. Notably, when tested with S&P500 data, it exhibited superior capability in managing the stochastic nature of stock price movements, thus minimizing errors.
In summary, GRU, with its adept handling of sequential data, proves highly effective in analyzing historical stock data and uncovering influential patterns and trends that can impact future stock performance. As a result, GRU assumes a pivotal role in stock prediction models, contributing to the precision of stock selection for investment purposes.
5. Graph Attention Network (GAT)
An escalating body of research is delving into the application of graph neural networks (GNNs) within the financial realm, driven by their aptitude for capturing the intricate interconnections between stocks. A study published in 2021 [29] synthesized the typical architectures of GNNs deployed in the financial sector.
The Graph Attention Network (GAT) [31] is a specific subtype of graph neural network (GNN) renowned for its proficiency in dissecting the intricate relationships prevalent in stock markets. The financial domain has witnessed a growing number of investigations delving into the utilization of graph neural networks (GNNs) due to their adeptness at comprehending the intricate linkages between stocks. This research has neatly outlined the prevailing structural patterns of GNNs as applied in finance.
6. Financial Graph Attention Network (FinGAT)
In 2021, Hsu, Y. L. et al. [9] introduced an innovative network named FinGAT, which amalgamates the capabilities of the Gated Recurrent Unit (GRU) and the Graph Attention Network (GAT) to forecast stock returns using price data. This method ranked stocks based on their predicted returns and constructed portfolios accordingly. The dataset encompassed 100 stocks in the Taiwan stock market, 424 in the S&P500 index, and 1026 in the NASDAQ index. Impressively, FinGAT outperformed other competing models, including FNN, GRU, and RankLSTM.
FinGAT stands as an advanced neural network meticulously designed for the precise prediction of stock returns. It effectively harnesses the power of graph attention mechanisms to grasp the intricate relationships between diverse stocks. The system comprises three pivotal components: the Gated Recurrent Unit (GRU) for sequential learning, the intra-sector relationship within the Graph Attention Network (GAT), and the inter-sector relationship of GAT, as visualized in Figure 3. The synergy of GAT and GRU is the defining attribute of FinGAT, enabling it to efficiently comprehend and leverage the relationships both within and among sectors of stocks.
This entry is adapted from the peer-reviewed paper 10.3390/math11234758
This entry is offline, you can click here to edit this entry!