Your browser does not fully support modern features. Please upgrade for a smoother experience.
Please note this is an old version of this entry, which may differ significantly from the current revision.
Subjects:
Engineering, Civil
Accurately identifying the location and depth of buried utility assets became a considerable challenge in the construction industry, for which accidental strikes can cause important economic losses and safety concerns. While the collection of as-built utility locations is becoming more accurate, there still exists an important need to be capable of accurately detecting buried utilities in order to eliminate risks associated with digging. With advances in artificial intelligence (AI), an opportunity arose in conducting virtual sensing of buried utilities by combining robotics (e.g., drones), knowledge, and logic.
- artificial intelligence
- virtual sensing
- underground utilities
- buried utilities
- data fusion
- knowledge database
1. Aerial Mapping
Aerial mapping (AM) of mapping underground utility typically consists of locating aboveground utility appurtenances to infer the likelihood of buried utility based on the utility flow of operations and industry rules. AM techniques are known to be cost-effective and non-intrusive [11]. AI in applications to AM is typically used as either (1) a computer vision tool to identify the assets or (2) a utility-mapping tool based on inference or logic rules to identify assets and predict the underground network. While it was argued by White et al. [12] that the concept of AM is more suitable for fluid-carrying utilities that depend on a gravity-flow rather than being pressurized, other works demonstrated the potential of AM to be successful for both fluid and non-fluid carrying utilities. For instance, Hassan et al. [13] generated an electrical utility map based on the location of transformers and poles using geographic information system (GIS) data.
One of the limitations of generating a utility map with the AM technique is its reliance on a knowledge database. While standards exist to harness such databases, such as those from the National Electric Safety Code and American Water Works Association, various uncertainties could lead to high variability in the accuracy of an automated process, including non-compliance [14] among utility operators and the presence of abandoned or out-of-service aboveground assets [15]. Additionally, the use of AM as an automated process was widely researched and demonstrated with manhole assets, but applications with other utility classes are still lacking.
A popular method to automate AM mapping of aboveground assets is through computer vision algorithms. This task consists of identifying key utility assets from pictures. Figure 2 illustrates an example through a street-level image, showing identifiable utility-related appurtenances and the position of underground utilities at that location.
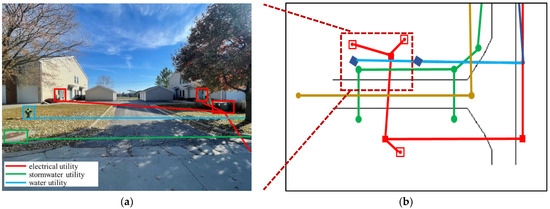
Figure 2. (a) Street-level image showing positions of utility appurtenance in rectangular boxes and the underground utility asset location in continuous lines; (b) utility map at the given location.
Potential sources of image inputs for AM include satellite imagery, aerial photographs, mobile images, photogrammetry, and light detection and ranging (LiDAR) technology collection. In particular, the use of satellite and aerial imagery can yield improved object recognition performance due to their improvement in image resolution [16]. As an example, Shermeyer et al. [17] found that the improvement in satellite imagery resolution from 30 cm/pixel to 15 cm/pixel upgraded the mean average precision of their object detection algorithm from 13% to 36%. Related to the application of satellite and aerial imagery to mapping utilities, Mnih et al. [18] applied a neural network approach to learn and detect road patterns. The detection of road patterns can be critical in mapping utilities as these sets of infrastructure are typically co-located [19]. There are additional examples of utility mapping using imagery. Bartoli et al. [20] reconstructed urban drainage networks by detecting manhole covers using a circular detection filter on orthophotos and satellite images. Pasquet et al. [21] identified the presence of underground utilities by locating manhole covers and stormwater drains from high-resolution aerial images using a linear support vector machine (SVM) classifier and a histogram of oriented gradients (HOG) that performed similarly to the circular detection filter used in Bartoli et al. [20].
Overall, the use of AI in conjunction with AM processes includes a vast array of methods to conduct both asset identification and buried utility location. Yet, from the review, the vast majority of works focused on the detection of manholes and their use in utility mapping. This disproportionate attention precluded the applications of AM and AI techniques to other utilities, such as electricity, natural gas, and telecommunication. There is also a lack of frameworks that combine both the tasks of asset identification and utility location.
2. Terrestrial Mapping
Terrestrial mapping (TM), not including photography, is typically conducted to achieve higher levels of mapping accuracy than those attainable via AM techniques. These can include the use of geophysical investigations or intrusive measures to achieve SUE quality-level A mapping accuracy through techniques such as vacuum excavation [38]. This method is widely used in today’s utility locating practices [39,40]. However, intrusive exposures for mapping can be costly as it can potentially disrupt critical activities such as construction and traffic [41], especially where utilities are within transportation right of way. The invasive technique also requires close attention to details during excavation to prevent damage to buried assets. A solution is to adopt non-intrusive sensing systems and geophysical tools such as ground-penetrating radar (GPR), metal detectors, vibro-acoustic systems, radio-frequency locators, and geoelectrical-resistive sensing methods [42]. These sensing methods output SUE quality-level B data [8], which has the potential to be further refined using data fusion techniques [43,44].
However, non-intrusive sensing requires highly trained operators to assess and evaluate information from scanned data [45]. Data processing can also be challenging, even for experts [46]. AI techniques provide a promising solution for assisting the non-intrusive process by automatically and rapidly evaluating sensing data to support actionable decisions.
GPR-generated data can be complex to analyze. Typically, the hyperbolic signatures form by joining the discrete travel time of the electromagnetic waves as they pulse back from the targets [48]. Information such as the object’s depth and horizontal position is estimated using the hyperbolic signature’s spread, position in radargram, and degree of resolution. Yet, the manual reading of radargrams is often challenging due to the intrinsic differences in material properties of targets and soil characteristics. Several AI tools were developed and applied to assist the interpretation of GRP-collected data, in particular for applications regarding underground utilities [49,50,51,52].
One popular tool is the Hough transform (HT), used to extract geometrical features in images [53]. It was used by Capineri et al. [54] in locating the position of buried objects represented by hyperbola in GPR radargrams. The HT was also used in Al-Nuaimy et al. [55], where the HT was combined with a backpropagating neural network to detect buried utilities and other solid objects. Al-Nuaimy et al. [56] proposed an adaptive non-accumulated Hough transform (ANHT) to reduce the memory demand relative to the conventional HT and demonstrated that the technique could be applied to detect linear structures such as pipes and cables. Modified HT variants were proposed. For instance, Simi et al. [57] developed the randomized HT that yielded underground utility detection accuracy greater than 85% over different ground conditions such as asphalt, grass, and concrete; Al-Nuaimy et al. [55] used a modified HT to detect targets in a GPR radargram with a significantly low signal-to-noise ratio; and Maas et al. [58] combined the Viola–Jones learning algorithm with the HT to separate regions of interest and extract vertices and locations of the hyperbola. Other works adopted the HT technique for recognizing, localizing, and evaluating hyperbolic indications, wave velocity, buried pipe diameters, and asset depths in radargram [59,60,61,62].
It was argued in Chen and Cohn [62] that some early methods enabling automatic detection in GPR hyperbolic signatures were not suitable for on-site applications due to their computation complexity and unsatisfactory detection rate resulting from insufficient training. The authors proposed a probabilistic hyperbolae mixture model based on a classification expectation-maximization algorithm and a Bayesian information criterion for model selection. Compared to other HT, their proposed model completed the utility identification task in 1.7 s, while the HT completed a similar task in 226.1 s. In Dou et al. [63], a column-connect clustering algorithm was developed, which first discriminates targeted utilities represented as hyperbolas from the radargram background, with the algorithm yielding a 23% improvement in detection rate than for the pattern recognition technique used for a similar task in [58]. A variant of the column-connect clustering algorithm was investigated by Rosin, P. [64] that resulted in a 6% improvement in the model accuracy (F1-score).
Support vector machine (SVM) gained popularity in GPR data classification tasks. Zhang et al. [65] used SVM for the automatic extraction and classification of buried landmines from a GPR radargram; El-Mahallawy et al. [66] adopted an SVM classifier to identify underground utilities and showed 100% and 78% recognition accuracies in an ideal and noise-degraded environment, respectively; Lu et al. [67] proposed to combine a discrete wavelet transform, fractional Fourier transform, and SVM for classifying subsurface objects material from GPR data; Terrasse et al. [68] detected buried gas pipes using an SVM classifier and reported a 96% detection rate; Kaur et al. [69] combined HOG with SVM to map deteriorated reinforcement bars; Noreen et al. [70] automated buried pipe detections using HOG features clustered with an SVM algorithm; and Ozkaya et al. [71] fed features extracted from GPR radargram images using convolutional neural networks into an SVM algorithm to detect and classify hyperbolic signatures, material, shape and soil type.
Genetic programming (GP) was employed in automating GPR data processing. Pasolli et al. [72] proposed an automatic detection process that uses an iterative genetic algorithm to detect and locate the position of underground utilities in GPR radargrams. Kobashigawa et al. [73] adopted GP to detect buried unexploded ordnances in GPR radargrams. The GP algorithm performance was compared against different neural networks of varying hidden layers and showed improved performance over complex radargrams. Additionally, Harkat et al. [74] proposed to utilize a radial basis network with a multi-objective genetic algorithm to improve region classifications.
There is also a vast amount of research that focused on the use of neural networks in processing GPR radargrams. For example, Birkenfeld, S. [75] presented a non-fully connected neural network model that identifies interfering or incomplete hyperbolas. Lei et al. [46] proposed the faster region-based convolution neural network (R-CNN) and data augmentation to detect regions of buried objects in GPR images. Liu et al. [76] proposed a deep learning model, termed a single shot multi-box detector, to detect hyperbolae. When compared with the faster R-CNN model adopted by Lei et al. [46], the technique showed a higher precision rate with lower computational time. Yamaguchi et al. [77] conducted the 3-D location of buried pipes in GPR radargrams using 3D-CNN. A 10% improvement in accuracy level was observed when compared to an SVM. The extracted positions, inclinations, and arrangement of pipes were visualized in a 3-D map using Kirchhoff migration. Liu et al. [78] identified limitations in using hyperbolic signatures as the primary representative feature for buried utilities. The 3D GPR scan images formed by stitching parallel scan data were used as input to a 3D CNN. The proposed method produced a detection accuracy of 82.7%, compared with 69% for CNN with 2D GPR input data and 61% to 73.5% for other methods that included the AlexNet, ResNet50, VGG16 and 19, and Triplanar algorithms.
In summary, most of the reviewed literature in this section focused more on GPR because it remains the most used electromagnetic sensor for utility mapping. Other sensors demand AI applications to further improve data interpretation, such as vibro-acoustic and metal detectors that are used for non-metallic utility detection and rapid utility probing, respectively.
3. Data/Information Fusion
The previous two sections focused on the use of AI to interpret single-source data. In creating virtual sensors capable of mapping underground utilities based on limited information, one must consider the integration of multi-source data in order to improve the quality of the harnessed information and, thus, the accuracy of maps through a process known as data fusion [82,83,84,85]. For example, Dutta et al. [81] proposed to fuse GPR and vibro-acoustic data to combine sensing performance in reading through non-saturated soils (GPR) and saturated soils (vibro-acoustic), and Metje et al. [11] studied the potential of combining GPR, low-frequency quasi-static electromagnetic fields, and acoustic technologies to improve underground utility mapping accuracy. Generally, while the fusion of data is conducted through user-defined rules and metrics, the iterative process is automated for robustness over extensive knowledge and data space [86]. This section surveys different AI techniques used in fusing data in order to produce maps of underground utilities.
Fuzzy logic was used by Lanka et al. [37] as an approximate reasoning method to fuse data from different sources. The proposed model determines the probability of a utility to be located at any Cartesian point based on (1) proximity to manholes; (2) perpendicular distance from the point of interest to the nearest known utility line; (3) expert knowledge on a possible underground utility route; and (4) GPR data analysis. Another technique studied by Chen and Cohn [36] is based on Bayesian data fusion (BDF) to automatically produce refined utility maps by fusing GPR data, surveyed manholes, assumptions on pipe linearity, and utility records. In this research, manholes are investigated to determine the depths and orientations of the underground pipes. This study adopted the joint compatibility branch and bound algorithm developed by Neira and Tardos [87] to establish an initial map by matching utilities discovered from the manhole survey and GPR scan. Prior knowledge used in the BDF is deduced by matching connections in the as-built maps and GPR-detected points. With the Gaussian distribution assumed, the posterior probability of the BDF is estimated from prior and likelihood probabilities. The posterior map is automatically refined through an iterative process guided by a validation threshold.
Recent work by Zhou et al. [88] proposed a probabilistic pipeline mapping model that fuses records, pipe information from manhole covers, and remote sensing technologies such as GPR and electro-magnetic. The model maximizes the likelihood of fitting a pipeline from the set of detected points. By integrating the Bayesian information criterion, the proposed model avoids overfitting when classifying and fitting detected points into the most probable pipeline. The authors compared the performance of their algorithm with that proposed in Chen and Cohn [36] and demonstrated fewer mapping errors.
The reviewed literatures combined different data sources, mostly GPR, utility records, manhole survey, and other sensors. One underlying common limitation to most work is the reliance on manhole surveys. Firstly, it restricts the applicability to manhole-related utilities, and secondly, it is burdensome to open up and determine the geospatial coordinates of every manhole in the area of interest at the same time. It should also be noted that techniques relying on as-built maps as prior knowledge can be challenging to apply when such information is unavailable or outdated.
This entry is adapted from the peer-reviewed paper 10.3390/s23094367
This entry is offline, you can click here to edit this entry!