Your browser does not fully support modern features. Please upgrade for a smoother experience.
Please note this is a comparison between Version 1 by ABDULRAHMAN ABDULLAH BAHASHWAN and Version 2 by Amina Yu.
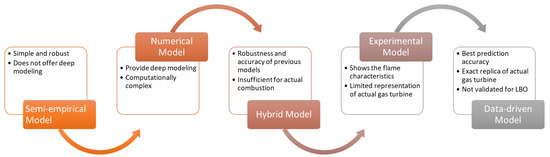
The lean blowout is the most critical issue in lean premixed gas turbine combustion. Decades of research into LBO prediction methods have yielded promising results. Predictions can be classified into five categories based on methodology: semi-empirical model, numerical simulation, hybrid, experimental, and data-driven model.
- gas turbine
- lean premixed combustor
- lean blowout
- prediction technique
- data-driven
1. The Semi-Empirical Model
The combustors’ geometries are pretty complicated. Because of the high complexity, the semi-empirical model is proposed based on the physical approach to simplify the system because the physics-based model is the preferred model within the semi-empirical. In addition, the semi-empirical model could help provide a good estimation of the gas turbine performance and can be used to improve the LBO limits at the design stages of the LPM combustors. Because of this simultaneous complexity, it is recommended that a semi-empirical model be used to simplify the system [1][20].
The swirl-stabilized combustor is the most common form of the gas turbine. The LBO mechanism and prediction techniques for such combustors have been extensively explored during the last decades. One of the most widely used approaches for predicting the lean blowout gas turbine is the the semi-empirical-based model. Since the semi-empirical approach was developed earlier, it has gone through a lengthy study process and has been progressively changed and enhanced to ensure its suitability for engineering applications. The model is mainly used for LBO limits prediction in the gas turbine. It was an essential tool for designing a lean premixed combustor with better LBO limits. The semi-empirical approach can be divided into two categories: the first is the characteristic time (CT) and the second is the perfect stirred reactor (PSR).
The CT model is based on the Damkohler (Da) number, and it was was pioneered by Zukoski and Marble [2][21], who made a breakthrough in the semi-empirical models in 1955. The authors used the ignition delay time of the fuel/air mixes as an equivalent to the time required for shear layer mixing. In another word, The LBO would occur when the ignition delay time is longer than the particle time spent in the shear layer. On the opposite side, the combustion is stable when the ignition delay time is shorter. Therefore, the indication of LBO is when both times are equal. The equation can be written as follows

where τsh and τig are the particle time spent in a shear layer and the ignition delay time, respectively. Such a simple equation was beneficial in the early stages of LPM combustion design to predict the LBO limits in terms of determining the best recirculating zone length and the stream velocity, as the equation can be further written as follows

where Lrz and Vs are the length of the recirculation zone and the steam velocity. Because of the simplicity of the model, it needed further development to predict the LBO limit accurately. Later, Plee and Mellor [3][22] improved the characteristic time model’s prediction formula of Zukoaki and Marble, and they added droplet evaporation rates to the preceding model and successfully validated the model on three types of combustors [4][5][6][7][23,24,25,26]. The equation of Plee and Mellor can be expressed as follows

where Tdr is the droplet evaporation rate. However, the performance of the model was not optimum.
On the other hand, Longwell et al. [8][27] in 1953 hypothesized that the recirculation zone behind a bluff body might be idealized as a Perfect Stirred Reactor (PSR), with the burning zone being the PSR. The PSR model became a central tenet in the research of the LBO semi-empirical models. The authors suggested that when the heat loss in the recirculation zone and the heat released are equal, LBO will occur. Additionally, they observed that the pressure of the recirculation zone is proportional to the stability of LBO velocity.
Later, Lefebvre [9][10][28,29], one of the pioneers of the semi-empirical model, developed a model and advanced the prediction formula and expression based on Longwells’s work to make it capable of predicting LBO limits in the swirl-stabilized combustors. According to Lefebvre’s LBO model, the LBO limitations are determined by combustor geometries, operation conditions, and fuel characteristics. The main assumptions of Lefebvre’s model are that the whole inlet air flow is involved in the fuel mixing and combustion at the LBO, and secondly, the turbulent flame filled the whole combustor at LBO, as shown in the physical model of Lefebvre’s expression. The model was validated on eight different combustors with uncertainties of ±30% [11][30].
Afterward, numerous works to improve the Lefebvre model have been suggested, as Lefebvre’s formula uses a constant to represent the combustor configurations of the upstream dilution holes, which limits the model’s applicability in different variations of combustors. Therefore, a study used a formula to replace the constant value in Lefebvre’s model, as documented by Ateshkadi et al. [12][32], and they included a temperature-based parameter collected from their experimental results. However, Mongia et al. [13][33] revealed that none of the existing models can be used for modern combustion and suggested that the focus should be on the flame volume rather than the combustion volume to improve Lefebvre’s model further. Later, Mongia et al. [14][34] used a data reduction to evaluate the test data in order to achieve more accurate predictions. They then optimized Lefebvre’s LBO model’s parameters and exponents to be applicable to 5 different combustors.
Furthermore, Xie et al. [15][31] proposed a new semi-empirical model based on Lefebvre’s model better to investigate the impact of geometrical structural factors on combustors. The authors used the concept of flame volume (FV) observations based on a visualization experiment of the flame size at different fuel/air ratios. It was noticed that the flame could not fill the whole area within the combustor liner near the LBO, and it was instead very short. Adding the FV approach has improved Lefebvre’s model. It considers the effect of the variation in primary zone configuration and the dome geometry as the FV varies depending on the combustor’s design. The main assumptions of the FV model at LBO are that the inlet airflow can be divided into two parts: the airflow involved in the combustion (dome airflow and part of the liner airflow) and the airflow in the dilution downstream, as shown in the physical model of FV LBO expression. The second assumption is that the remaining airflow enters the liner uniformly, and the airflow involved in the combustion depends on the size of the turbulent flame zone.
The flame volume approach offers a more direct link between LBO performance and flame characteristics, so increasing the modeling depth and, consequently, the prediction accuracy [16][35]. On the other hand, with the recent development in LPM combustion, the ultra-low NOx emission gas turbine came into existence. The geometry of the new combustor’s dome differs from the previous combustors to achieve lower NOx emission and better stability. The fuel/air inlets are divided into the main and pilot stages. Only the pilot stages operate near LBO to ensure power and flame stability. Due to the differences in the previous and the current dome configuration, the earlier models’ performance was not ideal for predicting the LBO limits. Therefore, another study was conducted by Sun et al. [17][36], who improved the FV model by using a novel flame volume and multi-point (FV-MP) to be used for the low NOx combustor.
Similarly, Rowen’s model is a well-known semi-empirical model that is used explicitly for heavy-duty gas turbines [18][37]. Rowen’s model is a simplified mathematical representation of the conventional gas turbine, as shown in the simplified block diagram. However, due to the recent development and the existance of the dry low emission (DLE) gas turbine, the model was improved by Omar et al. [19][20][21][22][38,39,40,41] by adding a pilot fuel valve based on the DLE gas turbine operational data. The improved model could produce high accuracy prediction for the gas turbine performance, and it can be used for LBO limits prediction for the new combustors.
When it comes to dealing with lean blowout limit prediction, the semi-empirical methodologies are often the most practical options due to their simplicity, robustness, and cost-effectiveness. Its primary use is in the design stage, where it assists in the investigation of the limits of the LBO and developing combustors that are more resistant to such an occurrence. Until today, the semi-empirical model is widely utilized in aero-engine lean blowout prediction but not in heavy-duty industrial gas turbines. Although this strategy is the oldest one compared to the others, and even though it has undergone many different types of development and refinement, it still has significant drawbacks. It exhibits little generalizability in a variety of combustors; therefore, the degree of uncertainty might be as high as fifty percent, particularly with regard to newly developed combustors [23][42]. Similarly, the lack of depth in the semi-empirical modeling substantially impacts the accuracy and inability to associate the geometric variation with the LBO events [16][35]. On the other hand, as was mentioned earlier, various semi-empirical models, such as Rowen’s model, show promising results in presenting the lean premixed heavy-duty gas turbines. These results are especially promising when the models are associated with a numerical simulation approach or a data-driven configuration to improve their accuracy of LBO limits predictions.
 Although there have been many advancements in modeling techniques over the last several decades, two main frameworks have arisen depending on the degree of characterization of the underlying flow: the Reynolds-averaged Navier–Stokes (RANS) approach and the recent Large Eddy Simulation (LES) method. The RANS approach is still a popular method for LBO prediction and is preferred to the LES in some studies due to its low computational cost and complexity, due to the disregard of the time resolution, as documented by Ahmed and Yong [16][35]. The authors predicted the LBO using the primary zone’s flow structure. Then, the data were simulated using RANS simulation and compared with experimental data. The result showed high efficiency in predicting LBO. Later, Akhtar et al. [26][5] used a combination of a flame-generated-manifold (FGM) model and Reynolds-Averaged Navier–Stokes (RANS) turbulence modeling to explore a turbulent premixed single jet flame at an enhanced preheating temperature and pressure. They discovered that the flame location depended on the input velocity or turbulence and could compute LBO limits with a ±20% uncertainty compared to the experimental blowout velocity. Nevertheless, RANS is less accurate than LES and considered a non-universal approach [27][45].
On the other hand, the LES technique has emerged as the go-to numerical tool for combustion applications because of its efficacy in describing turbulent physical processes. In addition, the LES framework may take advantage of the exponential growth of computation speed by steadily amplifying the range of physical length and time scales that are directly resolved rather than modeled. This is where LES comes in handy as it provides a smooth transition to model-free DNS [28][46]. As a result, the discipline of turbulent combustion has majorly chosen the LES method, leading to impressive developments in a number of subfields [29][30][47,48]. It has been used in a number of studies, such as those of Ihme and Pitsch [31][49], Garmory and Mastorakos [32][50], Ayache et al. [33][51], and Hasti et al. [34][52], to predict the LBO successfully.
Furthermore, some studies suggested using the chemical reduction technique to reduce the computation time, especially by utilizing the FGM model with the LES model as documented by Nassini et al. [35][53]. The authors investigated the flame behavior and fragmentation of the flame using the FGM model based on an expanded turbulent flame closure (TFC) technique and the LES simulation. The two tested operating conditions deviated from the computed equivalence ratio by ±5% and ±10% from the experimental LBO point. Similarly, Schwagerus et al. [36][54] used FGM with LES simulation to reduce computation time. The authors focused on observing flame shape changes close to LBO by decreasing the fuel/air equivalence ratios Φ with constant inlet velocity. Secondly, by increasing the inlet velocity with a constant fuel/air equivalence ratios Φ, the result showed a conical flame under unstable conditions and the flame extended near LBO. The LBO occurs after reducing the equivalence ratios Φ and increasing the inlet velocity. The results of the proposed approach were very close to the experimental findings.
Additionally, other studies used the simulation method to predict the LBO away from the LES and RANS as documented by Maran et al. [37][60]. The authors used simulations for various intake pressures and V-gutter angles. A simplified approach was used for predicting the LBO for an afterburner combustor by using the recirculation zone’s average gas temperature (AGT). The prediction was successful and showed ±10% uncertainty compared to the experimental values. Similarly, V and R [38][61] tested the influence of combustor inlet air ratio (CIAR) on the LBO of a micro gas turbine of a swirl stabilized can-type combustor. The author used the 2D simulation method on FLUENT software by using the average exit gas temperature (AEGT) as the parameter. The result showed that the LBO limit increases with the decrease of inlet air velocity and significantly decreases with low inlet air velocity and reduction in CIAR, matching accuracy with the experimental findings with a deviation of ±6.23%. The chemical reactor network (CRN) simulation has been utilized as well for LBO prediction as seen in Kaluri et al. [39][59] and Gupta et al. [40][62]. The authors used a real-time model to predict the event of LBO by using temperature measurements in real time using the real-time chemical reactor network (RT-CRN). The input is the measured temperature and mass flow rate of fuel/air. The result showed that near LBO, a maximum concentration of hydroxy OH radicals was downstream. The difference in the concentration of OH radicals in the flame zone and recirculation zone indicates near LBO. However, the CRN approach was not easy to implement.
Although there have been many advancements in modeling techniques over the last several decades, two main frameworks have arisen depending on the degree of characterization of the underlying flow: the Reynolds-averaged Navier–Stokes (RANS) approach and the recent Large Eddy Simulation (LES) method. The RANS approach is still a popular method for LBO prediction and is preferred to the LES in some studies due to its low computational cost and complexity, due to the disregard of the time resolution, as documented by Ahmed and Yong [16][35]. The authors predicted the LBO using the primary zone’s flow structure. Then, the data were simulated using RANS simulation and compared with experimental data. The result showed high efficiency in predicting LBO. Later, Akhtar et al. [26][5] used a combination of a flame-generated-manifold (FGM) model and Reynolds-Averaged Navier–Stokes (RANS) turbulence modeling to explore a turbulent premixed single jet flame at an enhanced preheating temperature and pressure. They discovered that the flame location depended on the input velocity or turbulence and could compute LBO limits with a ±20% uncertainty compared to the experimental blowout velocity. Nevertheless, RANS is less accurate than LES and considered a non-universal approach [27][45].
On the other hand, the LES technique has emerged as the go-to numerical tool for combustion applications because of its efficacy in describing turbulent physical processes. In addition, the LES framework may take advantage of the exponential growth of computation speed by steadily amplifying the range of physical length and time scales that are directly resolved rather than modeled. This is where LES comes in handy as it provides a smooth transition to model-free DNS [28][46]. As a result, the discipline of turbulent combustion has majorly chosen the LES method, leading to impressive developments in a number of subfields [29][30][47,48]. It has been used in a number of studies, such as those of Ihme and Pitsch [31][49], Garmory and Mastorakos [32][50], Ayache et al. [33][51], and Hasti et al. [34][52], to predict the LBO successfully.
Furthermore, some studies suggested using the chemical reduction technique to reduce the computation time, especially by utilizing the FGM model with the LES model as documented by Nassini et al. [35][53]. The authors investigated the flame behavior and fragmentation of the flame using the FGM model based on an expanded turbulent flame closure (TFC) technique and the LES simulation. The two tested operating conditions deviated from the computed equivalence ratio by ±5% and ±10% from the experimental LBO point. Similarly, Schwagerus et al. [36][54] used FGM with LES simulation to reduce computation time. The authors focused on observing flame shape changes close to LBO by decreasing the fuel/air equivalence ratios Φ with constant inlet velocity. Secondly, by increasing the inlet velocity with a constant fuel/air equivalence ratios Φ, the result showed a conical flame under unstable conditions and the flame extended near LBO. The LBO occurs after reducing the equivalence ratios Φ and increasing the inlet velocity. The results of the proposed approach were very close to the experimental findings.
Additionally, other studies used the simulation method to predict the LBO away from the LES and RANS as documented by Maran et al. [37][60]. The authors used simulations for various intake pressures and V-gutter angles. A simplified approach was used for predicting the LBO for an afterburner combustor by using the recirculation zone’s average gas temperature (AGT). The prediction was successful and showed ±10% uncertainty compared to the experimental values. Similarly, V and R [38][61] tested the influence of combustor inlet air ratio (CIAR) on the LBO of a micro gas turbine of a swirl stabilized can-type combustor. The author used the 2D simulation method on FLUENT software by using the average exit gas temperature (AEGT) as the parameter. The result showed that the LBO limit increases with the decrease of inlet air velocity and significantly decreases with low inlet air velocity and reduction in CIAR, matching accuracy with the experimental findings with a deviation of ±6.23%. The chemical reactor network (CRN) simulation has been utilized as well for LBO prediction as seen in Kaluri et al. [39][59] and Gupta et al. [40][62]. The authors used a real-time model to predict the event of LBO by using temperature measurements in real time using the real-time chemical reactor network (RT-CRN). The input is the measured temperature and mass flow rate of fuel/air. The result showed that near LBO, a maximum concentration of hydroxy OH radicals was downstream. The difference in the concentration of OH radicals in the flame zone and recirculation zone indicates near LBO. However, the CRN approach was not easy to implement.
2. Numerical Simulation
The semi-empirical model provided fundamental information for the prediction of LBO limits. However, it was a simplistic approach and does not provide deeper knowledge on the matter as shown in the development process in Figure 1. Therefore, there has been an increase in the reporting of numerical prediction methods in recent years. The LBO limits are often determined using either the Large Eddy Simulation (LES) or Unsteady Reynolds-averaged Navier–Stokes (URANS) methods. In the past, LES and Direct Numerical Simulation (DNS) have been used in numerical modeling to capture the dynamic features of the flame close to the LBO. Furthermore, the flow features have been studied extensively [24][43]. As a result, several articles published use numerical simulations to investigate the LBO phenomena. The main strength of numerical simulation is the capacity to construct complicated flow fields, both non-reactive and reactive. Nearly all studies using numerical models have revealed that the flow field is volatile close to the LBO [25][44].Figure 1.
Development of LBO prediction techniques.