The advancement in sensor technology has replaced the human olfaction system with an artificial olfaction system, i.e., electronic noses (E-noses) for quality control of teas to differentiate the distinct aromas. An E-nose system’s sensor array consists of some non-specific sensors, and an odor stimulus generates a fingerprint from this array. Fingerprints or patterns from known odors are used to train a pattern recognition model such that unknown odors can be classified and identified subsequently [9]. Recently, the E-nose has been regarded as a powerful tool for tea quality monitoring. For instance, wide applications in tea research include tea classification, tea fermentation methods, tea components, tea grade quality, and tea storage [3,9].
- aroma
- electronic nose
- gas sensors
- intelligent pattern recognition
- tea quality
1. Introduction
2. E-Nose Instrumentation
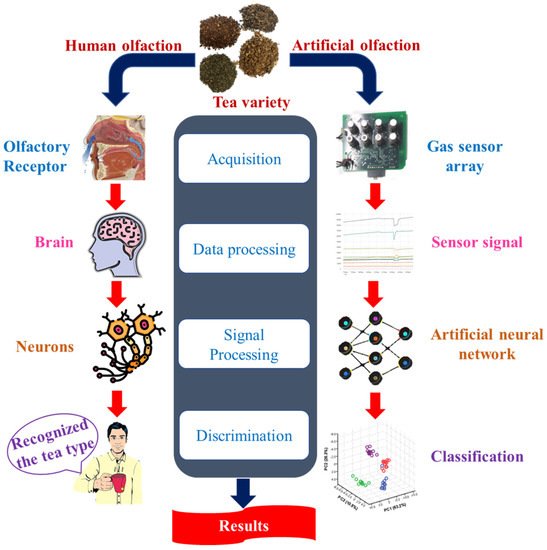
The E-nose device is designed in such a manner as to identify and distinguish between a variety of complex odors. This non-destructive device is composed of sensor arrays that react to the vapors and gases the sample generates. Typically, the sensor array comprises non-specific sensors that have been sensitized to various chemical substances; thus, each element measures a distinct property of the chemical perceived [8][12]. When the odors or volatile molecules react with the sensor array, subsequent changes in the electrical properties, mainly conductivity, occur. As a consequence, pattern recognition algorithms are used to characterize those detected changes to perform classification or discrimination of samples [9][13]. As represented in Figure 1, the E-nose device consists of three main parts: (1) sample handling system, (2) detection system, and (3) data processing system and pattern recognition algorithms. A comparison of the basic analogies between human olfaction (biological olfaction) and an E-nose (artificial olfaction) is represented in Figure 2.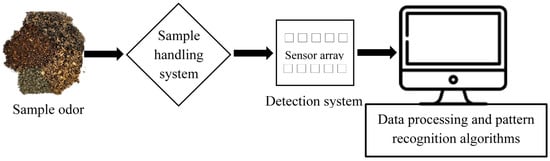
3. Pattern Recognition Algorithms for E-Nose
3. Pattern Recognition Algorithms for E-Nose
3.1. Statistical Pattern Recognition Methods
3.1.1. Linear Discriminant Analysis (LDA)
3.1.2. Principal Component Analysis (PCA)
3.1.3. Multinomial Logistic Regression (MultiLR)
3.1.4. Partial Least Squares Discriminant Analysis (PLS-DA)
3.1.5. Partial Least Squares Regression (PLSR)
3.1.6. Hierarchical Cluster Analysis (HCA)
3.2. Intelligent Pattern Recognition Methods
3.2.1. K-Nearest Neighbor (KNN)
3.2.2. Artificial Neural Network (ANN)
3.2.3. Convolutional Neural Network (CNN)
3.2.4. Decision Trees (DT) and Random Forest (RF)
3.2.5. Support Vector Machine (SVM)
4. Applications of E-Nose in Tea Quality Evaluation
In the tea industry, tea quality management is considered a critical responsibility. As a result, tea quality and nutrition throughout tea processing must be analyzed so as to maintain the top quality of marketed tea products. However, due to the high cost of tea items, adulteration is common, resulting in a flood of tea products bearing false brand names in the market and unscrupulous vendors profiting from the awful fakes. As a result, distinguishing between genuine and counterfeit products is difficult [36]. According to numerous reports, E-nose is a potential technology for monitoring the authenticity of food products [37].
In the tea industry, tea quality management is considered a critical responsibility. As a result, tea quality and nutrition throughout tea processing must be analyzed so as to maintain the top quality of marketed tea products. However, due to the high cost of tea items, adulteration is common, resulting in a flood of tea products bearing false brand names in the market and unscrupulous vendors profiting from the awful fakes. As a result, distinguishing between genuine and counterfeit products is difficult [54]. According to numerous reports, E-nose is a potential technology for monitoring the authenticity of food products [21].
Table 3
summarizes a set of E-noses utilized in combination with various pattern recognition algorithms to assess the quality of varied tea types from the last 10 years. E-nose devices were employed to categorize and differentiate different tea types according to their origins, quality grades, adulteration degree based on the mix ratios, and drying processes, and to monitor the smell variation of fermentation (
Table 3
).
| S. No. | Tea Variety | Purpose of Analysis | E-Nose Configuration | Pattern Recognition Methods | References | |
|---|---|---|---|---|---|---|
| 1 | Chaoqing Green Tea | To differentiate green teas according to its quality | E-nose system (developed by Agricultural Product Processing and Storage Laboratory, Jiangsu University, Zhenjiang, China) with 8 TGS gas sensors (Figaro Co., Ltd., Osaka, Japan) | PCA, SVM, KNN, and ANN | [3] | [9] |
| 2 | Longjing Tea | To detect tea aroma for tea quality identification | PEN3 (Airsense Analytics, Schwerin, Germany) with 10 MOS sensors | PCA, KNN, SVM and MLR | [19] | [38] |
| 3 | Longjing Tea | To develop a multi-level fusion framework for enhancing tea quality prediction accuracy | Fox 4000 (Alpha M.O.S., Co., Toulouse, France) with 18 MOS sensors | K(LDA), KNN | [2] | [8] |
| 4 | Xihu-Longjing Tea | To classify the grades of tea based on the feature fusion method | Fox 4000 (Alpha MOS Company, Toulouse, France) with 18 MOS sensors | K(PCA), K(LDA), KNN | [38] | [55] |
| 5 | Chinese Chrysanthemum Tea | To differentiate the aroma profiles of teas from different geographical origins | GC Flash E-nose (Alpha M.O.S. Heracles, Toulouse, France) | PCA | [39] | [5] |
| 6 | Pu-erh Tea | To perform classification of two types of teas based on the volatile components | Fox-3000 (Alpha MOS, Toulouse, France) with 12 MOS sensors | PCA | [40] | [56] |
| 7 | Green and Dark Tea | To assess the quality of tea grades | PEN3 (Airsense Analytics GmbH, Schwerin, Germany) with 10 gas sensors | PCA, LDA | [1] | [7] |
| 8 | Black Tea | To investigate in situ discrimination of the quality of tea samples | Lab-made E-nose with 8 MOS sensors (Figaro Engineering Inc., Osaka, Japan) | PCA, LDA, QDA, SVM-linear, SVM-radial | [5] | [10] |
| 9 | Xinyang Maojian Tea | To evaluate the different tastes of tea samples | PEN3 (Win Muster Airsense Analytics Inc., Schwerin, Germany) with 10 MOS sensors | MLR, PLSR, BPNN | [41] | [57] |
| 10 | Black Tea, Yellow Tea, and Green Tea | To evaluate polyphenols of cross-category teas | PEN3 (Win Muster Air-sense Analytics Inc., Schwerin, Germany) with 10 MOS sensors | RF, Grid-SVR, XGBoost | [4] | [3] |
| 11 | Pu-erh Tea | To discriminate between the aroma components of teas from varying storage years | PEN3 (Airsense, Schwerin, Germany) with 10 MOS sensors | LDA, PCA | [42] | [58] |
| 12 | Herbal Tea | To investigate bio-inspired flavor evaluation of teas from different types and brands | PEN3 (Win Muster Airsense Analytics Inc., Schwerin, Germany) with 10 MOS sensors | LDA, SVM, KNN, and PNN | [43] | [18] |
| 13 | Pu’er Tea | To devise a rapid method for determining the type, blended as well as mixed ratios of tea | PEN 3 (Airsense Inc., Schwerin, Germany) with 10 MOS sensors | LDA, CNN, PLSR | [44] | [59] |
| 14 | Green Tea | To evaluate the quality grades of different teas | PEN3 (Airsense Analytics GmbH, Schwerin, Germany) with 10 MOS sensors | PCA, LDA, RF, SVM, PLSR, KRR, SVR, MBPNN | [45] | [60] |
| 15 | Jasmine Tea | To examine the differences in aroma characteristics in different tea grades | ISENSO (Shanghai Ongshen Intelligent Technology Co., Ltd., Shanghai, China) with 10 MOS sensors | PCA, HCA | [46] | [61] |
| 16 | Xihu Longjing Tea | To detect teas from different geographical indications | PEN3 (Airsense Analytics GmbH, Schwerin, Germany) with 10 MOS sensors | PCA, SVM, RF, XGBoost, LightGBM, TrLightGBM, BPNN | [47] | [62] |
| 17 | Congou Black Tea | To investigate the aroma characteristics of tea during the variable-temperature final firing | Heracles II ultra-fast gas phase E-nose (Alpha M.O.S., Toulouse, France) | PLS-DA | [48] | [63] |
| 18 | Longjing Tea | To determine the different quality grades of green teas | PEN2 (Airsense Company, Schwerin, Germany) with 10 MOS sensors | PCA, DFA, PLSR | [49] | [64] |
| 19 | Pu-erh Tea | To rapidly characterize the volatile compounds in tea | Heracles II gas phase E-nose (Alpha M.O.S., Toulouse, France) | OPLS-DA | [50] | [65] |
| 20 | Longjing tea | To determine the tea quality of different grades | PEN3 (Airsense Corporation, Schwerin, Germany), with 10 MOS sensors | PCA, MDS, LDA, LR, SVM | [51] | [1] |
| 21 | Mulberry Tea | To develop a rapid and non-destructive method for visualizing the volatile profiles of different leaf tea samples of various grades | Fox 4000 (Alpha M.O.S., Toulouse, France) with 18 MOS sensors | PCA, LDA | [52] | [66] |
| 22 | Green Tea | To propose a multi-technology fusion system based on E-nose to evaluate pesticide residues in tea | Fox 4000 (ALPHA MOS, Toulouse, France) with 18 MOS sensors | PLS, SVM, ANN | [53] | [67] |
| 23 | Fuyun 6 and Jinguanyin Black Tea | To investigate the aroma differences of tea produced from two different tea cultivars | E-nose (Shanghai Ongshen Intelligent Technology Co., Ltd., Shanghai, China) with 10 sensors | LDA, PCA, HCA, OPLS-DA | [54] | [68] |
| 24 | Green Tea | To investigate the changes in volatile profiles of tea using different drying processes | Heracles II gas phase E-nose (Alpha M.O.S., Toulouse, France) | PLS-DA, PCA | [55] | [69] |
| 25 | Dianhong Black Tea | To investigate the quality of tea infusions | Heracles II fast GC-E-Nose (Alpha M.O.S., Toulouse, France) | PLS-DA, FDA | [56] | [70] |
| 26 | Oolong Tea | To discriminate between the smell of tea leaves during various stages of manufacturing process | E-nose with 12 MOS sensors (Figaro USA, Inc., Arlington Heights, IL, USA and Nissha FIS, Inc., Osaka, Japan) | LDA | [57] | [71] |
| 27 | Shucheng Xiaolanhua Tea | To enhance the performance of tea quality detection | PEN3 (Airsense Analytics, Schwerin, Germany) with 10 MOS sensors | K(PCA), KECA, SVM | [58] | [72] |
Tea polyphenols, amino acids, and caffeine are responsible for forming the astringency and bitterness of tea. Even though many methods have been developed to evaluate tea’s taste, this task has always been challenging. In this regard, a rapid and feasible method was established using E-nose and mathematical modelling to identify the bitterness and astringent taste of green tea samples. The findings revealed that the BPNN model was more reliable than the PLSR and MLR models in examining the bitterness and astringency of tea infusions [41].
Tea polyphenols, amino acids, and caffeine are responsible for forming the astringency and bitterness of tea. Even though many methods have been developed to evaluate tea’s taste, this task has always been challenging. In this regard, a rapid and feasible method was established using E-nose and mathematical modelling to identify the bitterness and astringent taste of green tea samples. The findings revealed that the BPNN model was more reliable than the PLSR and MLR models in examining the bitterness and astringency of tea infusions [57].
Processing technology is crucial in providing the distinctive flavor of black tea, including withering, rolling, fermentation, and drying processes. Yang et al. [63] employed E-nose to examine the volatile profile of Congou black tea, as well as the changes in the aroma features across the different variable-temperature final firing processes. The applied PLS-DA clearly differentiated the tea samples by different drying conditions.
Processing technology is crucial in providing the distinctive flavor of black tea, including withering, rolling, fermentation, and drying processes. Yang et al. [48] employed E-nose to examine the volatile profile of Congou black tea, as well as the changes in the aroma features across the different variable-temperature final firing processes. The applied PLS-DA clearly differentiated the tea samples by different drying conditions.