Your browser does not fully support modern features. Please upgrade for a smoother experience.
Please note this is a comparison between Version 1 by Francisco Drusso Martinez Garcia and Version 3 by Vivi Li.
The extracellular matrix (ECM) is a three-dimensional, acellular scaffold of living tissues. Incorporating the ECM into cell culture models is a goal of cell biology studies and requires biocompatible materials that can mimic the ECM. Among such materials are hydrogels: polymeric networks that derive most of their mass from water. With the tuning of their properties, these polymer networks can resemble living tissues. The microarchitectural properties of hydrogels, such as porosity, pore size, fiber length, and surface topology can determine cell plasticity. The adequate characterization of these parameters requires reliable and reproducible methods.
- extracellular matrix
- hydrogel architecture
- topography
- porosity
- electron microscopy
- laser microscopy
- micro-computed tomography
- atomic force microscopy
1. Introduction
The ECM is a three-dimensional (3D), acellular, heterogeneous network composed of fibrillar force-transducing collagens, interconnecting proteins such as fibronectin, matricellular proteins (e.g., periostin, fibulins, osteopontin), and the basement membrane proteins collagen type-IV and laminin [1]. Water retention is accomplished primarily by the highly negatively charged glycosaminoglycans (GAGs) or their higher order structures, i.e., GAGs bound to a protein core (proteoglycans), and to a lesser extent by collagens and similar proteins that also retain water [2]. The water concentration is highly tissue-specific, but it can range from 5% to 90% [3]. The ECM provides structural support and instruction to cells governed by its biophysical and biochemical cues.
Among the materials employed to mimic the ECM are hydrogels: highly porous, interconnected, hydrophilic, 3D polymeric networks that absorb and hold over 20% of their mass in water or other biological fluids [4][5][4,5]. When loaded with cells, hydrogels can provide biophysical conditions similar to those found in the native ECM [6][7][6,7]. For example, cell adhesion is not limited to a single plane, and there is no forced polarity as observed in vivo. Instead, in hydrogels, cell spreading and migration are modulated due to the variable stiffness and viscoelasticity of the material [8][9][8,9]. Hydrogels are formed via physical and chemical crosslinks and are commonly classified based on their polymer sources [4][10][11][4,10,11]. Fibrin [12], collagen [13], and decellularized organ-derived ECM [14][15][16][17][18][14,15,16,17,18] are examples of natural hydrogels and are regarded as biocompatible and bioactive [19]. These materials retain native cell-binding sites as well as protease-targeted degradation motifs, but due to their sources, batch-to-batch variations can influence the hydrogels’ tunability and overall mechanics and microarchitecture [10][19][20][10,19,20]. Synthetic hydrogels, such as polyacrylamide and polyethylene glycol (PEG), are regarded as more tunable than natural hydrogels, as their reconstitution conditions result in fewer batch-to-batch variations. Modifying the polymer backbones and molecular weights of synthetic hydrogels are common approaches to fine-tuning their properties. However, synthetic hydrogels lack inherent fundamental biological cues and require conjugation with cell-binding peptides (e.g., RGD, GFOGER, and IKVAV) to be biocompatible [10][21][22][23][10,21,22,23]. Semi-synthetic hydrogels, such as gelatin methacryloyl (GelMA) [24][25][26][27][24,25,26,27] or methacrylated hyaluronic acid (HAMA) [28][29][28,29], stem from the incorporation of crosslinking sites into the backbone of a natural polymer. These sites grant semi-synthetic hydrogels with a mechanical stability and tunability not commonly achieved in natural hydrogels [30][31][32][30,31,32]. Semi-synthetic hydrogels retain some biocompatible and bioactive features, being derivatives of natural polymers. For a more detailed description of the properties of individual hydrogel polymers, the reader is referred elsewhere [4][19][33][4,19,33]. The wide variety of polymers available for cell culture assays allow researchers to tailor hydrogel-based cell culture models to their research question(s). Within hydrogels, the microarchitecture is an inherent property known to influence the cell fate [34][35][36][34,35,36].
2. Electron-Based Techniques
2.1. Scanning Electron Microscopy
Scanning electron microscopy (SEM) is the most widely reported method for characterizing hydrogel microarchitectures [17][20][37][38][39][40][41][42][43][44][45][46][17,20,38,63,70,71,72,73,74,75,76,77]. This high-resolution imaging tool provides a detailed visualization of the hydrogel surface at the nanometer scale [47][78]. As its name suggests, SEM is an electron-based technique, where a high energy beam (aka “electron gun”) bombards a metal- or carbon-coated specimen with primary electrons, causing the emission of secondary and backscattered electrons. Secondary electrons highlight the morphology and topography of the specimen, while backscattered electrons provide contrast between areas with distinct chemical compositions (Figure 12). SEM imaging occurs under a high vacuum, as the presence of gas can attenuate the electron beams and stop them from scattering [48][79]. SEM microphotographs of hydrogels are employed to determine pore size, pore distribution, and porosity percentage, as well as fiber thickness and fiber orientation [17][37][38][41][42][43][17,38,63,72,73,74]. In cell-loaded hydrogels, the visualization of the cells is also possible [49][50][51][52][53][80,81,82,83,84]. The analytical capabilities of SEM include X-ray-based tools, such as energy dispersive X-Ray spectroscopy (EDX). EDX can detect elements such as C, S, O, N, Na, and others that are present in hydrogels [54][55][56][57][85,86,87,88] and within cells (e.g., P—a marker of DNA) (Figure 23A). EDX is particularly useful for the recognition of cells present within hydrogels of marked structural heterogeneity (Figure 23B). For more in-depth information on the use of EDX in biomedical research and diagnosis, the reader is referred elsewhere [58][89].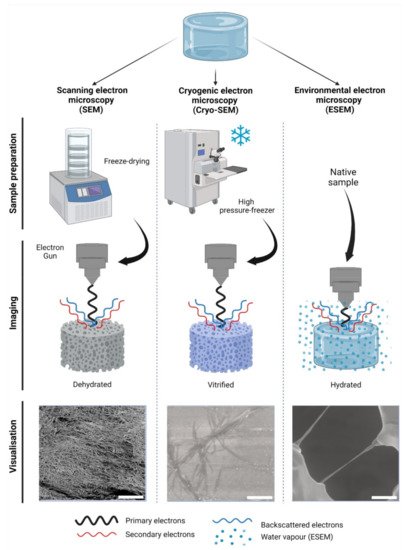
Figure 12. Electron-based imaging techniques for hydrogels. Standard scanning electron microscopy (SEM) relies on sample dehydration, including freeze-drying (shown) after fixation with aldehydes, followed by metal coating. Due to dehydration, the network appears condensed in visualization. In cryogenic SEM (Cryo-SEM), samples are vitrified using—among other methods—a high-pressure freezer (shown). Solid water ice is a source of imaging errors and is seen during imaging. In contrast, environmental SEM (ESEM) does not require a particular sample preparation, as it remains hydrated within a humidified chamber. In ESEM, the electron gun is closer to the specimen than in SEM or Cryo-SEM during imaging. As shown, single collagen fibers can be visualized; however, water condensation can cause imaging artefacts. The visualization of collagen type-I hydrogels (3.0 g/L) is shown at 12,000× magnification, 5 kV, and z = 9 mm. Scale bars represent 5 µm. Collagen type I hydrogels preparation, SEM, Cryo-SEM and ESEM detailed in Appendix A.
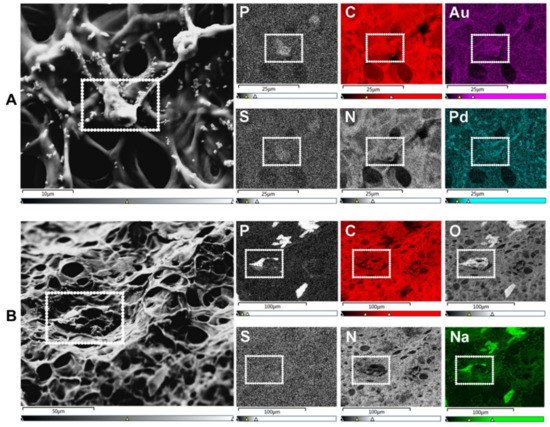
Figure 23. SEM-energy dispersive X-ray spectroscopy (EDX) elemental mapping. Images show human umbilical vein endothelial cells (HUVECs) on the surface of a gelatin methacryloyl (GelMA) hydrogel. (A) SEM allows for the visualization of cells (surrounded by a white dotted rectangle), while EDX identifies the elements present in both cells and hydrogels. These elements include non-metals such as phosphorus (P—a marker of DNA/nuclei), carbon (C), sulfur (S), and nitrogen (N). Transition metals used for coatings, such as gold (Au) and palladium (Pd), are also identified with EDX. Scale bars represent 10 µm and 25 µm. (B) In specimens with marked heterogeneity, EDX facilitates the identification of cells on the hydrogel surface (white dotted rectangle) that otherwise would not be distinguishable due to the condensation of the polymer network. Additional elements relevant to cell biology include non-metals, e.g., oxygen (O), and alkali metals, e.g., sodium (Na). Scale bars represent 50 µm and 100 µm. HUVEC’s culture conditions and GelMA properties detailed in Appendix A.
2.2. Cryogenic Scanning Electron Microscopy
Cryogenic scanning electron microscopy (Cryo-SEM) relies on a standard SEM with a field emission electron gun but employs a cryo-transfer system, where samples can be coated, fractured, and sublimated. In Cryo-SEM, samples must undergo vitrification: an ultra-rapid freezing method that prevents water crystal formation and generates a glass like-specimen [64][94]. The most widely reported method of vitrification in hydrogels is by plunge freezing either in liquid nitrogen, liquid ethane, liquid propane, or nitrogen slush at −137 °C [46][65][66][67][77,95,96,97]. Post-vitrification metal coating is not deemed essential but improves the imaging resolution [65][95]. Specimens can be fractured in order to visualize their inner-most microarchitecture and sublimated to remove the top layer of water, revealing the underlying microarchitecture [68][98]. The fast freezing step preserves biological structures with a higher fidelity than conventional SEM, rendering the Cryo-SEM imaging more factual in order to evaluate the hydrogel pore size [65][95], porosity [69][99], and fiber diameter (Figure 12) [68][69][98,99]. The presence of cells can also be detected [70][71][100,101]. As in SEM, most limitations of Cryo-SEM arise during the sample preparation stage. While, in principle, vitrification prevents ice crystallization, this process depends on a high cooling rate, which is difficult to achieve in specimens with a >10 µm thickness. The use of high-pressure freezing (Figure 12), which consists of a stream of liquid nitrogen at a rate of >2000 bar (~1.5 × 10⁶ Torr) pressure can reportedly vitrify samples of a ≤500 µm thickness at −196 °C [64][94]. A poor cryo-fixation generates hexagonal ice crystals that displace the polymer network, causing structural damage [65][95]. Adding cryoprotectants improves the vitrification process, although the effective concentrations have been reported as cytotoxic upon prolonged exposure [67][97]. It is unclear whether cytotoxicity would cause any real alterations to cell-loaded specimens, as this step is performed immediately before freezing. Sublimation reportedly caused cracks on the surfaces of alginate hydrogels [65][95], and these are likely to occur in other polymer networks as well. Slow freezing rates are also reported, while sample dehydration and architecture distortion are common artefacts [65][66][95,96]. Compared to SEM, fewer studies report on the use of Cryo-SEM for hydrogels. For a detailed guide on hydrogel preparation for Cryo-SEM, the reader is directed elsewhere [65][95].3. Photon-Based Techniques
3.1. Micro-Computed Tomography
Micro-computed tomography (µ-CT) is an X-ray-based scanning imaging tool that generates 2D trans-axial projections of a specimen [72][73][108,109]. While µ-CT is classified in this work as a photon-based technique, X-rays derive from the electron interactions within a high-energy electromagnetic beam [74][110]. In the µ-CT equipment, the sample is placed on a rotational stage and exposed to an X-ray source, and the passing light is captured by an X-ray detector. The passing X-rays can be attenuated (i.e., absorbed or scattered) by the sample thickness, density, and composition, providing phase contrast to the structures and components [75][111]. The µ-CT images can be reconstructed in 3D with an up to 1 μm voxel (3D pixel) resolution, making this a high-resolution technique. As an X-ray-based imaging method, µ-CT has historically been reported as a tool for reconstructing bone microarchitecture [76][77][78][79][112,113,114,115]. Studies on cell-loaded and cell-free hydrogels have used this technique to detect hydrogel mineralization both in vitro and in vivo [80][81][82][83][116,117,118,119]. The µ-CT data can be used to determine the pore size and fiber thickness in order to reconstruct the polymer network in 3D, demonstrating the pore interconnectivity [72][84][102,108]. Hydrogel degradation tests employing µ-CT in vitro demonstrate an increase in the pore sizes and porosity percentages [85][86][87][88][105,120,121,122]. While µ-CT is regarded as both non-destructive and non-invasive, exposure to high current and voltage levels will invariably dehydrate the sample [89][123]. High voltage levels are common when generating high-resolution images, but they are costly and result in a prolonged imaging time. To prevent structural damage during imaging, some reports recommend specimen fixation or the use of (freeze-)dried samples [80][87][116,121]. Thus, it is not uncommon to validate hydrogel µ-CT data using SEM data derived from dry specimens [85][89][90][91][105,123,124,125]. There are other limitations of µ-CT, as the hydrophilic nature of hydrogels provides a low-phase separation contrast (Figure 34) [83][119]. Radiopaque agents can be coupled with the polymer backbone or solubilized and left to soak with the hydrogel to improve said contrast [83][119]. Contrast agents allow reusearchers to discern between the hydrogel fibers and porosity and have been used to investigate hydrogel degradation in vivo and in vitro [92][93][126,127]. Reportedly, osmium tetroxide and uranyl acetate, or a combination of uranyl acetate and lead citrate, enabled a good contrast resolution and 3D reconstruction of collagen-I hydrogels [94][128]. The use of metal nanoparticles (e.g., Au) has also been reported to improve the hydrogel contrast [83][119] or the visualization of the spatial distribution of the cells within. Other limitations include vibrations in the µ-CT’s rotatory stage, which can cause motion artefacts by displacing the sample if it is not properly fixed—a common challenge with wet materials [89][123]. Information on the in-depth specifications and further limitations of µ-CT in materials research can be found elsewhere [75][89][111,123].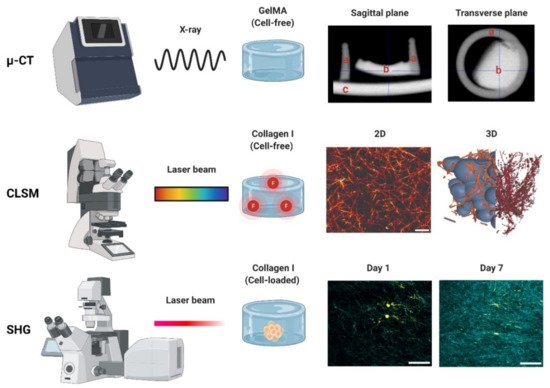
Figure 34. Photon-based imaging techniques. Micro-CT (µ-CT) employs X-rays, creating contrast based on the material properties (e.g., thickness, composition). A GelMA hydrogel scanned with µ-CT is shown in both the sagittal and transverse planes: (a) indicates the PCL container used for casting (2 mm diameter), (b) the GelMA hydrogel, and (c) the stage holder. Confocal laser scanning microscopy (CLSM) employs a laser to excite a fluorophore, which emits the fluorescent signal used for detection. Images of a collagen type-I hydrogel (3 g/L) are shown in 2D and 3D. The 3D image can be used to determine the interconnectivity of the polymer network (orange/red) using a bubble analysis (blue). Scale bars represent 5 µm (2D) and 10 µm (3D). Second harmonic generation (SHG). An example of a cell-loaded (fibroblast) collagen type-I hydrogel is shown on day 1 and day 7. The increase in the SHG signal indicates an increase in the collagen deposition during cell culture. SHG data derived from paraffin-embedded formalin-fixed hydrogels. Scale bars represent 50 µm. µ-CT, CLSM and SHG used to generate the data detailed in Appendix A.
3.2. Confocal Laser Scanning Microscopy
Confocal laser scanning microscopy (CLSM) is a photon-based fluorescent imaging technique. For visualization, CLSM requires that proteins and structures are stained or coupled with fluorophores: organic molecules that can emit light (λem) upon light excitation (λex) [95][129]. The CLSM optical resolution is determined by the wavelength of the laser. This wavelength is chosen according to the absorption spectra of the fluorophores, and multiple lasers can be used at the same time or in succession to capture multi-color fluorescent images [96][130]. Unlike conventional fluorescent microscopes that illuminate the entire specimen, CLSM uses point illumination, typically a laser beam, and a pinhole in front of the detector to eliminate most of the background blur, greatly increasing the optical resolution [97][131]. As only a single point of the specimen is illuminated, the samples must be scanned over a specified region to produce 2D or 3D fluorescent images. CLSM is an invaluable tool used to visualize the structures of living cells within hydrogels [98][132]. For the assessment of the hydrogel microarchitecture, these can be fluorescently dyed [99][58], although certain polymers are naturally auto-fluorescent (e.g., chitosan), allowing dye-free imaging [100][133]. CLSM yields high-resolution 2D and 3D images (Figure 34), revealing the polymer network microarchitecture in great detail, crucial in the determination of the pore size and porosity of hydrogels in their swollen state (Figure 45) [99][101][102][57,58,59]. Overall, CLSM agrees with SEM in regards to the pore size decreasing with increasing polymer concentrations [99][58]. CLSM images can be segmented into a polymer phase and a fluid phase [103][42] (Figure 34, orange). During analysis, spheres can be fitted into the fluid phase (Figure 34, blue), and their diameter is measured to determine the pore diameter. The pore diameter, together with the median values of all the detected pore diameters, is defined as the pore size of a particular sample [103][42]. Applying the same principle to the polymer phase can determine the average thickness of individual fibers (Figure 45A). Additionally, CLSM images can be used to quantify local deviations in the microarchitecture due to nodes formed during the polymerization of collagen-I hydrogels. Moreover, data from fluorescently labelled collagen-I hydrogels showed that fiber diameter and fiber length are heavily influenced by pH, irrespective of the hydrogel concentration. In contrast, the pore size remained unaffected by pH [99][58].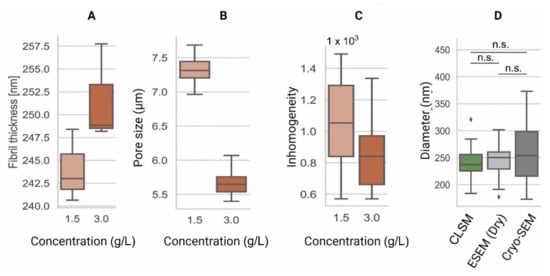
Figure 45. Comparison of the microarchitecture parameters among collagen type-I hydrogels of 1.5 g/L and 3.0 g/L. (A) Fiber thickness is an estimation of the 3D cross-sectional diameter of collagen fibers [104][62]. (B) Pore size represents the contiguous 3D space between collagen fibers [103][42]. (C) Inhomogeneity derived from the CLSM data is a measure of local and global variance in the pore size [101][57]. (D) Comparison of pore diameters among CLSM [103][42], ESEM, and Cryo-SEM images of collagen type-I hydrogels (3.0 g/L). These data indicate similar fiber diameter results among all techniques. Data shown in box-and-whisker plots indicating the median, first and third quartiles as boxes, variability as whiskers and outliers shown as ◆. n.s. = no significant differences.