Oxygen is a unique molecule that possesses a spin quantum number S=1. In the condensed phases of oxygen, the delicate balance between the antiferromagnetic interaction and van der Waals force results in the various phases with different crystal structures. By applying ultrahigh magnetic fields, the antiferromagnetic coupling between O2 molecules breaks, and novel high-field phase (θ phase) appears. Since oxygen is an important element for various (bio-)chemical reactions, the reorientation of O2 molecules could be an attractive mechanism for controlling the reactivity.
- solid oxygen
- liquid oxygen
- high magnetic field
1. Introduction
2. Solid and Liquid Oxygen
2.1. Magnetization
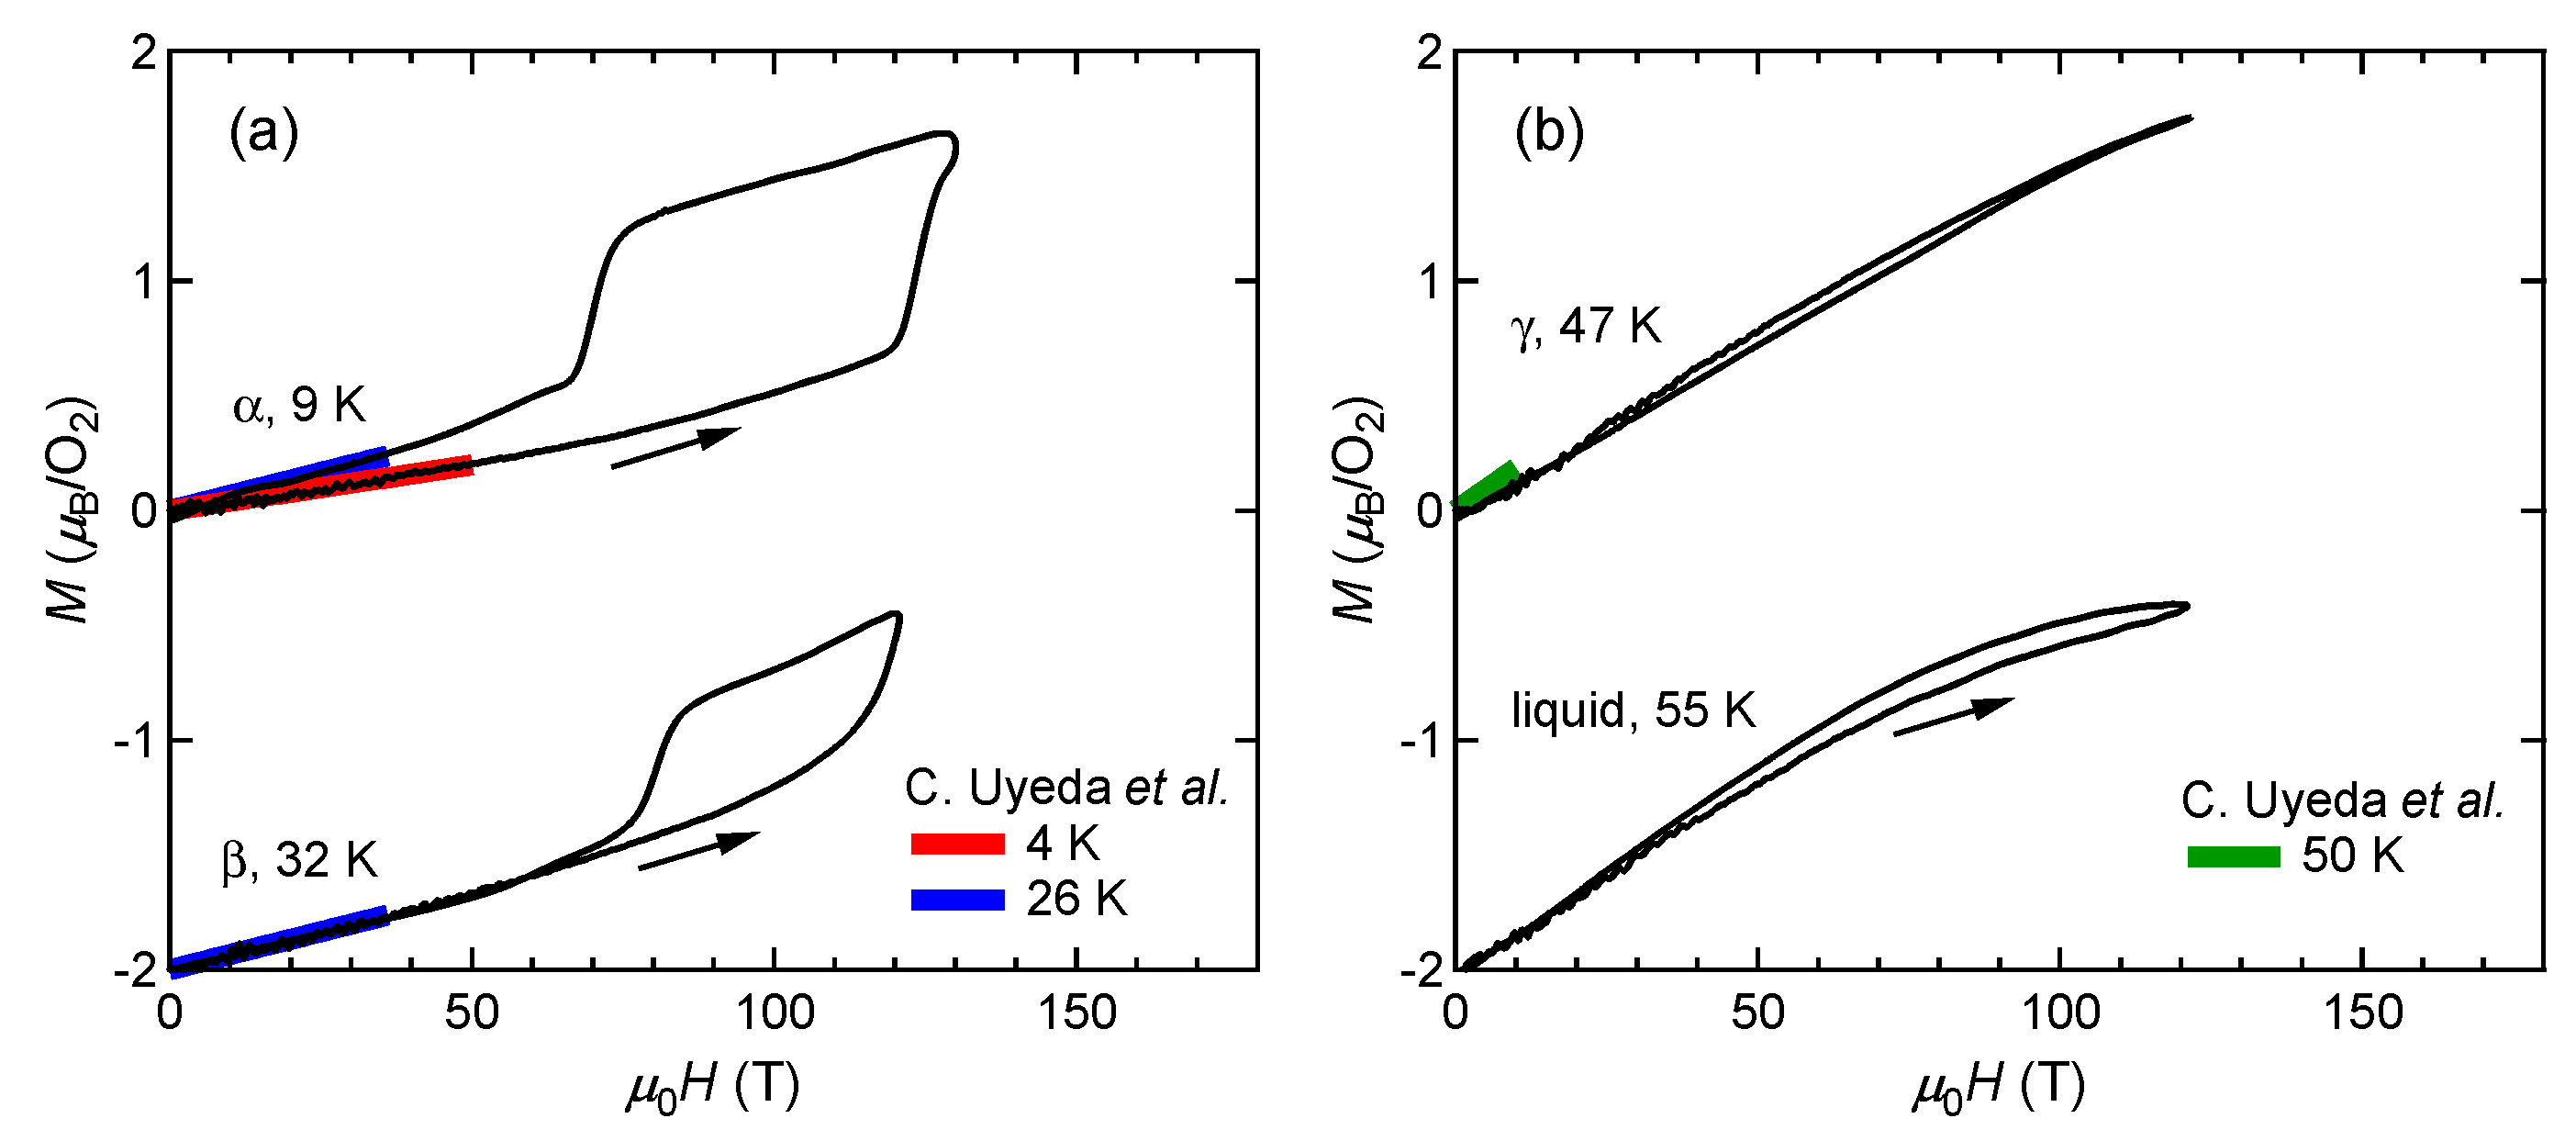
Figure 1 shows the magnetization curves with the initial temperatures of T0=9 K (α phase) and 32 K (β phase). The red and blue lines show the magnetization curves obtained by using a non-destructive magnet [4]. The magnetization linearly increases up to 110 T and suddenly shows a metamagnetic transition at around 120 T. This is a clear sign of a high-field phase of solid oxygen, termed the θ phase. The experimental results show both α-θ and β-θ transitions occur in a similar field range. The magnetization in the field-down sweep shows an anomaly at around 70 T with a large hysteresis loop. The magnetization curve below 70 T follows the slope of the β phase (blue curve), although the initial phase is the α phase (red curve). This probably reflects the temperature increase after the α-θ transition, which causes considerable dissipation as a hysteresis loss [9]. The magnetization of the θ phase depends on the peak value of the magnetic field, which is related to the slow dynamics of the phase transition compared to the magnetic-field duration of ∼6 μs. To reach the saturation value of 2 μB, a longer pulse duration above the transition field (∼100 T) is needed.

Figure 1. Magnetization curves of oxygen. (a) α and β phases. (b) γ and liquid phases. Magnetization curves obtained by using non-destructive magnets are shown for comparison [4]. The results for the β and liquid phases are shifted by −2 for clarity.
2.2. Optical Absorption

2.3. Phase diagram

3. Remaining Issues
3.1. Diffraction Experiment
The proposed crystal structure of the θ phase is based on the indirect experimental observations and the theoretical calculations. To conclude the crystal structure, researchers need to perform diffraction experiments for the θ phase. Thanks to the recent development combining the free-electron X-ray laser and the portable STC system, diffraction experiments around 100 T are becoming accessible [19][20]. In the near future, the direct determination of the crystal structure of the θ phase might become possible.3.2. High-Field Plastic and Liquid Phases
It is proposed the scenario of the field-induced molecular rearrangement of O2 for all the condensed phases of oxygen because their local structure is an H-type configuration with AFM correlation. The only reliable results obtained for liquid oxygen are the ultrasound results at 77 K up to 90 T using a non-destructive magnet [21]. The continuous softening and increasing acoustic attenuation up to 90 T suggest that the local molecular arrangement in liquid oxygen fluctuates under magnetic fields. The observed decrease of sound velocity reaches 8.5% at 90 T, which is quite large compared to other magnetic systems [22]. In addition, the normalized acoustic attenuation coefficient (α/f2) becomes 20 times larger than the zero-field value. Empirically, the value of α/f2=200×10−15 s2/m is extremely large for simple liquids [23]. Since the dissipations due to the viscosity and thermal conductivity cannot explain the observed value, the anomalous acoustic attenuation suggests fluctuations of O2 molecules.References
- Faraday, M. Experimental Researches in Electricity, Vol. 3, Series XXV; Cambridge University Press: Cambridge, UK, 1848.
- Uyeda, C.; Yamagishi, A.; Date, M. Field-Induced Transparency in Liquid Oxygen by High Magnetic Field. J. Phys. Soc. Jpn. 1986, 55, 468–470.
- Uyeda, C.; Yamagishi, A.; Date, M. Liquid Oxygen under High Magnetic Field. J. Phys. Soc. Jpn. 1988, 57, 3954–3960.
- Uyeda, C.; Sugiyama, K.; Date, M. High Field Magnetization of Solid Oxygen. J. Phys. Soc. Jpn. 1985, 54, 1107–1115.
- Meier, R.J.; Schinkel, C.J.; de Visser, A. Magnetisation of condensed oxygen under high pressures and in strong magnetic fields. J. Phys. C: Solid State Phys. 1982, 15, 1015–1024.
- Eremenko, V.V.; Litvinenko, Y.V. Spectrum of Alpha Oxygen in a Strong Magnetic Field. Sov. Phys. JETP 1968, 26, 350–353.
- Kimura, S.; Kindo, K. High field ESR measurements on molecular oxygen. In EPR in the 21st Century; Kawamori, A., Yamauchi, J., Ohta, H., Eds.; Elsevier Science B.V.: Amsterdam, The Netherlands, 2002; pp. 799–802.
- Kimura, S.; Kindo, K.; Narumi, Y.; Hagiwara, M.; Kikuchi, H.; Ajiro, Y. High Field/High Frequency ESR in Osaka University. J. Phys. Soc. Jpn. 2003, 72, 99–108.
- Nomura, T.; Matsuda, Y.H.; Takeyama, S.; Kobayashi, T.C. Irreversible Heating Measurement with Microsecond Pulse Magnet: Example of the α–θ Phase Transition of Solid Oxygen. J. Phys. Soc. Jpn. 2016, 85, 094601.
- Gaididei, Y.B.; Loktev, V.M.; Prikhotko, A.F.; Shanskii, L.I. α-Oxygen doublets. I. Theory. Phys. Status Solidi B 1975, 72, 795–806.
- Gaididei, Y.B.; Loktev, V.M.; Prikhotko, A.F.; Shanskii, L.I. α-Oxygen Doublets II. Experiment. Phys. Status Solidi B 1976, 73, 415–425.
- Litvinenko, Y.G.; Eremenko, V.V.; Garber, T.I. Antiferromagnetic Ordering Effect on the Light Absorption Spectrum by Crystalline Oxygen. Phys. Status Solidi B 1968, 30, 49–60.
- Fujiwara, T. Optical Absorptions in Solid Oxygen. J. Phys. Soc. Jpn. 1974, 36, 1530–1541.
- Nomura, T.; Matsuda, Y.H.; Kobayashi, T.C. H-T phase diagram of solid oxygen. Phys. Rev. B 2017, 96, 054439.
- Cox, D.E.; Samuelsen, E.J.; Beckurts, K.H. Neutron-Diffraction Determination of the Crystal Structure and Magnetic Form Factor of γ-Oxygen. Phys. Rev. B 1973, 7, 3102–3111.
- Meier, R.J.; Helmholdt, R.B. Neutron-diffraction study of α- and β-oxygen. Phys. Rev. B 1984, 29, 1387–1393.
- Kasamatsu, S.; Kato, T.; Sugino, O. First-principles description of van der Waals bonded spin-polarized systems using the vdW-DF+U method: Application to solid oxygen at low pressure. Phys. Rev. B 2017, 95, 235120.
- Manzhelii, V.G.; Freiman, Y.A. Physics of Cryocrystals; American Institute of Physics: New York, NY, USA, 1997.
- Ikeda, A.; Matsuda, Y.H.; Zhou, X.; Yajima, T.; Kubota, Y.; Tono, K.; Yabashi, M. Single shot X-ray diffractometry in SACLA with pulsed magnetic fields up to 16 T. Phys. Rev. Res. 2020, 2, 043175.
- Ikeda, A.; Matsuda, Y.H.; Zhou, X.; Peng, S.; Ishii, Y.; Yajima, T.; Kubota, Y.; Inoue, I.; Inubushi, Y.; Tono, K.; et al. Generating 77 T using a portable pulse magnet for single-shot quantum beam experiments. Appl. Phys. Lett. 2022, 120, 142403.
- Nomura, T.; Ikeda, A.; Gen, M.; Matsuo, A.; Kindo, K.; Kohama, Y.; Matsuda, Y.H.; Zherlitsyn, S.; Wosnitza, J.; Tsuda, H.; et al. Physical properties of liquid oxygen under ultrahigh magnetic fields. Phys. Rev. B 2021, 104, 224423.
- Lüthi, B. Physical Acoustics in the Solid State; Springer: Berlin/Heidelberg, Germany, 2005.
- Bhatia, B. Ultrasonic Absorption: An Introduction to the Theory of Sound Absorption and Dispersion in Gases, Liquids, and Solids; Oxford University Press: New York, NY, USA, 1986.
