In children, vasovagal syncope and postural tachycardia syndrome constitute the major types of orthostatic intolerance. The clinical characteristics of postural tachycardia syndrome and vasovagal syncope are similar but their treatments differ. Therefore, their differential diagnosis is important to guide the correct treatment. Children suffering from vasovagal syncope or postural tachycardia syndrome might be treated using water, β-blockers, salt, or midodrine. However, the effificacy of the drugs varies. Biomarkers or certain hemodynamic parameters that can predict the treatment effects of individualized treatment for POTS or VVS have been used.
- orthostatic intolerance
- vasovagal syncope
- postural tachycardia syndrome
- differential diagnosis
- individualized treatment
1. Introduction
2. Differential Diagnosis of POTS and VVS
Despite their similar clinical manifestations, different methods and strategies are used to treat VVS and POTS. A HUTT can be used to diagnose both but it can be very uncomfortable and in rare cases, it can cause arrhythmias or cardiac arrest. Currently, non-invasive differential diagnosis is an important clinical issue in this field. Therefore, finding a sensitive and reliable method for differential diagnosis between the two diseases has become an urgent clinical need. An investigation of the physiological indicators that differ between VVS and POTS could effectively improve diagnosis, which is of great significance for clinical diagnoses and precise treatments. In this review, firstly, we summarize the physiological indicators used to deferentially diagnose POTS and VVS (Table 1).| Cut-Off | Sensitivity | Specificity | Year |
|---|
2.4. Frequency Domain Indices of Heart Rate Variability (dULF)
HRV (heart rate variability), as a functionality indicator for the autonomic system, exerts an indispensable effect on the VVS pathogenesis. Wang et al. explored the utility of the HRV frequency-associated indicators dULF (daytime ultra-low-frequency), nULF (nighttime ultra-low-frequency), dVLF (daytime very-low-frequency), and nVLF (nighttime very-low-frequency) to differentially diagnose POTS and VVS. In children with VVS, the values of nVLF, dVLF, nULF, and dULF were much higher than in children with POTS, suggesting that VVS is associated with greater sympathetic excitability. Further analysis found that dULF could serve as a physiological marker to make a differential diagnosis between the two disorders as it yields a higher predictive value than the other indicators. Through the dULF value evaluation based on an ROC (receiver operating characteristic) graph, the diagnostic differentiation of VVS from POTS was achieved. Children with clinical symptoms of OI were diagnosed as having VVS if their dULF was > 36.2 ms2, for which the diagnostic sensitivity and specificity were 71.4% and 75.0%, respectively [21].3. Individualized Therapy
It has been assumed that absolute hypovolemia, autonomic neural imbalance, peripheral vascular resistance dysregulation, and hyper-adrenergic responses are involved in OI pathogenesis [4]. Hence, children with VVS or POTS have received salt, water, beta-blockers, or midodrine as treatments. Occasionally, octreotide or pyridostigmine have been used to treat POTS patients, albeit with varying efficacies [22,23,24,25,26]. Considering their different mechanisms and the poor results of current treatments, scientists have sought improvements using individualized treatments. Great improvements were achieved in terms of individualized therapies and before the application of any treatment, biological markers or predictors could provide useful information for doctors to choose a specific treatment regimen. Hence, in the following section, we would like to summarize the recently discovered biological markers or predictors to promote optimal treatment strategies for patients with POTS and VVS. (Table 2) (Figure 1)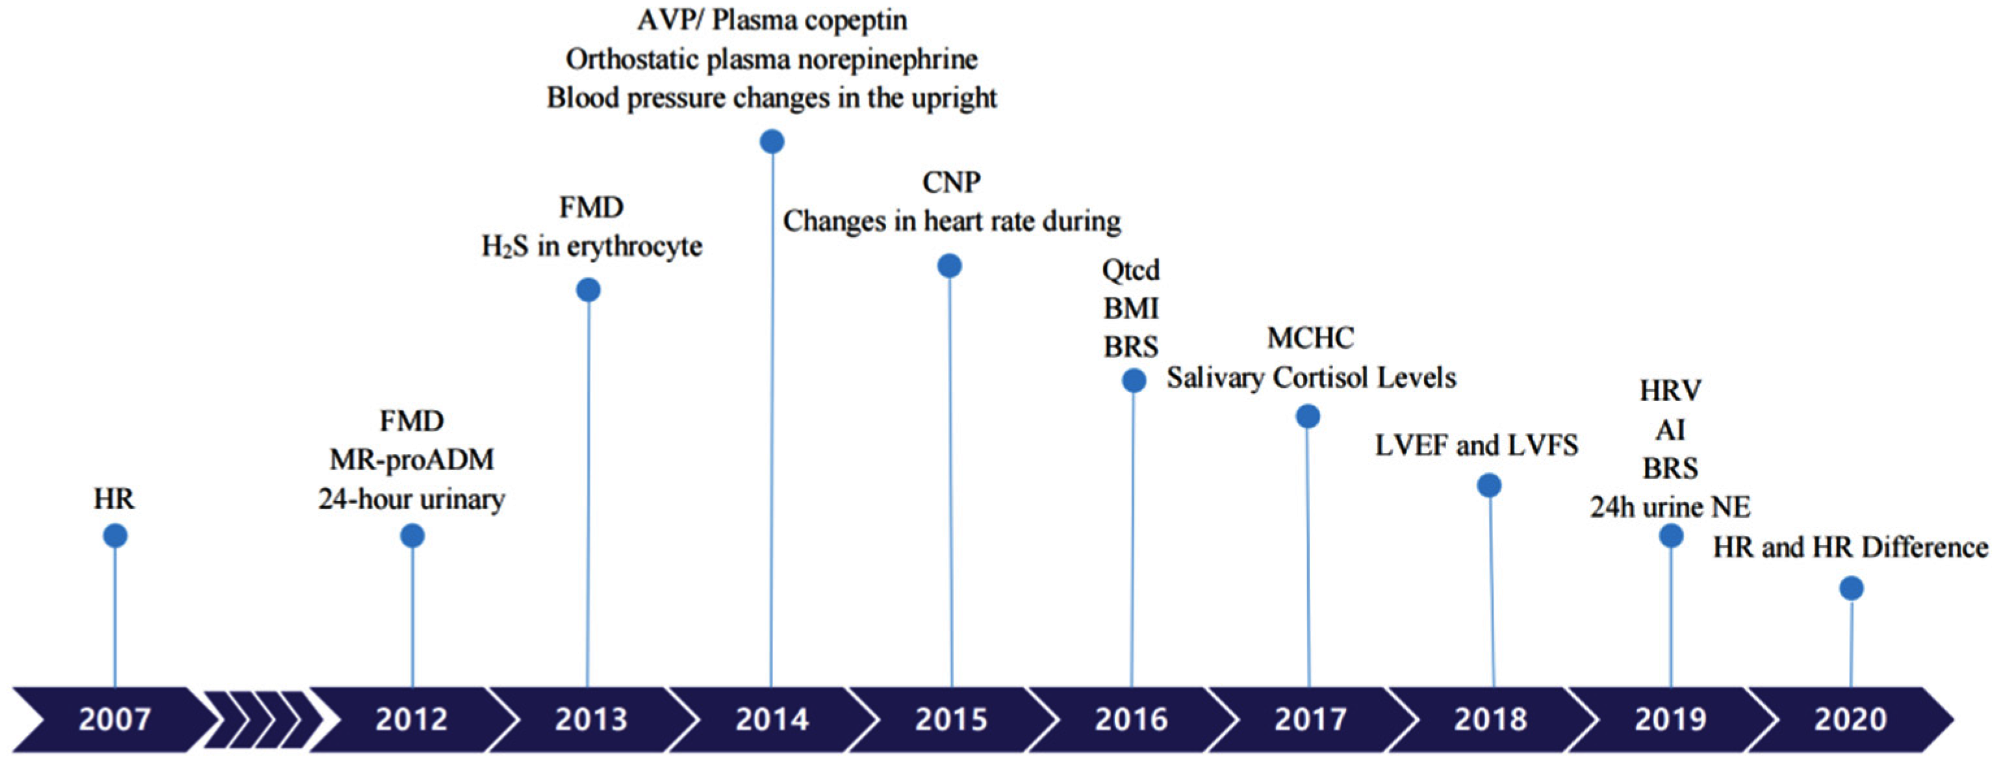 Figure 1. Biomarkers to predict individualized treatment for VVS and POTS in chronological order. POTS: Postural Tachycardia Syndrome; VVS: Vasovagal Syncope; HR: heart rate; FMD: Flow-mediated vasodilation response; MR-proADM: Pro-adrenomedullin; AVP: Arginine vasopressin; CNP: C-type natriuretic peptide; BMI: Body mass index; BRS: Baroreflex sensitivity; MCHC: Mean corpuscular hemoglobin concentration; LVEF: Left ventricular ejection fraction; LVFS: Left ventricular fractional shortening; AI: Acceleration index; HRV: Heart rate variability; 24 h urine NE: 24-h urine norepinephrine.
Table 2. Clinical indicators used to predict individualized treatment of POTS and VVS.
Figure 1. Biomarkers to predict individualized treatment for VVS and POTS in chronological order. POTS: Postural Tachycardia Syndrome; VVS: Vasovagal Syncope; HR: heart rate; FMD: Flow-mediated vasodilation response; MR-proADM: Pro-adrenomedullin; AVP: Arginine vasopressin; CNP: C-type natriuretic peptide; BMI: Body mass index; BRS: Baroreflex sensitivity; MCHC: Mean corpuscular hemoglobin concentration; LVEF: Left ventricular ejection fraction; LVFS: Left ventricular fractional shortening; AI: Acceleration index; HRV: Heart rate variability; 24 h urine NE: 24-h urine norepinephrine.
Table 2. Clinical indicators used to predict individualized treatment of POTS and VVS.
|
Diagnosis |
Treatment |
Biological Markers or Predictors |
Cut-off |
Sensitivity |
Specificity |
Year |
|
|
POTS |
non-pharmacotherapy |
Qtcd [27] |
43.0 msec |
90% |
60% |
2016 |
|
|
|
|||||||
2012 | |||||||
|
|
|
Changes in heart rate during HUTT [30] |
pre-treatment increase in HR = 41 beats/min maximum upright HR in 10 min = 123 beats/min |
84% |
56% |
2015 |
|
|
|
|
BMI [31] |
18.02 |
92% |
82.80% |
2016 |
|
|
|
|
BRS [32] |
17.01 ms/mmHg |
85.70% |
87.50% |
2016 |
|
|
|
|
MCHC [33] |
347.5 g/L |
68.80% |
63.20% |
2017 |
|
|
|
midodrine hydrochloride |
MR-proADM [34] |
61.5 pg/mL |
100% |
|||
| |||||||
metoprolol | |||||||
Orthostatic plasma norepinephrine [39] |
3.59 pg/mL |
76.90% |
91.70% |
2014 |
|||
|
|
|
AVP/Plasma copeptin [40] |
10.225 pmol/L |
90.50% |
78.60% |
2014 |
|
|
|
|
CNP [41] |
32.55 pg/mL |
95.80% |
70% |
2015 |
|
|
|
|
HRV [42] |
TR index ≤ 33.7; SDNN index ≤ 79.0ms |
85.3%, |
81.80% |
2019 |
|
|
|
|
HR and HR Difference [43] |
HR 5 ≥ 110 beats/min |
82.50% |
69.23% |
2020 |
|
|
|
|
HR 10 ≥ 112 beats/min |
84.62% |
69.70% |
|||
|
|
|
HR difference 5 ≥ 34 beats/min |
85.29% |
89.47% |
|||
|
|
|
HR difference 10 ≥ 37 beats/min |
97.56% |
64.86% |
|||
|
VVS |
orthostatic training |
AI [44] |
26.77 |
85.00% |
69.20% |
2019 |
|
|
|
midodrine hydrochloride |
FMD [45] |
8.85% |
90% |
80% |
2012 |
|
|
|
metoprolol |
HR [46] |
increase of 30 beats/min |
81% |
80% |
2007 |
|
| Plasma H2S level | 98 μmol/L | 90% | 80% | 2012 | |||
| Serum iron level | 11.8 μmol/L, | 92.50% | 64.70% | 2013 | |||
| AI and 30/15 | AI: 28.180; 30/15: 1.025 |
95.80% | 80.80% | 2018 | |||
| dULF | 36.2 ms2 | 71.40% | 75.00% | 2019 | |||
2.1. The Plasma Hydrogen Sulfide (H2S) Level
The toxic gas hydrogen sulfide (H2S) was recognized recently as an endogenous gasotransmitter [10]. H2S contributes to endothelium-dependent vasorelaxation and exerts regulatory effects on the pathogenesis of various diseases [11]. According to Zhang et al., the plasma concentration of H2S can help distinguish between POTS and VVS in children. The results of that study indicated that children with POTS and VVS had higher H2S plasma levels than healthy children. A plasma level of H2S at 98 μmol/L taken as the cutoff value produced both high sensitivity (90%) and specificity (80%) rates for correctly discriminating between patients with VVS and patients with POTS [12].2.2. The Serum Iron Level
Generally, VVS is rare or sporadic, whereas POTS represents a chronic daily form of OI. However, VVS patients sometimes experience chronic OI symptoms and POTS patients might experience a temporary or sudden loss of consciousness. Hence, based on symptoms alone, the differential diagnosis of VVS from POTS is often difficult. Patients with POTS or VVS have a high prevalence of chronic fatigue. Iron deficiency was proven to be associated with chronic fatigue in patients with OI [13,14]. Interestingly, the symptoms of OI could be relieved using iron supplementation or the administration of recombinant erythropoietin [15,16]. Thus, the mechanisms were probably linked to the oxygen-carrying capacity of hemoglobin and the serum iron levels might be different between POTS and VVS. According to a study by Li et al., the serum iron level was higher among POTS children than among children with VVS (with significant differences in their median values), which could be used as a preliminary method to differentiate POTS from VVS in a clinic. When the value of serum iron was 11.8 μmol/L, VVS could be distinguished from POTS with 92.5% sensitivity and 64.7% specificity [17].2.3. Immediate Heart Rate Alteration Index AI and 30/15
The instantaneous HR (heart rate) variation from the supine position to standing can be represented by the 30/15 ratio and the AI (acceleration index). The AI is calculated using the following equation: AI = ((A − B)/A) × 100, where A is the average duration of the R-R interval during the 15 s prior to the position change, and B denotes the initial shortest R-R interval following the position change [18]. The length of the R-R interval for the 30th beat as a percentage of that for the 15th beat in the upright position is 30/15 [19]. Both ratios are associated with cardiovascular and autonomic nervous functions. Tao et al. investigated using the value of AI and 30/15 to differentially diagnose VVS and POTS. Compared with children with VVS, the AI was prominently higher in POTS children and the 30/15 was lower. Thus, both ratios might be useful to differentially diagnose VVS and POTS. For AI, using a cut-off value of 28.180 resulted in 79.2% sensitivity and 73.1% specificity. The adoption of a 1.025 threshold for 30/15 resulted in 87.5% sensitivity and 61.5% specificity. Using both ratios jointly, the sensitivity was elevated to 95.8% and the specificity to 80.8% for diagnosis [20].
| |||||||
Salivary cortisol levels [28] |
4.1 ng/mL |
83.30% |
68.70% |
2017 |
|||
|
|
ORS |
24-h urinary sodium [29] |
124 mmol/24 h |
76.90% |
93% | ||
71.60% | |||||||
2012 | |||||||
|
|
|
FMD [35] |
9.85% |
1-month |
76.9% |
93% |
2013 |
|
3-month |
71.6% |
80% |
|||||
|
|
|
H2S in erythrocyte [36] |
27.1 nmol/min/108 |
78.90% |
77.80% |
2013 |
|
|
|
|
Blood pressure changes in the upright position [37] |
SBP ≤ 0 mmHg; DBP ≤ 6.5 mmHg |
72% |
88% |
2014 |
|
|
|
|
AVP/Plasma copeptin [38] |
10.482 pmol/L |
81.30% |
76.50% |
2014 |
|
| |||||||
| |||||||
LVEF and LVFS [ | ] |
two month |
LVEF > 70.5% |
80.00% |
100.00% |
2018 |
|
|
|
|
|
LVFS > 38.5% |
90.00% |
90.00% |
||
|
|
|
six month |
LVEF > 70.5% |
81.30% |
88.90% |
||
|
|
|
|
LVFS > 37.5% |
93.80% |
66.70% |
||
|
|
|
BRS [48] |
10 ms/mmHg |
82% |
83% |
2019 |
|
|
|
|
24 h urine NE [49] |
34.84 μg/24h |
70% |
100% |
2019 |
|
3.1. Individualized Therapy for POTS
3.1.1. Physiological Indicators Predicting the Efficacy of Non-Pharmacotherapy Treatment in Children with POTS
Symptoms of POTS patients have been reported to be ameliorated by a short-period regular program of progressive physical activities [50]. These treatments include physical movement, exercise designed to enhance physical fitness, and sleep–wake loop rectification. Physical motion, such as stamping, leg crossing, and slow standing with a bowed head, help prevent the flow of blood into the lower body parts and sustain cerebral circulation during an upright posture [51,52]. Muscle weakness can be prevented and sympathetic activity increased by moderate physical training. Acting as a blood pump, leg muscles make an important contribution to improving cardiac venous return and enhancing heart output [53]. The sleep–wake pattern of children with POTS is usually disrupted, which is related to the disruption of the circadian rhythm of parasympathetic and sympathetic activation. Certain patients have very different circulatory reactions to standing in the morning and evening [54], hence, identifying patients who will respond to nonpharmacotherapy treatments requires further research.- Pro-adrenomedullin (MR-proADM)
- ,
- 174
- , 1349–1356. [
- Google Scholar
- ] [
- CrossRef
- ] [
- PubMed
- ]
- Lu, W.; Yan, H.; Wu, S.; Chen, S.; Xu, W.; Jin, H.; Du, J. Electrocardiography-Derived Predictors for Therapeutic Response to Treatment in Children with Postural Tachycardia Syndrome.
- J. Pediatr.
- 2016
- ,
- 176
- , 128–133. [
- Google Scholar
- ] [
- CrossRef
- ]
- Lin, J.; Zhao, H.; Shen, J.; Jiao, F. Salivary Cortisol Levels Predict Therapeutic Response to a Sleep-Promoting Method in Children with Postural Tachycardia Syndrome.
- J. Pediatr.
- 2017
- ,
- 191
- , 91–95. [
- Google Scholar] [CrossRef]
- Zhang, Q.; Liao, Y.; Tang, C.; Du, J.; Jin, H. Twenty-four-hour urinary sodium excretion and postural orthostatic tachycardia syndrome. J. Pediatr. 2012, 161, 281–284. [Google Scholar] [CrossRef] [PubMed]
- Lin, J.; Liu, P.; Wang, Y.; Li, H.; Li, X.; Zhao, J.; Tang, C.; Du, J.; Jin, H. Evaluation of the changes in heart rate during head-up test predicting the efficacy of oral rehydration salts on postural tachycardia syndrome in children. Zhonghua Er Ke Za Zhi 2015, 53, 25–29. [Google Scholar]
- Li, H.; Wang, Y.; Liu, P.; Chen, Y.; Feng, X.; Tang, C.; Du, J.; Jin, H. Body Mass Index (BMI) is Associated with the Therapeutic Response to Oral Rehydration Solution in Children with Postural Tachycardia Syndrome. Pediatr. Cardiol. 2016, 37, 1313–1318. [Google Scholar] [CrossRef] [PubMed]
- Li, H.; Liao, Y.; Wang, Y.; Liu, P.; Sun, C.; Chen, Y.; Tang, C.; Jin, H.; Du, J. Baroreflex Sensitivity Predicts Short-Term Outcome of Postural Tachycardia Syndrome in Children. PLoS ONE 2016, 11, e0167525. [Google Scholar] [CrossRef] [PubMed]
- Lu, W.; Yan, H.; Wu, S.; Xu, W.; Jin, H.; Du, J. Hemocytometric Measures Predict the Efficacy of Oral Rehydration for Children with Postural Tachycardia Syndrome. J. Pediatr. 2017, 187, 220–224. [Google Scholar] [CrossRef]
- Zhang, F.; Li, X.; Ochs, T.; Chen, L.; Liao, Y.; Tang, C.; Jin, H.; Du, J. Midregional pro-adrenomedullin as a predictor for therapeutic response to midodrine hydrochloride in children with postural orthostatic tachycardia syndrome. J. Am. Coll. Cardiol. 2012, 60, 315–320. [Google Scholar] [CrossRef] [PubMed]
- Liao, Y.; Yang, J.; Zhang, F.; Chen, S.; Liu, X.; Zhang, Q.; Ai, Y.; Wang, Y.; Tang, C.; Du, J.; et al. Flow-mediated vasodilation as a predictor of therapeutic response to midodrine hydrochloride in children with postural orthostatic tachycardia syndrome. Am. J. Cardiol. 2013
-
HR-corrected QT interval dispersion (QTcd)
-
Salivary cortisol levels
3.1.2. Physiological Predictors for the Oral Rehydration Salts Efficacy in Pediatric POTS
Although POTS involves heterogeneous mechanisms, its effects are similar to that of known forms of hypovolemia and involve reductions in cardiac output and systemic venous return [58,59]. In patients with POTS, the redistribution of the blood volume decreases the central blood volume; however, the total blood volume does not change, resulting in tachycardia, vagal withdrawal, and reflex sympathetic excitation [60]. Therefore, in patients with POTS, an intravenous saline or oral rehydration solution (ORS) could prevent syncope and improve OI and result in changes in the HR. However, the efficacy of salt replenishment was observed only in some POTS patients [61,62]; therefore, a worthwhile research topic would be a method for identifying responders to this therapy.- ,
- 112
- , 816–820. [
- Google Scholar
- ] [
- CrossRef
- ]
-
24 h urinary sodium
-
Changes in heart rate during head-up tilt test (HUTT).
- Yang, J.; Zhao, J.; Du, S.; Liu, D.; Fu, C.; Li, X.; Chen, S.; Tang, C.; Du, J.; Jin, H. Postural orthostatic tachycardia syndrome with increased erythrocytic hydrogen sulfide and response to midodrine hydrochloride.
- J. Pediatr.
- 2013
-
Body mass index (BMI)
- ,
- 163
- , 1169–1173. [
- Google Scholar
-
Baroreflex sensitivity (BRS)
-
Mean corpuscular hemoglobin concentration (MCHC)
3.1.3. Physiological Predictors for the Midodrine Hydrochloride Efficacy among POTS Children
A crucial factor in pathophysiological POTS development is abnormal peripheral vascular constriction. Accordingly, in recent years, the application of peripheral vasoconstrictive medications has been put forward as a way of syncope relapse prevention for POTS patients. An alpha-1 adrenoreceptor agonist called midodrine hydrochloride can narrow the vascular lumen through peripheral blood pressure elevation and its efficacy in the treatment of POTS has been confirmed [73]. However, treatment using midodrine hydrochloride resulted in a response rate of only around 70% [24]. Therefore, a pre-treatment prediction of midodrine hydrochloride’s therapeutic effect on POTS would be clinically important to improve therapeutic effectiveness.- ]
- Deng, W.; Liu, Y.; Liu, A.D.; Holmberg, L.; Ochs, T.; Li, X.; Yang, J.; Tang, C.; Du, J.; Jin, H. Difference between supine and upright blood pressure associates to the efficacy of midodrine on postural orthostatic tachycardia syndrome (POTS) in children.
- Pediatr. Cardiol.
- 2014
- ,
- 35
- , 719–725. [
- Google Scholar
- ] [
- CrossRef
- ]
- Zhao, J.; Tang, C.; Jin, H.; Du, J. Plasma copeptin and therapeutic effectiveness of midodrine hydrochloride on postural tachycardia syndrome in children.
- J. Pediatr.
-
Flow-mediated vasodilation response (FMD)
- 2014
- ,
- 165
- , 290–294. [
- Google Scholar
- ] [
- CrossRef
- ]
- Zhang, Q.; Chen, X.; Li, J.; Du, J. Orthostatic plasma norepinephrine level as a predictor for therapeutic response to metoprolol in children with postural tachycardia syndrome.
- J. Transl. Med.
- 2014
- ,
- 12
- , 249. [
- Google Scholar
- ] [
- CrossRef
- ]
- Zhao, J.; Du, S.; Yang, J.; Lin, J.; Tang, C.; Du, J.; Jin, H. Usefulness of plasma copeptin as a biomarker to predict the therapeutic effectiveness of metoprolol for postural tachycardia syndrome in children.
- Am. J. Cardiol.
- 2014
- ,
- 114
- , 601–605. [
- Google Scholar
- ] [
- CrossRef
- ]
- Lin, J.; Han, Z.; Li, H.; Chen, S.; Li, X.; Liu, P.; Wang, Y.; Tang, C.; Du, J.; Jin, H. Plasma C-type natriuretic peptide as a predictor for therapeutic response to metoprolol in children with postural tachycardia syndrome.
- PLoS ONE
- 2015
- ,
- 10
- , e0121913. [
- Google Scholar
- ] [
- CrossRef] [PubMed]
- Wang, Y.; Zhang, C.; Chen, S.; Liu, P.; Wang, Y.; Tang, C.; Jin, H.; Du, J. Heart Rate Variability Predicts Therapeutic Response to Metoprolol in Children With Postural Tachycardia Syndrome. Front. Neurosci. 2019, 13, 1214. [Google Scholar] [CrossRef]
- Wang, S.; Zou, R.; Cai, H.; Wang, Y.; Ding, Y.; Tan, C.; Yang, M.; Li, F.; Wang, C. Heart Rate and Heart Rate Difference Predicted the Efficacy of Metoprolol on Postural Tachycardia Syndrome in Children and Adolescents. J. Pediatr. 2020, 224, 110–114. [Google Scholar] [CrossRef] [PubMed]
- Tao, C.; Li, X.; Tang, C.; Jin, H.; Du, J. Acceleration Index Predicts Efficacy of Orthostatic Training on Vasovagal Syncope in Children. J. Pediatr. 2019, 207, 54–58. [Google Scholar] [CrossRef] [PubMed]
- Zhang, F.; Liao, Y.; Li, X.; Chen, L.; Jin, H.; Du, J. The predictive value of flow-mediated vasodilation on therapeutic efficacy of midodrine hydrochloride for vasovagal syncope in children. Zhongguo Shi Yong Er Ke Za Zhi 2012, 27, 102–105. [Google Scholar]
- Zhang, Q.; JB, D.; Zhen, J.; Li, W.; Wang, Y. Hemodynamic changes during head-up tilt test and predictive value thereof in predicting the efficacy of metoprolol therapy in children with vasovagal syncope. Zhonghua Yi Xue Za Zhi 2007, 87, 1260–1262. [Google Scholar]
- Song, J.; Li, H.; Wang, Y.; Liu, P.; Li, X.; Tang, C.; Jin, H.; Du, J. Left Ventricular Ejection Fraction and Fractional Shortening are Useful for the Prediction of the Therapeutic Response to Metoprolol in Children with Vasovagal Syncope. Pediatr. Cardiol. 2018, 39, 1366–1372. [Google Scholar] [CrossRef]
- Tao, C.; Li, X.; Tang, C.; Jin, H.; Du, J. Baroreflex Sensitivity Predicts Response to Metoprolol in Children With Vasovagal Syncope: A Pilot Study. Front. Neurosci. 2019, 13, 1329. [Google Scholar] [CrossRef] [PubMed]
- Kong, Q.; Yang, X.; Cai, Z.; Pan, Y.; Wang, M.; Liu, M.; Zhao, C. Twenty-four-hour urine NE level as a predictor of the therapeutic response to metoprolol in children with recurrent vasovagal syncope. Ir. J. Med. Sci. 2019, 188, 1279–1287. [Google Scholar] [CrossRef
-
Hydrogen sulfide in erythrocyte (H2S)
- ]
- George, S.A.; Bivens, T.B.; Howden, E.J.; Saleem, Y.; Galbreath, M.M.; Hendrickson, D.; Fu, Q.; Levine, B.D. The international POTS registry: Evaluating the efficacy of an exercise training intervention in a community setting.
- Heart Rhythm
- 2016
- ,
- 13
- , 943–950. [
- Google Scholar
- ] [
- CrossRef
- ]
- van Lieshout, J.J.; ten Harkel, A.D.; Wieling, W. Physical manoeuvres for combating orthostatic dizziness in autonomic failure.
- Lancet
- 1992
- ,
- 339
- , 897–898. [
- Google Scholar
- ] [
- CrossRef
- ]
- Krediet, C.T.; van Lieshout, J.J.; Bogert, L.W.; Immink, R.V.; Kim, Y.S.; Wieling, W. Leg crossing improves orthostatic tolerance in healthy subjects: A placebo-controlled crossover study.
- Am. J. Physiol. Heart Circ. Physiol.
- 2006
- ,
- 291
- , H1768–H1772. [
- Google Scholar
- ] [
- CrossRef
- ]
- Stewart, J.M.; Medow, M.S.; Montgomery, L.D.; McLeod, K. Decreased skeletal muscle pump activity in patients with postural tachycardia syndrome and low peripheral blood flow.
- Am. J. Physiol. Heart Circ. Physiol.
- 2004
- ,
- 286
- , H1216–H1222. [
- Google Scholar
- ] [
- CrossRef
- ] [
- PubMed
- ]
- Sato, Y.; Ichihashi, K.; Kikuchi, Y.; Shiraishi, H.; Momoi, M.Y. Autonomic function in adolescents with orthostatic dysregulation measured by heart rate variability.
- Hypertens. Res.
- 2007
- ,
- 30
- , 601–605. [Google Scholar] [CrossRef] [PubMed]
- Shenthar, J.; Gangwar, R.S.; Banavalikar, B.; Benditt, D.G.; Lakkireddy, D.; Padmanabhan, D. A randomized study of yoga therapy for the prevention of recurrent reflex vasovagal syncope. Europace 2021, 23, 1479–1486. [Google Scholar] [CrossRef]
- Miglis, M.G.; Muppidi, S.; Feakins, C.; Fong, L.; Prieto, T.; Jaradeh, S. Sleep disorders in patients with postural tachycardia syndrome. Clin. Auton. Res. 2016, 26, 67–73. [Google Scholar] [CrossRef]
- Lin, J.; Han, Z.; Li, X.; Ochs, T.; Zhao, J.; Zhang, X.; Yang, J.; Liu, P.; Xiong, Z.; Gai, Y.; et al. Risk factors for postural tachycardia syndrome in children and adolescents. PLoS ONE 2014, 9, e113625. [Google Scholar] [CrossRef] [PubMed]
- Fu, Q.; Shibata, S.; Hastings, J.L.; Prasad, A.; Palmer, M.D.; Levine, B.D. Evidence for unloading arterial baroreceptors during low levels of lower body negative pressure in humans. Am. J. Physiol. Heart Circ. Physiol. 2009, 296, H480–H488. [Google Scholar] [CrossRef]
- Fu, Q.; VanGundy, T.B.; Galbreath, M.M.; Shibata, S.; Jain, M.; Hastings, J.L.; Bhella, P.S.; Levine, B.D. Cardiac origins of the postural orthostatic tachycardia syndrome. J. Am. Coll. Cardiol. 2010, 55, 2858–2868. [Google Scholar] [CrossRef]
- Stewart, J.M.; Taneja, I.; Medow, M.S. Reduced central blood volume and cardiac output and increased vascular resistance during static handgrip exercise in postural tachycardia syndrome. Am. J. Physiol. Heart Circ. Physiol. 2007, 293, H1908–H1917. [Google Scholar] [CrossRef]
- Lu, C.-C.; Diedrich, A.; Tung, C.-S.; Paranjape, S.; Harris, P.A.; Byrne, D.W.; Jordan, J.; Robertson, D. Water ingestion as prophylaxis against syncope. Circulation 2003, 108, 2660–2665. [Google Scholar] [CrossRef] [PubMed]
- Mathias, C.J.; Young, T.M. Water drinking in the management of orthostatic intolerance due to orthostatic hypotension, vasovagal syncope and the postural tachycardia syndrome. Eur. J. Neurol. 2004, 11, 613–619. [Google Scholar] [CrossRef]
- Chen, G.; Du, J.; Jin, H.; Huang, Y. Postural Tachycardia Syndrome in Children and Adolescents: Pathophysiology and Clinical Management. Front. Pediatr. 2020, 8, 474. [Google Scholar] [CrossRef] [PubMed]
- Stewart, J.M.; Boris, J.R.; Chelimsky, G.; Fischer, P.R.; Fortunato, J.E.; Grubb, B.P.; Heyer, G.L.; Jarjour, I.T.; Medow, M.S.; Numan, M.T.; et al. Pediatric Disorders of Orthostatic Intolerance. Pediatrics 2018, 141, e20171673. [Google Scholar] [CrossRef]
- Stewart, J.M. A new guideline for diagnosis and treatment of syncope in children and adolescents that stimulates further thought and discussion. Sci. Bull. 2018, 63, 1527–1528. [Google Scholar] [CrossRef]
- Antonini-Canterin, F.; Di Nora, C.; Poli, S.; Sparacino, L.; Cosei, I.; Ravasel, A.; Popescu, A.C.; Popescu, B.A. Obesity, Cardiac Remodeling, and Metabolic Profile: Validation of a New Simple Index beyond Body Mass Index. J. Cardiovasc. Echogr. 2018, 28, 18–25. [Google Scholar] [CrossRef]
- Bunsawat, K.; Lefferts, E.C.; Grigoriadis, G.; Wee, S.O.; Kilianek, M.M.; Fadel, P.J.; Clifford, P.S.; Fernhall, B.; Baynard, T. Central and Peripheral Postexercise Blood Pressure and Vascular Responses in Young Adults with Obesity. Med. Sci. Sports Exerc. 2021, 53, 994–1002. [Google Scholar] [CrossRef] [PubMed]
- Stewart, J.M.; Taneja, I.; Medow, M.S. Reduced body mass index is associated with increased angiotensin II in young women with postural tachycardia syndrome. Clin. Sci. 2007, 113, 449–457. [Google Scholar] [CrossRef] [PubMed]
- Mustafa, H.I.; Raj, S.R.; Diedrich, A.; Black, B.K.; Paranjape, S.Y.; Dupont, W.D.; Williams, G.H.; Biaggioni, I.; Robertson, D. Altered systemic hemodynamic and baroreflex response to angiotensin II in postural tachycardia syndrome. Circ. Arrhythm. Electrophysiol. 2012, 5, 173–180. [Google Scholar] [CrossRef]
- Raj, S.R. Postural tachycardia syndrome (POTS). Circulation 2013, 127, 2336–2342. [Google Scholar] [CrossRef]
- Harrington, F.; Murray, A.; Ford, G.A. Relationship of baroreflex sensitivity and blood pressure in an older population. J. Hypertens. 2000, 18, 1629–1633. [Google Scholar] [CrossRef] [PubMed]
- Lin, C.J.; Chu, Y.K.; Chern, C.M. RBC volume deficiency in patients with excessive orthostatic decrease in cerebral blood flow velocity. J. Chin. Med. Assoc. 2014, 77
-
Blood pressure changes in the upright position
References
- Du, J.; Zhang, Q. Research progress in orthostatic intolerance in children. Zhongguo Shi Yong Er Ke Za Zhi 2010, 25, 241–244. [Google Scholar
-
Arginine vasopressin (AVP)/Plasma copeptin
3.1.4. Physiological Predictors for the Efficacy of Metoprolol in Pediatric POTS
Beta-adrenoceptor blockers are often applied in the management of pediatric POTS patients. They inhibit sympathetic nervous system activity and reduce stimulation of the heart rate and cardiac baroreceptors, thereby blocking the effects of increased blood catecholamine levels. However, only some children’s symptoms are improved using β-blockers [23,80,81]. In addition, β-blockers might affect children’s exercise tolerance [82]. Therefore, to improve therapeutic effectiveness, it is important and clinically significant to predict the efficacy of metoprolol, a β-blocker, before the treatment of POTS.- ]
- Duan, H.; Zhou, K.; Wang, C.; Hua, Y. Analysis of clinical features and related factor of syncope and head-up tilt test results in children. Zhonghua Er Ke Za Zhi 2016, 54, 269–272. [Google Scholar] [CrossRef
- ,
-
Orthostatic plasma norepinephrine
- ]
- Vernino, S.; Stiles, L.E. Autoimmunity in postural orthostatic tachycardia syndrome: Current understanding.
- Auton. Neurosci. 2018, 215
- 30
-
AVP/Plasma copeptin
- , 174–178. [
- Google Scholar
- ] [
- CrossRef
-
Plasma C-type natriuretic peptide (CNP)
-
Heart rate variability (HRV)
-
Heart Rate (HR) and Heart Rate Difference
3.2. VVS Individualized Therapy
3.2.1. Physiological Predictors for the Orthostatic Exercise Efficacy in Pediatric VVS
The possible mechanisms of VVS include genetic factors, an abnormal Bezold–Jarisch reflex, vasomotor dysfunction, and autonomic nervous dysfunction [87,88]. Therefore, improving autonomic nervous function via orthostatic training is believed to be a treatment option in pediatric VVS. During orthostatic training, the patient stands against a wall with their feet placed 15 cm from the edge of the wall without moving. The duration of standing is increased gradually from 3 to 30 min according to the patient’s standing tolerance [27,89]. To enhance the effectiveness of orthostatic training in pediatric VVS, it is important to identify those patients with VVS in whom autonomic dysfunction might be the primary mechanism because these patients tend to respond positively to orthostatic exercise.-
The Acceleration index (AI)
3.2.2. Physiological Indicators to Predict the Efficacy of a1-Adrenergic Receptor Agonists in Pediatric VVS
The selective alpha-adrenergic receptor agonist midodrine has peripheral action that increases peripheral vascular resistance and reduces venous pooling [91]. Vasodilation has a primary role in the pathogenesis of VVS; therefore, peripheral alpha-agonists were believed to decrease susceptibility to VVS. In addition, midodrine does not penetrate the blood–brain barrier, resulting in no CNS side effects. Midodrine is an approved agent for orthostatic hypotension management in the United States [92]. The beneficial effects of midodrine have been confirmed in a series of studies on adult VVS; however, most of these studies were not randomized, double-blind, or placebo-controlled studies [93,94].- , 78–82. [
- Google Scholar
- ] [CrossRef]
-
Flow-mediated vasodilation (FMD)
3.2.3. Physiological Indicators to Predict β-Blocker Efficacy in Pediatric VVS
β-blockers have been used for many years as a treatment for VVS. The proposed mechanism involves a decrease in left ventricular mechanoreceptor activation, which is regarded as a sympathetic tone reduction and serum adrenaline elevation before syncope [96]. Several uncontrolled studies reported that β-blockers were effective; however, in five of seven controlled studies, they were not beneficial [97,98,99,100,101,102,103]. Chen, et al. demonstrated that 60.61% of children with VVS treated using oral metoprolol were cured, whereas a Russian study reported an overall efficacy of only 44% after atenolol treatment [104,105]. These results suggested the probable validity of β-blockers for some particular VVS patients and it is necessary to predict the response to β-blockers so that their reasonable application can be justified.- Freeman, R.; Wieling, W.; Axelrod, F.B.; Benditt, D.G.; Benarroch, E.; Biaggioni, I.; Cheshire, W.; Chelimsky, T.C.; Cortelli, P.; Gibbons, C.H.; et al. Consensus statement on the definition of orthostatic hypotension, neurally mediated syncope and the postural tachycardia syndrome.
- Clin. Auton. Res.
- 2011, 21, 69–72. [Google Scholar] [CrossRef]
- Benarroch, E.E. Postural tachycardia syndrome: A heterogeneous and multifactorial disorder. Mayo Clin. Proc. 2012, 87, 1214–1225. [Google Scholar] [CrossRef] [PubMed]
- Stewart, J.M.; Medow, M.S.; Sutton, R.; Visintainer, P.; Jardine, D.L.; Wieling, W. Mechanisms of Vasovagal Syncope in the Young: Reduced Systemic Vascular Resistance Versus Reduced Cardiac Output. J. Am. Heart Assoc. 2017, 6, e004417. [Google Scholar] [CrossRef] [PubMed]
- Song, J.; Jin, H.; Du, J. Diagnosis and treatment process in vasovagal syncope in children. Zhongguo Shi Yong Er Ke Za Zhi 2017
-
Heart rate (HR)
-
LVFS (left ventricular fractional shortening) and LVEF (left ventricular ejection fraction)
- , 1629–1638. [
- Google Scholar
-
Baroreflex sensitivity (BRS)
- ] [
- CrossRef
- ] [
- PubMed
- ]
- Preibisz, J.J.; Sealey, J.E.; Laragh, J.H.; Cody, R.J.; Weksler, B.B. Plasma and platelet vasopressin in essential hypertension and congestive heart failure.
- Hypertension
- 1983
- ,
- 5
- , I129–I138. [
- Google Scholar
- ] [
- CrossRef
- ]
- Barat, C.; Simpson, L.; Breslow, E. Properties of human vasopressin precursor constructs: Inefficient monomer folding in the absence of copeptin as a potential contributor to diabetes insipidus.
- Biochemistry
- 2004
- ,
- 43
- , 8191–8203. [
- Google Scholar
-
24 h urine norepinephrine (24 h urine NE)
4. Conclusions
The strategies and methods used to treat VVS and POTS are different and it is important to clearly distinguish the two diseases. Currently, POTS and VVS are diagnosed based mainly on clinical symptoms and positive changes in the HUTT. However, the hemodynamic changes during the HUTT sometimes overlap, thus obscuring the diagnosis. Ongoing research has identified methods to differentiate VVS and POTS, which are useful in clinical practice. HRV, AI, the 30/15 ratio, plasma H2S, and the serum iron level are all considered useful indexes. However, we believe that in the future, better indicators will be developed to differentiate between these two clinical syndromes. Significant progress has been made in the individualized management of pediatric POTS and VVS. Hemodynamic parameters or biomarkers can be used as objective indexes for POTS and VVS in pediatric populations and they are capable of guiding the appropriate therapy selection. Unfortunately, the predictive value of the markers or indexes varies and none of them can be regarded as the gold standard. Indeed, more sensitive predictive indicators for the effectiveness of different treatment modalities and better methods of diagnosis are required to improve the individualized management of POTS and VVS in children and adolescents.- ,
- 32
- , 384–388. [
- Google Scholar
- ]
- Tao, C.; Du, J. Research progress in the individualized treatment for postural tachycardia syndrome in children.
- Zhongguo Shi Yong Er Ke Za Zhi
- 2018, 33, 909–919. [Google Scholar]
- Chu, W.; Wang, C.; Lin, P.; Li, F.; Wu, L.; Xie, Z. Transient aphasia: A rare complication of head-up tilt test. Neurol. Sci. 2014, 35, 1127–1132. [Google Scholar] [CrossRef]
- Wang, R. Two’s company, three’s a crowd: Can H2S be the third endogenous gaseous transmitter? FASEB J. 2002, 16, 1792–1798. [Google Scholar] [CrossRef]
- Yang, G.; Wu, L.; Jiang, B.; Yang, W.; Qi, J.; Cao, K.; Meng, Q.; Mustafa, A.K.; Mu, W.; Zhang, S.; et al. H2S as a physiologic vasorelaxant: Hypertension in mice with deletion of cystathionine gamma-lyase. Science 2008, 322, 587–590. [Google Scholar] [CrossRef] [PubMed]
- Zhang, F.; Li, X.; Stella, C.; Chen, L.; Liao, Y.; Tang, C.; Jin, H.; Du, J. Plasma hydrogen sulfide in differential diagnosis between vasovagal syncope and postural orthostatic tachycardia syndrome in children. J. Pediatr. 2012, 160, 227–231. [Google Scholar] [CrossRef]
- Verdon, F.; Burnand, B.; Stubi, C.-L.F.; Bonard, C.; Graff, M.; Michaud, A.; Bischoff, T.; De Vevey, M.; Studer, J.-P.; Herzig, L.; et al. Iron supplementation for unexplained fatigue in non-anaemic women: Double blind randomised placebo controlled trial. BMJ 2003, 326, 1124. [Google Scholar] [CrossRef] [PubMed]
- Jarjour, I.T.; Jarjour, L.K. Low iron storage and mild anemia in postural tachycardia syndrome in adolescents. Clin. Auton. Res. 2013, 23, 175–179. [Google Scholar] [CrossRef] [PubMed]
- Hoeldtke, R.D.; Streeten, D.H. Treatment of orthostatic hypotension with erythropoietin. N. Engl. J. Med. 1993, 329, 611–615. [Google Scholar] [CrossRef]
- Stewart, J.M. Reduced iron stores and its effect on vasovagal syncope (simple faint). J. Pediatr. 2008, 153, 9–11. [Google Scholar] [CrossRef]
- Li, J.; Zhang, Q.; Gao, J.; Jin, H.; Du, J. Significance of serum iron in the differential diagnosis between vasovagal syncope and postural orthostatic tachycardia syndrome in children. Beijing Da Xue Xue Bao Yi Xue Ban 2013, 45, 923–927. [Google Scholar] [PubMed]
- Sundkvist, G.; Lilja, B. Effect of the degree and speed of tilt on the immediate heart rate reaction. Clin. Physiol. 1983, 3, 381–386. [Google Scholar] [CrossRef]
- Ewing, D.J.; Campbell, I.W.; Murray, A.; Neilson, J.M.; Clarke, B.F. Immediate heart-rate response to standing: Simple test for autonomic neuropathy in diabetes. Br. Med. J. 1978, 1, 145–147. [Google Scholar] [CrossRef]
- Tao, C.; Chen, S.; Li, H.; Wang, Y.; Wang, Y.; Liu, P.; Liao, Y.; Zhang, C.; Tang, C.; Jin, H.; et al. Value of Immediate Heart Rate Alteration From Supine to Upright in Differential Diagnosis Between Vasovagal Syncope and Postural Tachycardia Syndrome in Children. Front. Pediatr. 2018, 6, 343. [Google Scholar] [CrossRef]
- Wang, Y.; Zhang, C.; Chen, S.; Li, X.; Jin, H.; Du, J. Frequency Domain Indices of Heart Rate Variability are Useful for Differentiating Vasovagal Syncope and Postural Tachycardia Syndrome in Children. J. Pediatr. 2019, 207, 59–63. [Google Scholar] [CrossRef]
- Qingyou, Z.; Junbao, D.; Chaoshu, T. The efficacy of midodrine hydrochloride in the treatment of children with vasovagal syncope. J. Pediatr. 2006, 149, 777–780. [Google Scholar] [CrossRef] [PubMed]
- Fu, Q.; Vangundy, T.B.; Shibata, S.; Auchus, R.J.; Williams, G.H.; Levine, B.D. Exercise training versus propranolol in the treatment of the postural orthostatic tachycardia syndrome. Hypertension 2011, 58, 167–175. [Google Scholar] [CrossRef] [PubMed]
- Chen, L.; Wang, L.; Sun, J.; Qin, J.; Tang, C.; Jin, H.; Du, J. Midodrine hydrochloride is effective in the treatment of children with postural orthostatic tachycardia syndrome. Circ. J. 2011, 75, 927–931. [Google Scholar] [CrossRef]
- Fu, Q.; Levine, B.D. Exercise and non-pharmacological treatment of POTS. Auton. Neurosci. 2018, 215, 20–27. [Google Scholar] [CrossRef] [PubMed]
- Sheldon, R.; Faris, P.; Tang, A.; Ayala-Paredes, F.; Guzman, J.; Marquez, M.; Morillo, C.A.; Krahn, A.D.; Kus, T.; Ritchie, M.D.; et al. Midodrine for the Prevention of Vasovagal Syncope: A Randomized Clinical Trial. Ann. Intern. Med. 2021
- ]
- Zhang, F.W.; Liao, Y.; Li, X.Y.; Chen, L.; Jin, H.F.; DU, J. Therapies for postural tachycardia syndrome in children.
- Zhonghua Er Ke Za Zhi
- 2011
- ,
- 49
- , 428–432. [
- Google Scholar
- ]
- Stewart, J.M.; Montgomery, L.D. Regional blood volume and peripheral blood flow in postural tachycardia syndrome.
- Am. J. Physiol. Heart Circ. Physiol.
- 2004
- ,
- 287
- , H1319–H1327. [
- Google Scholar
- ] [
- CrossRef
- ]
- Strieper, M.J.; Campbell, R.M. Efficacy of alpha-adrenergic agonist therapy for prevention of pediatric neurocardiogenic syncope.
- J. Am. Coll. Cardiol.
- 1993
- ,
- 22
- , 594–597. [
- Google Scholar
- ] [
- CrossRef
- ]
- Franklin, L.; Bauce, L.; Pittman, Q.J. Depletion of central catecholamines reduces pressor responses to arginine vasopressin.
- Brain Res.
- 1988
- ,
- 438
- , 295–298. [
- Google Scholar
- ] [
- CrossRef
- ]
- Lamarre-Cliche, M.; du Souich, P.; de Champlain, J.; Larochelle, P. Pharmacokinetic and pharmacodynamic effects of midodrine on blood pressure, the autonomic nervous system, and plasma natriuretic peptides: A prospective, randomized, single-blind, two-period, crossover, placebo-controlled study.
- Clin. Ther.
- 2008
- ] [
- CrossRef
- ]
- Wyller, V.B.; Thaulow, E.; Amlie, J.P. Treatment of chronic fatigue and orthostatic intolerance with propranolol.
- J. Pediatr.
- 2007, 150, 654–655. [Google Scholar] [CrossRef] [PubMed]
- Lai, C.C.; Fischer, P.R.; Brands, C.K.; Fisher, J.L.; Porter, C.-B.J.; Driscoll, S.W.; Graner, K.K. Outcomes in adolescents with postural orthostatic tachycardia syndrome treated with midodrine and beta-blockers. Pacing Clin. Electrophysiol. 2009, 32, 234–238. [Google Scholar] [CrossRef]
- Ladage, D.; Schwinger, R.H.; Brixius, K. Cardio-selective beta-blocker: Pharmacological evidence and their influence on exercise capacity. Cardiovasc. Ther. 2013, 31, 76–83. [Google Scholar] [CrossRef]
- Kimpinski, K.; Figueroa, J.J.; Singer, W.; Sletten, D.M.; Iodice, V.; Sandroni, P.; Fischer, P.R.; Opfer-Gehrking, T.L.; Gehrking, J.A.; Low, P.A. A prospective, 1-year follow-up study of postural tachycardia syndrome. Mayo Clin. Proc. 2012, 87, 746–752. [Google Scholar] [CrossRef]
- Szinnai, G.; Morgenthaler, N.G.; Berneis, K.; Struck, J.; Müller, B.; Keller, U.; Christ-Crain, M. Changes in plasma copeptin, the c-terminal portion of arginine vasopressin during water deprivation and excess in healthy subjects. J. Clin. Endocrinol. Metab. 2007, 92, 3973–3978. [Google Scholar] [CrossRef] [PubMed]
- Bateman, R.J.; Boychuk, C.R.; Philbin, K.E.; Mendelowitz, D. β adrenergic receptor modulation of neurotransmission to cardiac vagal neurons in the nucleus ambiguus. Neuroscience 2012, 210, 58–66. [Google Scholar] [CrossRef] [PubMed]
- Deng, X.; Zhang, Y.; Liao, Y.; Du, J. Efficacy of β-Blockers on Postural Tachycardia Syndrome in Children and Adolescents: A Systematic Review and Meta-Analysis. Front. Pediatr. 2019, 7, 460. [Google Scholar] [CrossRef] [PubMed]
- Nair, N.; Padder, F.A.; Kantharia, B.K. Pathophysiology and management of neurocardiogenic syncope. Am. J. Manag. Care 2003, 9, 327–336. [Google Scholar]
- Santini, L.; Capria, A.; Brusca, V.; Violo, A.; Smurra, F.; Scarfò, I.; Forleo, G.B.; Papavasileiou, L.P.; Borzi, M.; Romeo, F. An increased endothelial-independent vasodilation is the hallmark of the neurally mediated syncope. Clin. Cardiol. 2012, 35, 107–110. [Google Scholar] [CrossRef] [PubMed]
- Di Girolamo, E.; Di Iorio, C.; Leonzio, L.; Sabatini, P.; Barsotti, A. Usefulness of a tilt training program for the prevention of refractory neurocardiogenic syncope in adolescents: A controlled study. Circulation 1999, 100, 1798–1801. [Google Scholar] [CrossRef] [PubMed]
- Sundkvist, G.; Lilja, B.; Manhem, P.; Almér, L.O. Responses of plasma catecholamines to tilt in patients with diabetes mellitus. Acta Med. Scand. 1984, 216, 223–227. [Google Scholar] [CrossRef]
- Stewart, J.M. Orthostatic intolerance in pediatrics. J. Pediatr. 2002, 140, 404–411. [Google Scholar] [CrossRef] [PubMed]
- Low, P.A.; Gilden, J.L.; Freeman, R.; Sheng, K.N.; McElligott, M.A. Efficacy of midodrine vs. placebo in neurogenic orthostatic hypotension. A randomized, double-blind multicenter study. Midodrine Study Group. JAMA 1997, 277, 1046–1051. [Google Scholar] [CrossRef] [PubMed]
- Samniah, N.; Sakaguchi, S.; Lurie, K.G.; Iskos, D.; Benditt, D.G. Efficacy and safety of midodrine hydrochloride in patients with refractory vasovagal syncope. Am. J. Cardiol. 2001, 88, 80–83. [Google Scholar] [CrossRef]
- Kaufmann, H.; Saadia, D.; Voustianiouk, A. Midodrine in neurally mediated syncope: A double-blind, randomized, crossover study. Ann. Neurol. 2002, 52, 342–345. [Google Scholar] [CrossRef]
- Galetta, F.; Franzoni, F.; Plantinga, Y.; Ghiadoni, L.; Merico, G.; Tocchini, L.; Braccini, L.; Rossi, M.; Carpi, A.; Taddei, S.; et al. Endothelial function in young subjects with vaso-vagal syncope. Biomed. Pharmacother. 2006, 60, 448–452. [Google Scholar] [CrossRef] [PubMed]
- Chen, L.Y.; Shen, W.K. Neurocardiogenic syncope: Latest pharmacological therapies. Expert Opin. Pharmacother. 2006, 7, 1151–1162. [Google Scholar] [CrossRef] [PubMed]
- Brignole, M.; Menozzi, C.; Gianfranchi, L.; Lolli, G.; Bottoni, N.; Oddone, D. A controlled trial of acute and long-term medical therapy in tilt-induced neurally mediated syncope. Am. J. Cardiol. 1992, 70, 339–342. [Google Scholar] [CrossRef]
- Sheldon, R.; Rose, S.; Flanagan, P.; Koshman, M.L.; Killam, S. Effect of beta blockers on the time to first syncope recurrence in patients after a positive isoproterenol tilt table test. Am. J. Cardiol. 1996, 78, 536–539. [Google Scholar] [CrossRef]
- Di Girolamo, E.; Di Iorio, C.; Sabatini, P.; Leonzio, L.; Barsotti, A. Evaluation of the effects of diverse therapeutic treatments versus no treatment of patients with neurocardiogenic syncope. Cardiologia 1998, 43, 833–837. [Google Scholar]
- Madrid, A.H.; Ortega, J.; Rebollo, J.G.; Manzano, J.G.; Segovia, J.G.; Sánchez, A.; Peña, G.; Moro, C. Lack of efficacy of atenolol for the prevention of neurally mediated syncope in a highly symptomatic population: A prospective, double-blind, randomized and placebo-controlled study. J. Am. Coll. Cardiol. 2001, 37, 554–559. [Google Scholar] [CrossRef]
- Ventura, R.; Maas, R.; Zeidler, D.; Schoder, V.; Nienaber, C.A.; Schuchert, A.; Meinertz, T. A randomized and controlled pilot trial of beta-blockers for the treatment of recurrent syncope in patients with a positive or negative response to head-up tilt test. Pacing Clin. Electrophysiol. 2002, 25, 816–821. [Google Scholar] [CrossRef] [PubMed]
- Flevari, P.; Livanis, E.G.; Theodorakis, G.N.; Zarvalis, E.; Mesiskli, T.; Kremastinos, D.T. Vasovagal syncope: A prospective, randomized, crossover evaluation of the effect of propranolol, nadolol and placebo on syncope recurrence and patients’ well-being. J. Am. Coll. Cardiol. 2002, 40, 499–504. [Google Scholar] [CrossRef]
- Sheldon, R. The Prevention of Syncope Trial (POST) Results. In Proceedings of the 25th Annual Scientific Sessions, San Francisco, CA, USA, 19–22 May 2004. [Google Scholar]
- Chen, L.; Du, J.-B.; Zhang, Q.-Y.; Wang, C.; Du, Z.-D.; Wang, H.-W.; Tian, H.; Chen, J.-J.; Wang, Y.-L.; Hu, X.-F.; et al. A multicenter study on treatment of autonomous nerve-mediated syncope in children with beta-receptor blocker. Zhonghua Er Ke Za Zhi 2007, 45, 885–888. [Google Scholar] [PubMed]
- Kuchinskaia, E.A.; Pevzner, A.V.; Vershuta, E.V.; Al’Bitskaia, K.V.; Kheĭmets, G.I.; Rogoza, A.; Golitsyn, S.P. Comparative efficacy and tolerance of atenolol and midodrine in patients with vasovagal syncopes. Ter. Arkh. 2006, 78, 64–68. [Google Scholar]
- Mitro, P.; Rybárová, E.; Zemberová, E.; Tkác, I. Enhanced plasma catecholamine and cAMP response during the head-up tilt test in patients with vasovagal syncope. Wien. Klin. Wochenschr. 2005, 117, 353–358. [Google Scholar] [CrossRef]
- Edner, M.; Brodin, L.; Al-Khalili, F.; Svane, B.; Moor, E.; Ståhle, A.; Nordlander, R. Changes in Systolic and Diastolic Function Indexes Throughout Dobutamine Stress Echocardiography in Healthy Volunteers and Patients with Ischemic Heart Disease. Echocardiography 1998, 15, 625–634. [Google Scholar] [CrossRef] [PubMed]
- Yao, R.; Huang, J. Pathophysiology and treatment of vasovagal syncope. Adv. Cardiovasc. Dis. 2013, 34, 221–224. [Google Scholar]
- Zhang, Q.; Jin, H.; Wang, L.; Chen, J.; Tang, C.; Du, J. Rand.domized comparison of metoprolol versus conventional treatment in preventing recurrence of vasovagal syncope in children and adolescents. Med. Sci. Monit. 2008, 14, CR199–CR203. [Google Scholar]
- Wang, Y.; Wang, Y.; Li, X.; Du, J.; Zhang, H.; Jin, H.; Liao, Y. Efficacy of Increased Salt and Water Intake on Pediatric Vasovagal Syncope: A Meta-Analysis Based on Global Published Data. Front. Pediatr. 2021, 9, 663016. [Google Scholar] [CrossRef]
- White, C.M.; Tsikouris, J.P. A review of pathophysiology and therapy of patients with vasovagal syncope. Pharmacotherapy 2000, 20, 158–165. [Google Scholar] [CrossRef]
- Li, H.; Liao, Y.; Han, Z.; Wang, Y.; Liu, P.; Zhang, C.; Tang, C.; Du, J.; Jin, H. Head-up tilt test provokes dynamic alterations in total peripheral resistance and cardiac output in children with vasovagal syncope. Acta Paediatr. 2018, 107, 1786–1791. [Google Scholar] [CrossRef] [PubMed]
- Vigh, A.G.; DeAntonio, H.J. Acute and long-term beta-adrenergic blockade for patients with neurocardiogenic syncope. J. Am. Coll. Cardiol. 1996, 28, 798. [Google Scholar] [CrossRef]
- Sheldon, R.; Connolly, S.; Rose, S.; Klingenheben, T.; Krahn, A.; Morillo, C.; Talajic, M.; Ku, T.; Fouad-Tarazi, F.; Ritchie, D.; et al. Prevention of Syncope Trial (POST): A randomized, placebo-controlled study of metoprolol in the prevention of vasovagal syncope. Circulation 2006, 113, 1164–1170. [Google Scholar] [CrossRef] [PubMed]