Your browser does not fully support modern features. Please upgrade for a smoother experience.
Please note this is a comparison between Version 1 by Kamran Shaukat and Version 4 by Liton Devanth.
Computer-aided diagnostic (CAD) systems can assist radiologists in detecting coal workers’ pneumoconiosis (CWP) in their chest X-rays. Early diagnosis of the CWP can significantly improve workers’ survival rate. The feature extraction and detection approaches of computer-based analysis in CWP using chest X-ray radiographs (CXR) can be summarised into three categories: classical methods including computer and international labor organization (ILO) classification-based detection; traditional machine learning methods; and CNN methods.
- coal workers’ pneumoconiosis
- computer-aided diagnostic
- occupational lung disease
- pneumoconiosis
- black lung
- machine learning
- deep learning
- chest X-ray radiographs
- Interstitial Lung Disease
- ILO Classification of Pneumoconiosis
1. Introduction
Pneumoconiosis is an occupational lung disease and a group of interstitial lung diseases (ILD) caused by chronic inhalation of dust particles, often in mines and from agriculture, that can damage both lungs and is not reversible [1][2][3][1,2,3]. There are three important occupational lung diseases, coal worker pneumoconiosis (CWP), asbestosis, and silicosis, seen in Australia [4]. CWP (commonly known as black lung (BL)) is mainly caused by long-term experience with coal dust, which is similar to silicosis lung disease caused by silica and asbestos dust. Pneumoconiosis, including CWP, asbestosis, and silicosis, killed 125,000 people worldwide between 1990 and 2010, according to the Global Burden of Disease (GBD) [5]. The national mortality analysis from 1979–2002 reports that over 1000 people have died in Australia due to pneumoconiosis, with CWP, asbestosis, and silicosis representing 6%, 56%, and 38% of the total, respectively. Pneumoconiosis has increased due to poor dust control and a lack of workplace safety measures [6][7][8][9][6,7,8,9].
In clinical imaging, computer-aided diagnosis (CADx), also known as computer-aided detection (CADe), is a system developed for the computer to help make quick decisions for future treatment [10][11][10,11]. Medical image analysis is now an essential assessment for detecting possible clinical abnormalities at an earlier stage. CAD systems help to improve diagnostic image systems, visualising suspicious parts and highlighting the most affected area of images in X-rays, CT-scans, ultrasounds, and MRI [12][13][12,13].
Standard Classification of Pneumoconiosis
The abnormality on a chest X-ray of the lung is signified by an increase or decrease in density areas. The chest X-ray lung abnormalities with increased density are also known as pulmonary opacities. Pulmonary opacities have three major patterns: consolidation, interstitial, and atelectasis. Among them, interstitial patterns of pulmonary opacities are mainly responsible for BL disease [14][15][16][27,28,29]. According to ILO classification [17][30], there are two types of abnormalities, parenchymal and pleural, seen for all types of pneumoconiosis, such as our target research topic BL disease or CWP.
The ILO has categorised pneumoconiosis into 0, 1, 2, and 3 stages, where 0 is normal and 3 is the most complicated stage of the disease. The stage of the disease is indicated by the profusion of small and large opacities, which may be round or irregularly shaped, which presents the parenchymal abnormality. The ILO classifies the size (diameter) of small rounded opacities as p, q, or r, indicative of diameters: p≤1.5, 1.5≤q≤3, 3≤r≤10 mm and defined by the presence on the six significant zones (upper, middle, lower) in both left and right lungs. On the other hand, the size (widths) of small irregular opacities is illustrated by the letters shown in standard radiograph areas, s≤1.5, 1.5≤t≤3, 3≤u≤10 mm. Opacities with a dimension of more than 10 mm are defined as large opacities. They are divided into three major categories, defined as 0≤A≤50 mm, 50≤B≤Area(RUZ), and 50≤C≥Area(RUZ), where RUZ indicates the area of the right upper zone (RUZ).
In pleural abnormalities, the ILO has shown that the parietal pleura is seen in the chest wall, diaphragm, and other sites of the lungs that can diffuse the thickness and decay at the appropriate angle of the lung frame. Figure 1 summarises parenchymal and pleural abnormalities, followed by standard opacities and their perfusion measurements.
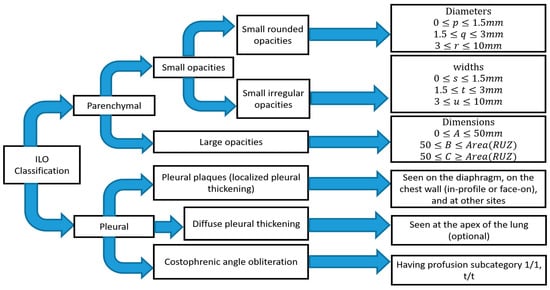
Figure 1. Summary of ILO standard classification of pneumoconiosis.
It is difficult for radiologists to classify pneumoconiosis in both types of abnormalities. The measurement of the size and shape of all regular and irregular opacities is quite difficult, especially in the earlier stage of CWP disease [18][31]. The radiographic changes in some blood vessels forming the opacities’ shape and the size of pneumoconiosis are difficult to diagnose. In addition, pleural plaque on plain chest radiographs shown in the shadows of ribs may lead to misclassification of conditions consistent with pneumoconiosis [19][20][32,33]. Therefore, the development of significant computer-aided diagnosis (CAD) schemes is necessary to reduce the risk in the workplace and improve the chest screening for pneumoconiosis diseases.
2. Detection Approach of CWP
2.1. Classical Methods
In the past year, the texture features were mostly classified using classical computer-based methods and ILO-based standard classification [21][22][23][24][25][26][27][28][29][30][31][34,39,40,41,42,43,44,45,46,47,48], as shown in Figure 2. A linear discriminant analysis (LDA) and partial least squares (PLS) regression function has performed this in computer-based classification methods [21][27][28][29][30][31][34,44,45,46,47,48]. LDA and PLS are the classic statistical approaches for reducing the dimensions of characteristics to improve the classification. Besides this classification method, some researchers used the classical ILO standard-based guideline as shown in Figure 2. The profusion of small round opacities and ILO extent properties indicated normal and abnormal classes. Neural networks have been applied to find the shape and size of round opacities from ROI images [32][33][34][35][36,37,38,94]. The X-ray abnormalities were categorised and compared with the results of the standard ILO measurement of the size and shape of the round opacities, as in Figure 1.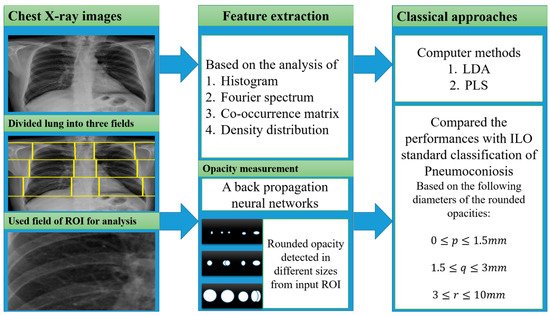
Figure 2.
The illustration of the classical approaches was used for CWP detection.
2.2. Traditional Machine Learning
Most texture features, from Fourier spectrum, co-occurrence matrix, histogram, wavelet transform, and density distribution, are classified using different traditional machine learning classifiers, namely support vector machines (SVM) [36][37][38][39][40][41][42][43][44][45][51,52,54,56,57,59,60,61,62,63], decision trees (DT) [37][39][52,56], random trees (RT) [36][38][42][44][51,54,60,62], artificial neural networks (ANNs) [46][47][48][53,55,58], K-nearest neighbors (KNN) [49][65], self-organizing maps (SOM) [49][65], backpropagation (BP), radial basis function (RBF) neural networks (NN) [36][38][42][44][49][50][51,54,60,62,65,66], and ensemble classifiers [37][41][43][52,59,61]. Figure 3 shows how the researchers connected various texture features with traditional machine learning classifiers to detect CWP in CXR. A set of features was derived from the corresponding transformation of various X-ray inputs. Transformation methods were discussed separately in the feature analysis section above.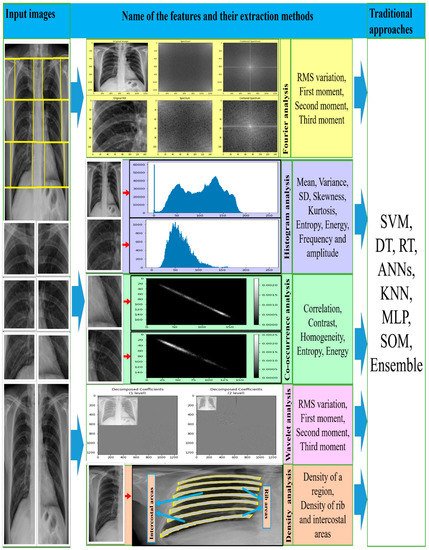
Figure 3. The illustration of the traditional approaches used for CWP detection.
2.3. CNN-Based
For the period 2019–2021, eights studies were found that proposed using deep convolutional neural network (CNN) models to classify CWP (black lung disease) in CXR [52][53][54][55][56][57][58][59][49,67,68,69,70,71,72,73]. They used different pre-trained deep learning models for non-textured feature extraction then applied a fully connected layer with binary classifier for normal or abnormal (black lung) classification. Over the past few years, various CNN models, such as VGG16 [60][109], VGG19, AlexNet [61][102], Inception [62][100], Xception [63][110], ResNet50 [64][103], DenseNet121 [65][111], and CheXNet121 [66][112], have been developed based on the ImageNet database classification results. Each CNN model consists of two main parts: the base (top-removed), and the other is called the top. The base part of the CNN model is used as an automatic deep feature extractor and consists of a set of convolutional, normalisation, and pooling layers. The top part is used as a deep classifier and consists of a number of dense layers that are fully connected to the outputs of the base part of the model, as shown in Figure 4.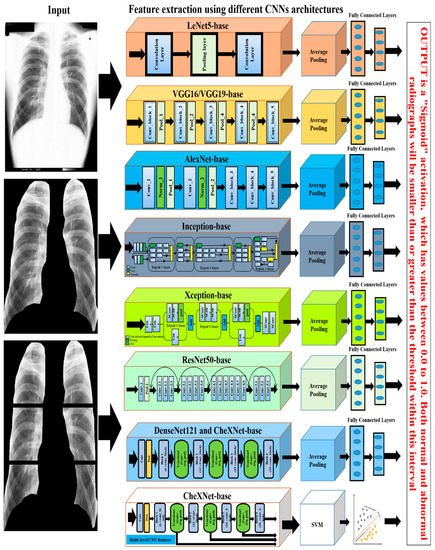
Figure 4.
The illustration of the deep learning approaches used for CWP detection.