Big data in healthcare contain a huge amount of tacit knowledge that brings great value to healthcare activities such as diagnosis, decision support, and treatment. However, effectively exploring and exploiting knowledge on such big data sources exposes many challenges for both managers and technologists. A healthcare knowledge management system that ensures the systematic knowledge development process on various data in hospitals was proposed. It leverages big data technologies to capture, organize, transfer, and manage large volumes of medical knowledge, which cannot be handled with traditional data-processing technologies. In addition, machine-learning algorithms are used to derive knowledge at a higher level in supporting diagnosis and treatment.
- KMS
- big data
- machine learning
- high blood pressure
- brain hemorrhage
- Spark
1. Introduction
2. Knowledge Management Systems
Knowledge management systems have a dramatic impact on the decision-making support of organizations. However, an effective KMS needs to ensure the whole process of knowledge management, including knowledge exploration and knowledge exploitation. Le Dinh et al. proposed an architecture for big-data-driven knowledge management systems including a set of constructs, a model, and a method [14]. This architecture has complied with the requirements of the knowledge development process and the knowledge management process. Based on the research of Le Dinh et al., researchers have proposed an architecture for a knowledge management system supporting medical diagnosis including four layers: data layer, information layer, knowledge layer, and application layer (Figure 1). This knowl- edge management system ensures all four stages of the knowledge development process, including data, information, knowledge, and understanding, corresponding to four main activities, which are capture, organize, transfer, and apply. The objective of this entry is to present the architecture for medical diagnosis decision-supporting systems by collect- ing and analyzing big data. This proposal addresses two major challenges: knowledge management and knowledge organization from disparate data sources.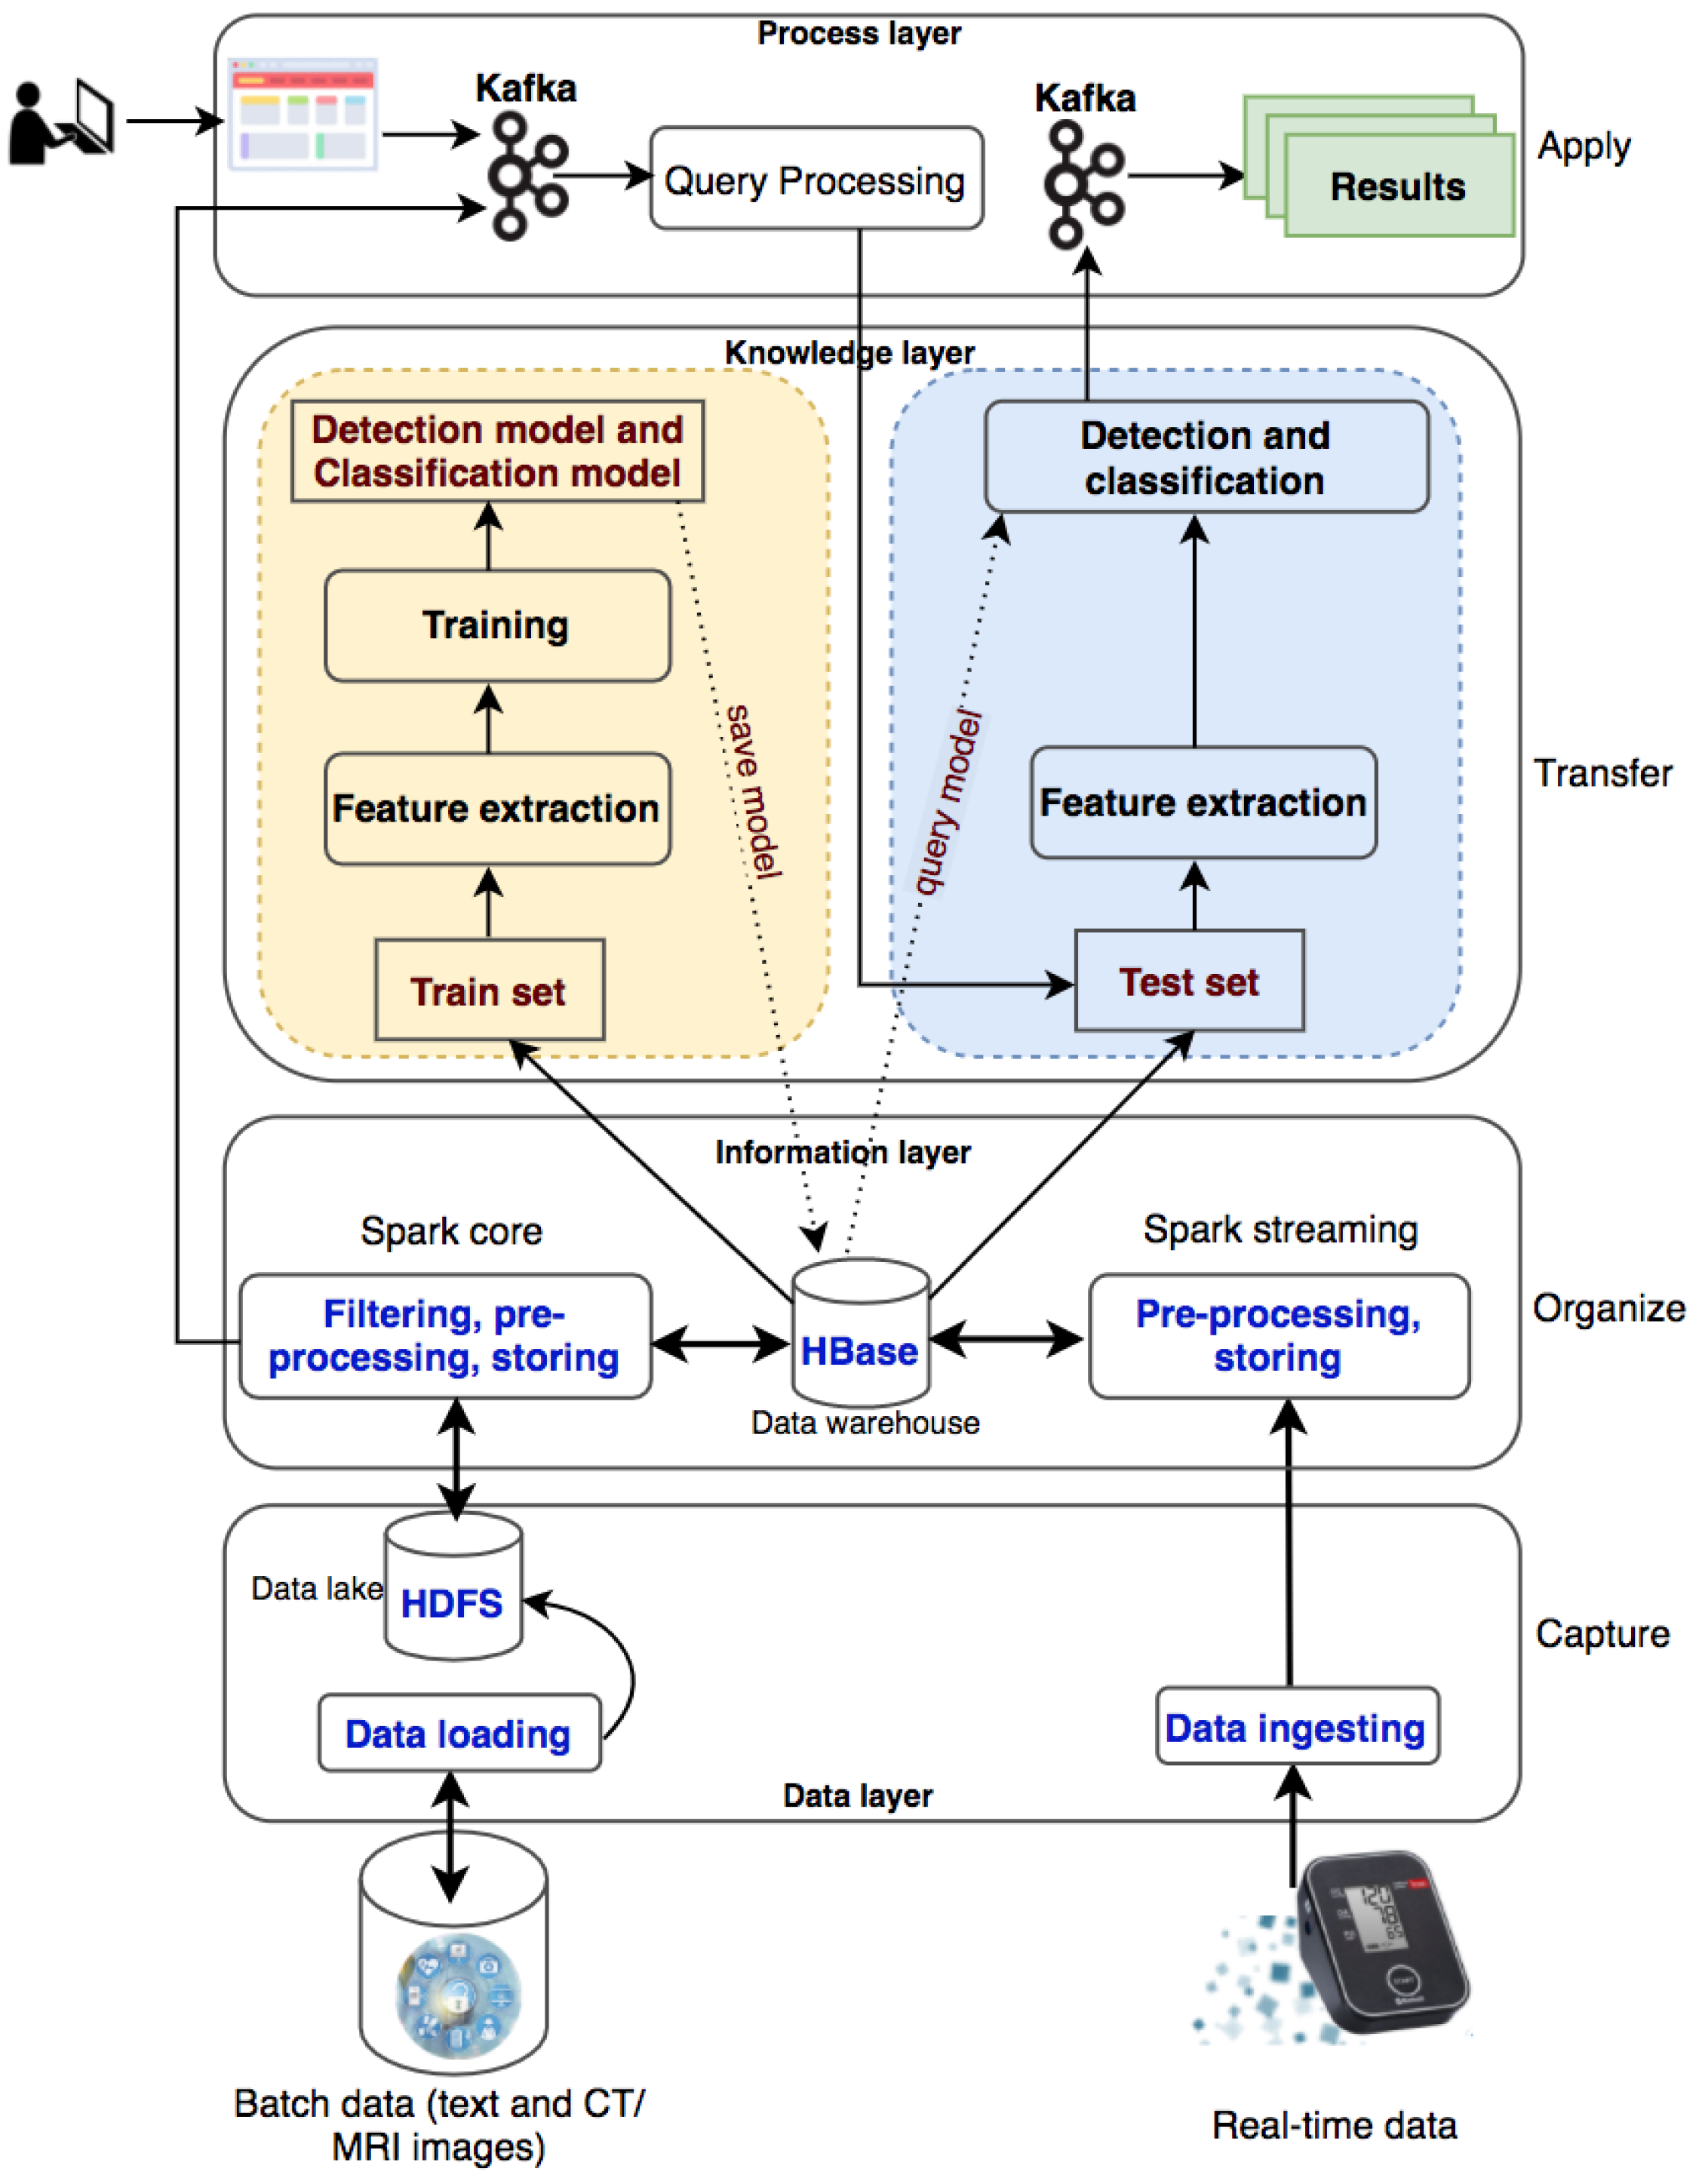
The system processes two types of data: batch data (patient records collected over a long time period) and real-time data (collected from wearable devices). The batch data are loaded into the data lake (HDFS) and the real-time data are ingested into the processing system with Kafka and Spark streaming. With a large amount of medical data, the system will filter out useful information for disease diagnosis and classification, preprocess information, and store information into HBase. The information will be used for knowledge transformation to create machine-learning models. New knowledge is created and made available to users through queries from websites or wearable devices.
2.1. Data Layer
There are two data sources used in this entry, including historical datasets collected from hospitals and real-time data collected from patients via health-monitoring wearable devices. The batch data are loaded into Hadoop Distributed File System (HDFS), a well- known fault-tolerant distributed file system. HDFS is designed to store very large datasets reliably and to stream those datasets at high bandwidth to user applications. The real- time data are ingested into the system with Apache Kafka, a distributed, reliable, high-throughput and low-latency publish-subscribe messaging system. Kafka has become popular when it and Apache Spark are coordinated to process stream data as well as to use both of their advantages. Researchers use Kafka to ingest real-time event data, streaming it to Spark Streaming. The data can be in text format or images, especially CT/MRI images that are commonly used in medical diagnosis. These raw data are collected and fed into the system for storage at the data layer.
2.2. Information Layer
Data will be sorted, organized, and filtered accordingly to transform into meaningful information in an organized and retrievable form. This information will be stored as datasets on a distributed file system HBase to serve for distributed and parallel processing in a big data environment. Apache HBase is a distributed column-oriented NoSQL database built on top of HDFS. The system requires the ability to handle batch and real-time data. Consequently, researchers use Apache Spark for both the batch and real-time data processing. Spark has emerged as the next-generation big-data-processing engine because it works with data in memory that are faster and better able to support a variety of compute-intensive tasks. Spark Core processes the batch data from HDFS to organize content according to their semantics and to create and maintain the knowledge base (HBase) as an organizational memory. Spark Streaming involves mapping continual input of the data from Kafka into real-time knowledge views. Every single event is sent as a message from Kafka to the Spark Streaming. Spark Streaming produces a stream and executes window-based operations on them.
The data collected from the hospital management system consist of many tables and many data fields. Depending on the goals of the medical diagnostic support systems, the appropriate data should be extracted. The historical datasets collected from hospitals will be used for the knowledge generation process, which is the input to the knowledge layer. These data are authentic, and the diagnostic results are given by the doctors with high professional confidence to help the labeling process in building knowledge models more effectively.
2.3. Knowledge Layer2.3. Knowledge Layer
Machine-learning algorithms can be used in the Spark distributed environment to build models for knowledge generation consisting of two phases: the training phase and the testing phase. Spark MLib is a core component to execute the learning service that allows for quickly experimenting and building data models. The appropriate models supporting diagnosis decisions will be made based on accuracy. In this layer, it is necessary to perform preprocessing of the data, which is to select the necessary information for the construction of a diagnosis support system. The diagnosis results previously given by doctors are used for labeling purposes. After data preprocessing, 70% of the random dataset will be used for the training phase and 30% for the testing phase.
The machine-learning algorithms used in the knowledge layer are decision trees and deep neural networks. Decision trees have been successfully used in a wide range of fields such as speech recognition, remote sensing, and medical diagnosis. The reason for choosing a decision tree at the knowledge layer here is that the patient records for hypertension are all in text format. The decision tree uses input data to learn and generate knowledge with the same rules as to how humans think. It breaks down a complex decision-making process into simple rules that are simple to understand and suitable to use for datasets of diverse attributes and data types. Deep learning with Faster R-CNN Inception ResNet v2 is another machine-learning algorithm to be used in the knowledge layer for brain hemorrhage diagnosis. Deep-learning techniques have been successfully applied in a wide range of fields, especially in medical images analysis.
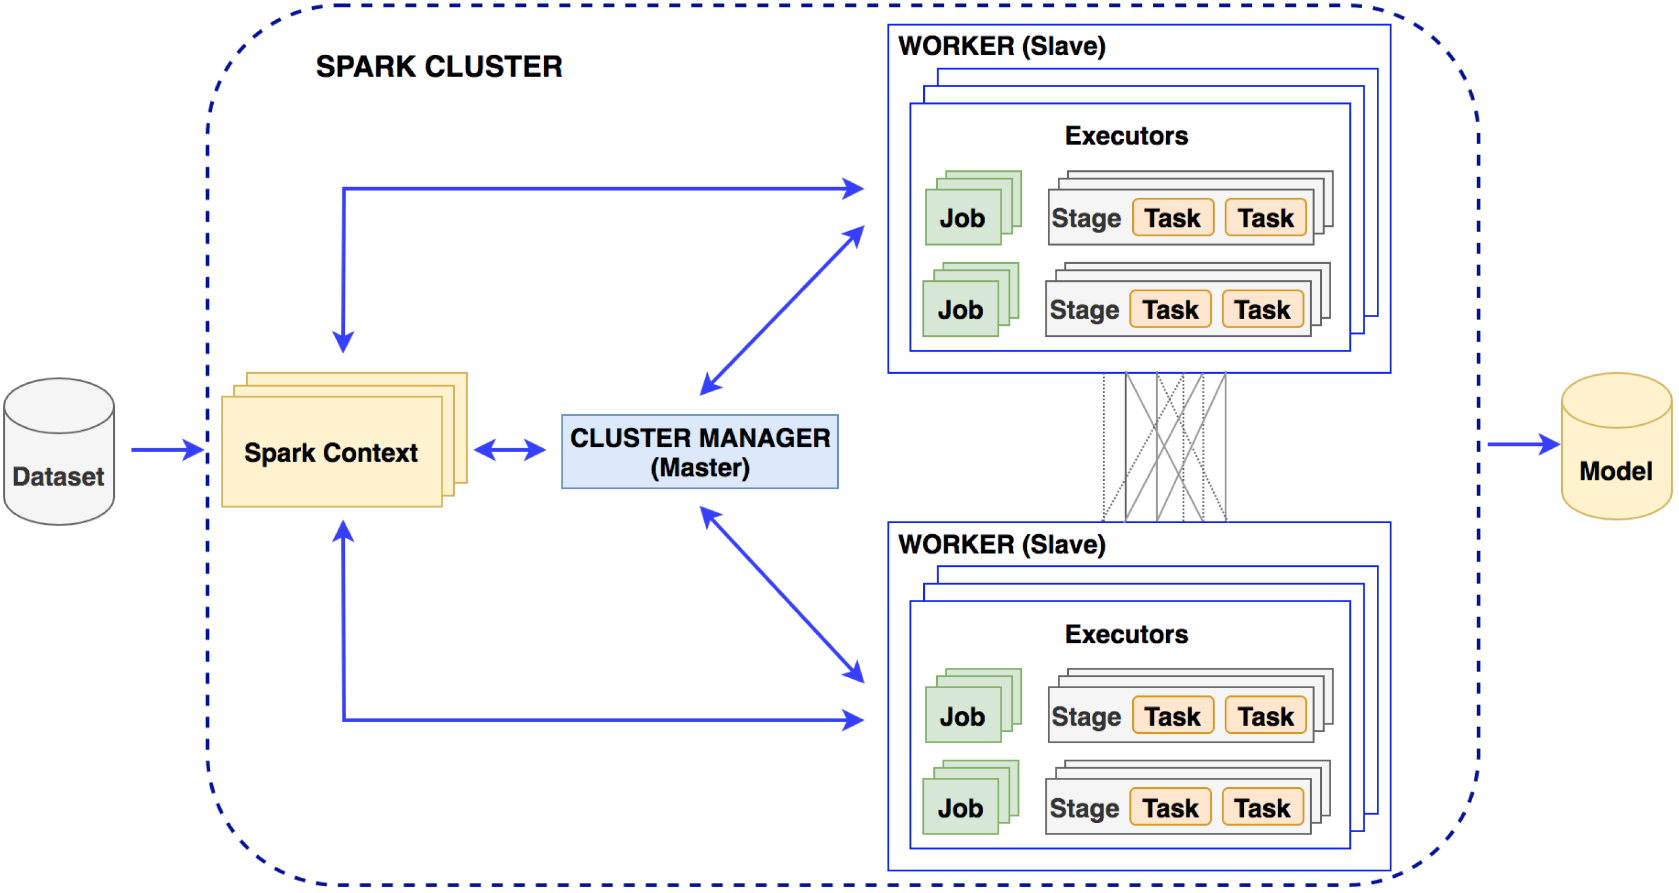
Training phase: In this phase, researchers perform feature extraction on the input dataset and then train machine-learning models. Model training is performed in a distributed environment and stores the trained model on distributed file systems (Figure 2). Researchers build machine-learning models with the extracted feature dataset.
2.4. Process Layer
In this layer, the applications are built to input patient information into the system and give outputs about diagnosis and diseases classification. The applications are designed to perform patient data entry and then execute knowledge queries to return new knowledge about the patient’s health status. The execution of queries in this layer is implemented in a distributed environment.
3. Healthcare Knowledge Management Systems
3.1. High Blood Pressure Diagnosis Support
Blood pressure is the blood force exerted against vessel walls as it moves through the vessels [15]. Blood pressure is expressed as two numbers: systolic pressure and diastolic pressure. Systolic is the higher number, which corresponds to the period when the heart beats to push the blood in the arteries. Diastolic is the lower number, which corresponds to the rest period between two consecutive heartbeats. Typically, high blood pressure is when the blood pressure measured in medical facilities is greater than or equal to 140/90 mmHg. According to the seventh report of the Joint National Committee on Prevention, Detection, Evaluation, and Treatment of High Blood Pressure (JNC 7) [16], the classification of blood pressure for adults aged 18 and older is presented in Table 1.| Class | Systolic | Diastolic |
|---|---|---|
| Normal | <120 | and <80 |
| Prehypertension | 120–139 | or 80–89 |
| Stage 1 hypertension | 140–159 | or 90–99 |
| Stage 2 hypertension | ≥160 | or ≥100 |
3.1.1. Decision Tree for High Blood Pressure Detection
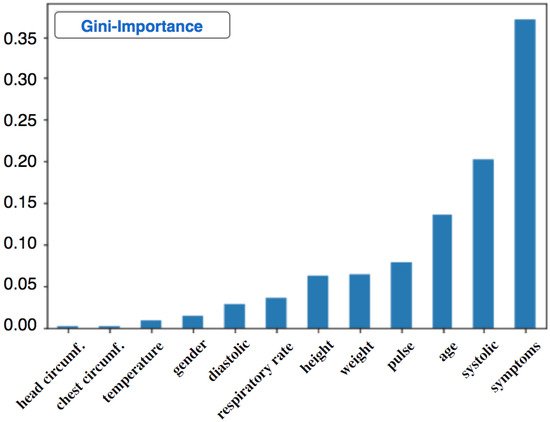
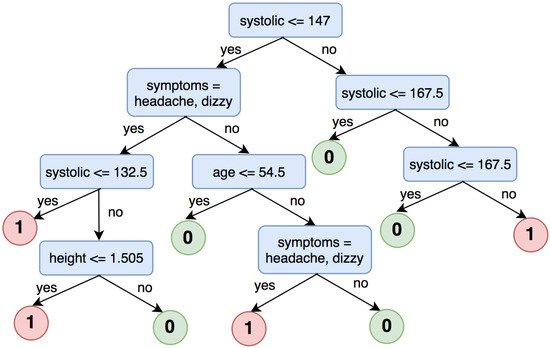
Preprocessing: The text data have a lot of empty data, zero value data, and even non-viable values that will affect the operations of the knowledge layer. Therefore, data preprocessing will remove non-viable values from the dataset. The solution to empty data fields is filling values using mathematical interpolation. This dataset is saved as a csv extension file and put on HBase for later use in distributed environments. Researchers label the data records based on the diagnosis results, which are concluded by professional doctors with high reliability. The data record is labeled 1 if the patient is diagnosed with high blood pressure and 0 otherwise. After labeling, researchers process the string information in the dataset to build a feature extraction model and receive the feature vectors. Model training: Researchers fit a decision tree with a ratio of 70/30 for training and testing phases. A classification decision tree is built with the train set, and then researchers will use the test set to evaluate the model performance. Table 2 contains the information of the dataset after labeling and feature extraction. This information is obtained during the steps researchers take before dividing train/test sets.| Symptoms | Diagnosis | Label | Index | Symptoms Classification | Features |
|---|---|---|---|---|---|
| Headache, vomit | Intracranial injury | 0 | 194 | (25,152, [194], [1.0]) | (25,163, [1, 2, 3, 4, 5, 6, 7, 8, 9, 10, 205], [17.0, 100.0, 60.0, 80.0, 18.0, 1.57, 22, 53, 48.0, 37.0, 1.0]) |
| Fiver | Chickenpox | 0 | 7 | (25,152, [7], [1.0]) | (25,163, [0, 1, 2, 3, 4, 5, 6, 7, 8, 9, 10, 18], [1.0, 36.0, 140.0, 60.0, 78.0, 20.0, 1.7, 39, 68, 50.0, 39.0, 1.0]) |
| Tired | Hypertension | 1 | 1 | (25,152, [1], [1.0]) | (25,163, [0, 1, 2, 3, 4, 5, 6, 7, 8, 9, 10, 12], [49.0, 210.0, 140.0, 104.0, 22.0, 1.73, 40, 55, 80.0, 37.0, 1.0]) |
| Abdominal pain | Acute appendicitis | 0 | 0 | (25,152, [0], [1.0]) | (25,163, [0, 1, 2, 3, 4, 5, 6, 7, 8, 9, 10, 11], [23.0, 110.0, 70.0, 87.0, 20.0, 1.46, 40.0, 50.0, 40.0, 37.0, 1.0]) |
| Dizzy | Vestibular dysfunction; Hypertension | 1 | 4 | (25,152, [4], [1.0]) | (25,163, [0, 1, 2, 3, 4, 5, 6, 7, 8, 9, 10, 15], [1.0, 53.0, 170.0, 100.0, 84.0, 18.0, 1.5, 42, 55, 50.0, 37.0, 1.0]) |
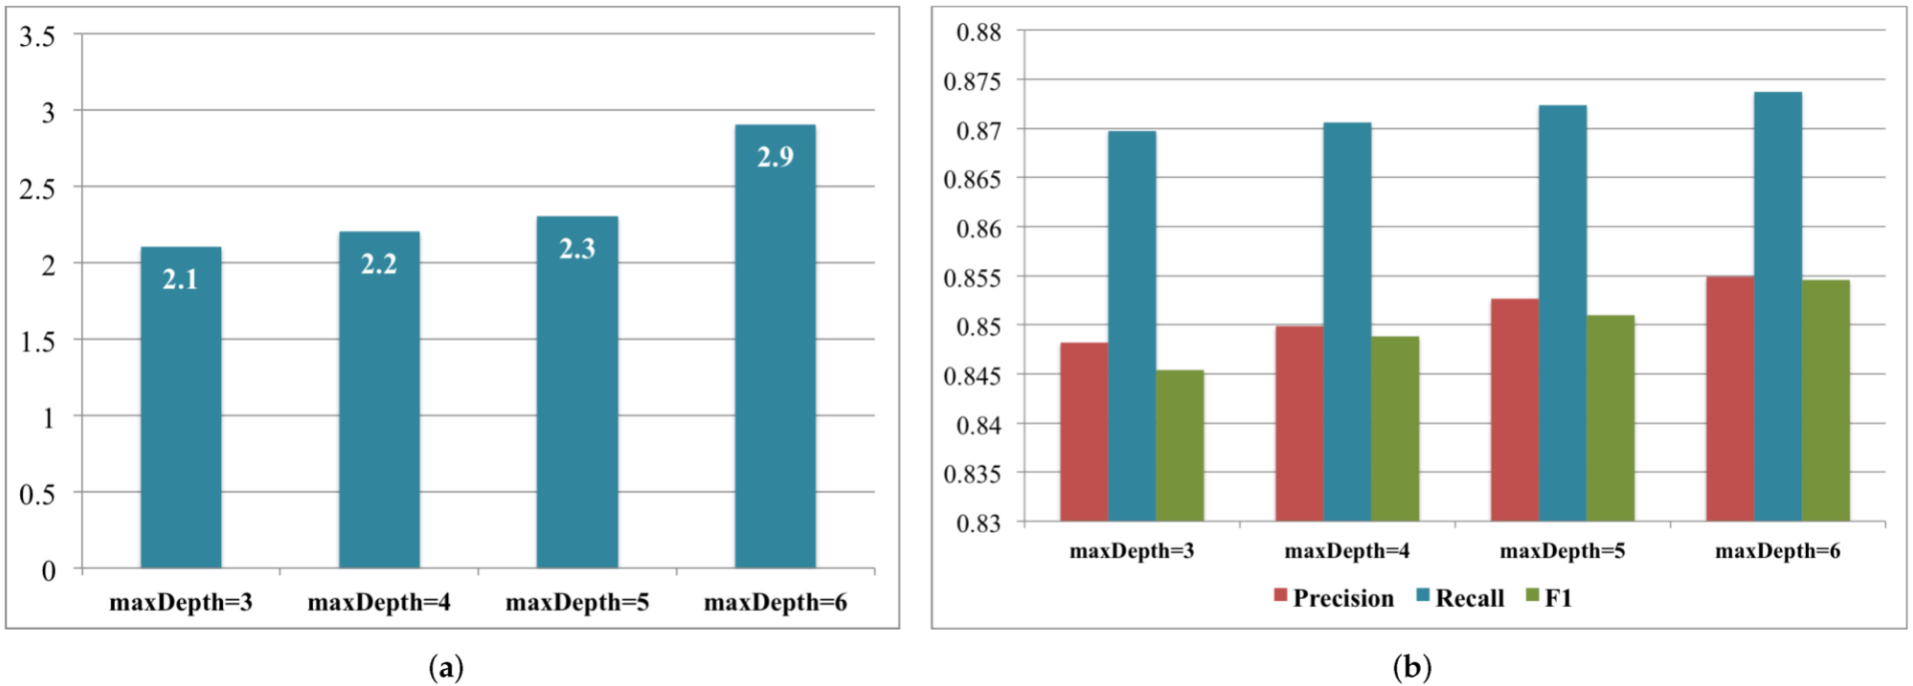
3.1.2. Decision Tree for High Blood Pressure Classification
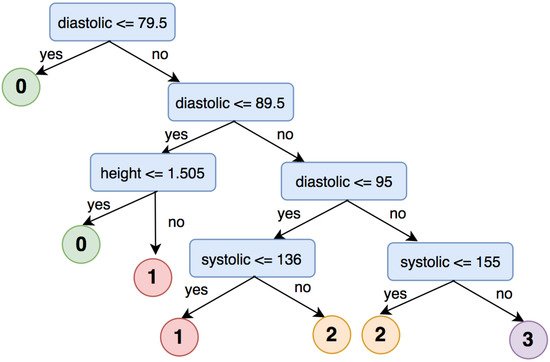
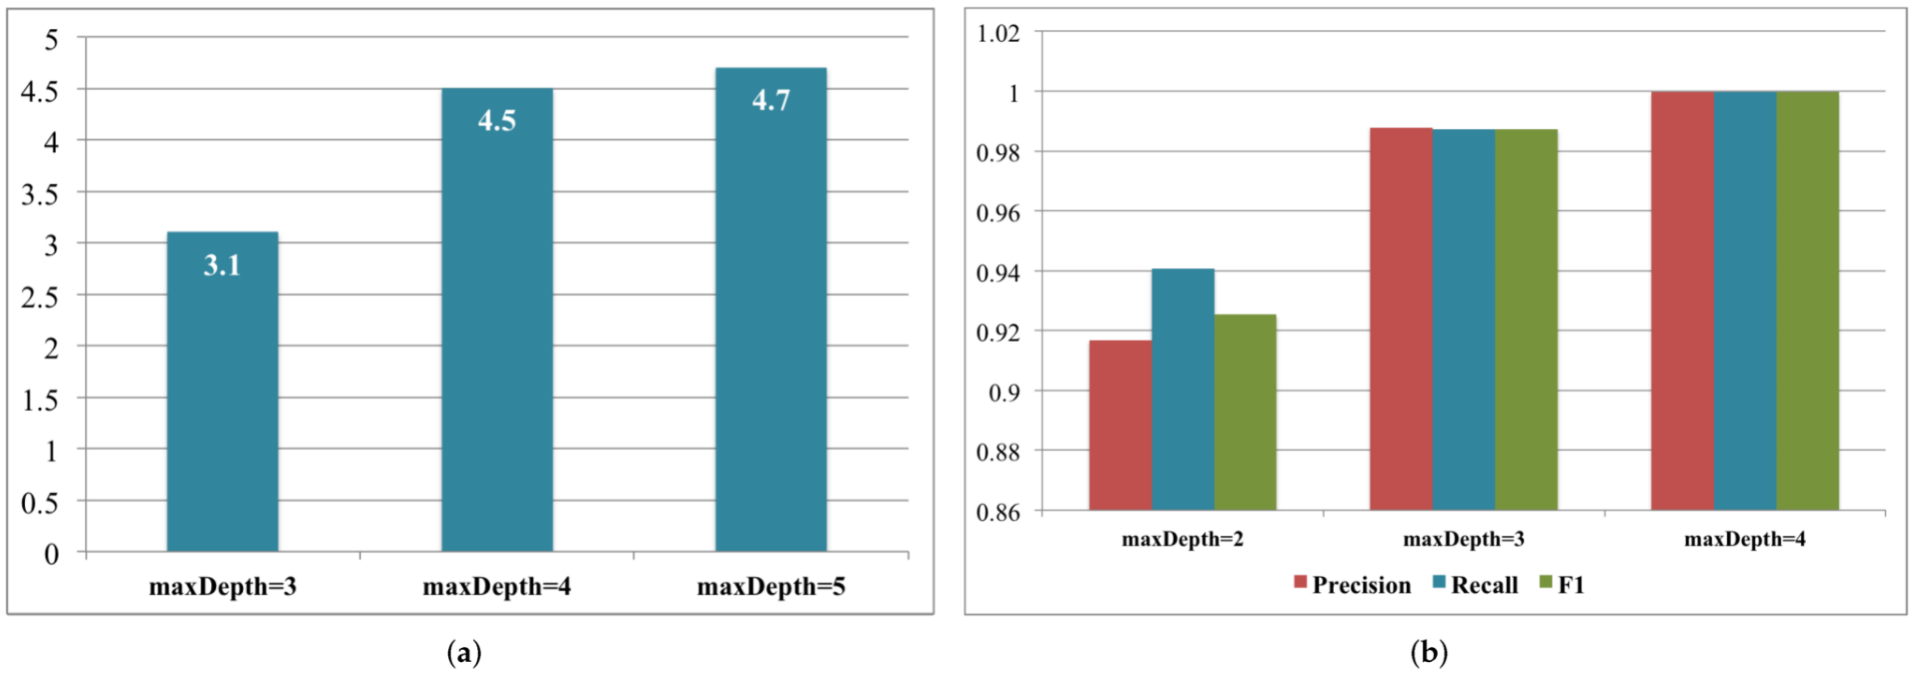
Model training: The classification of high blood pressure is based on Table 1. Researchers perform labeling by comparing the patient’s systolic and diastolic blood pressure to make the classification as follows.-
Label 0: systolic < 120 and diastolic < 80
-
Label 1: systolic ≥ 120 and diastolic ≥ 80
-
Label 2: systolic ≥ 140 and diastolic ≥ 90
-
Label 3: systolic ≥ 160 and diastolic ≥ 100
3.2. Brain Hemorrhage Diagnosis Support
Brain hemorrhage is a dangerous disease, being a type of stroke that can lead to death or disability. There are four common types of cerebral hemorrhage [27]: epidural hematoma (EDH), subdural hematoma (SDH), subarachnoid hemorrhage (SAH), and intracerebral hemorrhage (ICH). Hypertension is the most common cause of primary intracerebral hemorrhage. To detect the brain hemorrhage, doctors usually rely on the Hounsfield Units (HU) of the hemorrhage region in a CT/MRI image. Thus, researchers propose a diagnosis supporting system for brain hemorrhage detection and classification using HU values. The machine-learning algorithm to be used in the knowledge layer for this type of disease is deep learning, which is mentioned in this entry as Faster R-CNN Inception ResNet v2. Hounsfield unit represents different types of tissue on a scale of −1000 (air) to 1000 (bone). Table 3 illustrates different tissues with their HU density. The hemorrhagic region will have HU values in the range of 40 to 90. The HU values are calculated by Equation (1) with pvalue being the value of each pixel and rslope and rintercept being the values stored in CT/MRI images.| Matter | Density (HU) |
|---|---|
| Air | −1000 |
| Water | 0 |
| White matter | 20 |
| Gray matter | 35–40 |
| Hematoma | 40–90 |
| Bone | 1000 |
3.2.1. Training Phase
Preprocessing: The CT/MRI images will be converted into digital images (.jpg) according to the HU values. The location of brain hemorrhage is determined by HU values; thus, after preprocessing, researchers will have a digital images dataset with highlighted hemorrhagic regions. The hemorrhagic regions will be labeled with the supervision of specialists. Feature extraction: Researchers perform feature extraction using a pretrained CNN of Inception ResNet v2 as the backbone of the Faster R-CNN to reduce the computation time. This step helps to quickly classify brain hemorrhage. Model training: The extracted features are trained on Faster R-CNN. This training process is monitored with the Loss value. When the Loss value is not improved (or not decreased), researchers stop the training process. The Loss value of the model is very low (below 10%) after 60,000 training steps, as illustrated in Figure 8. This means that the error rate in the brain hemorrhage prediction of the proposed model is very low.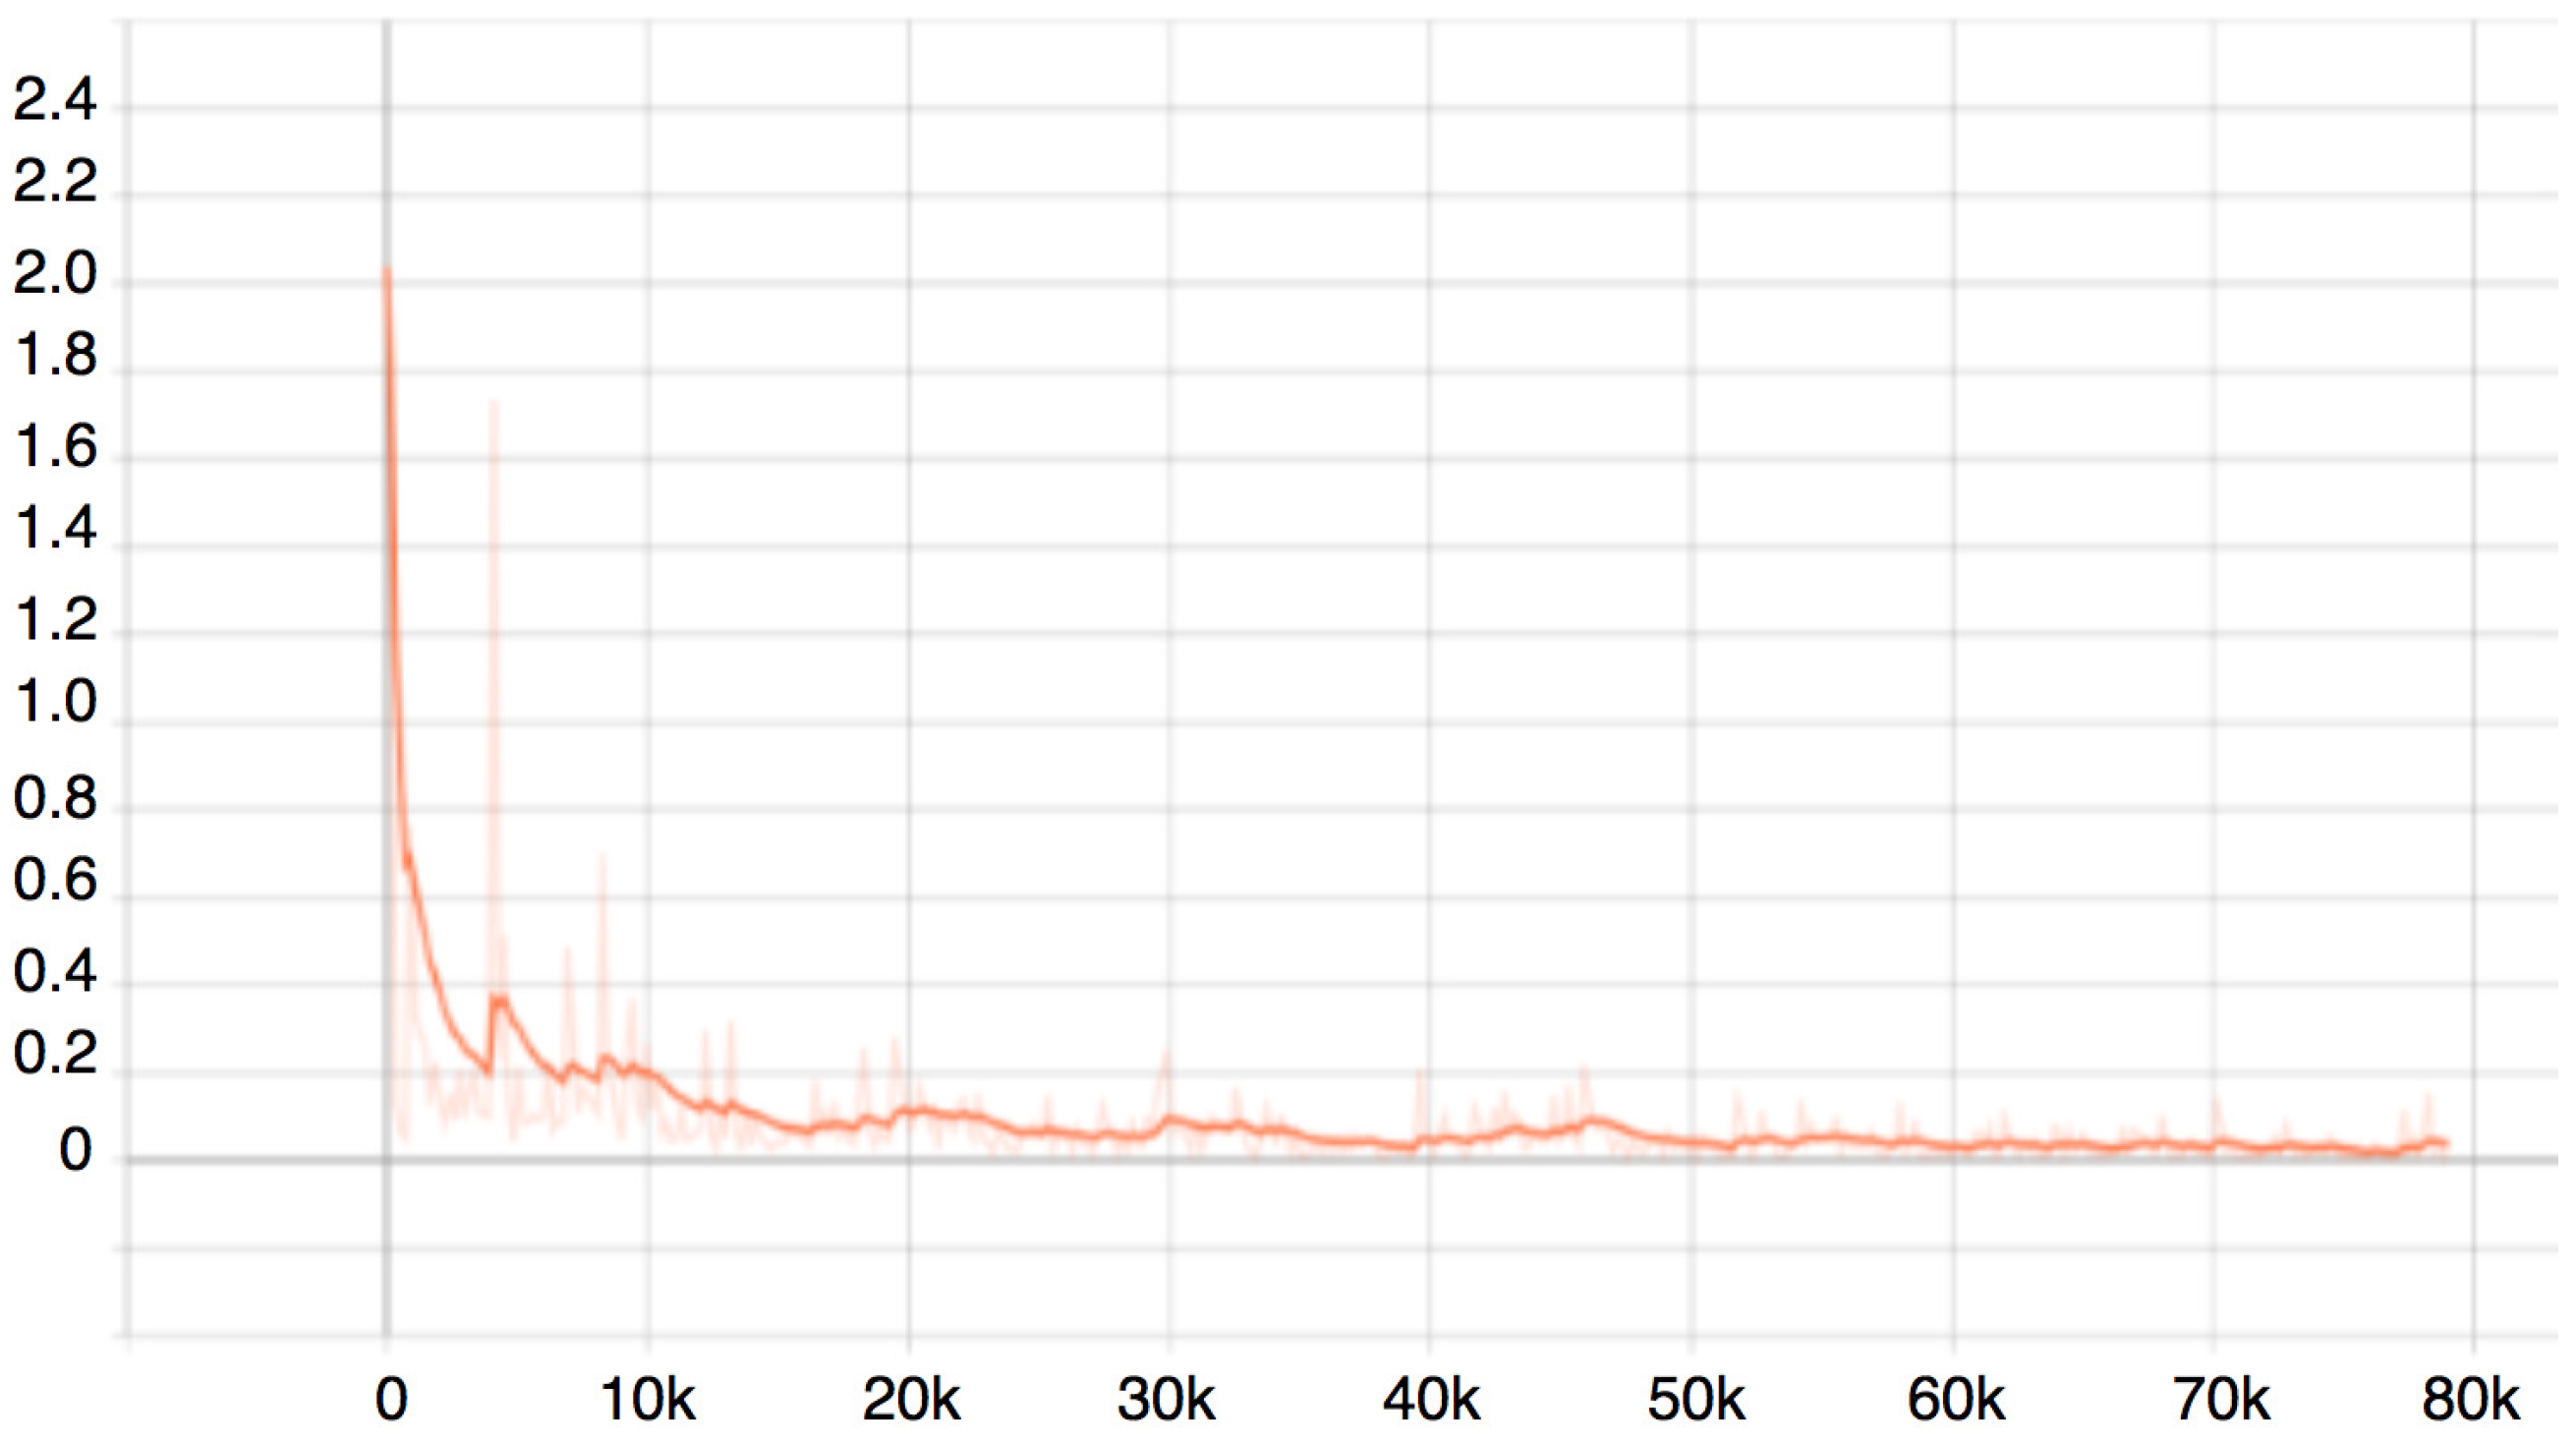
3.2.2. Testing Phase
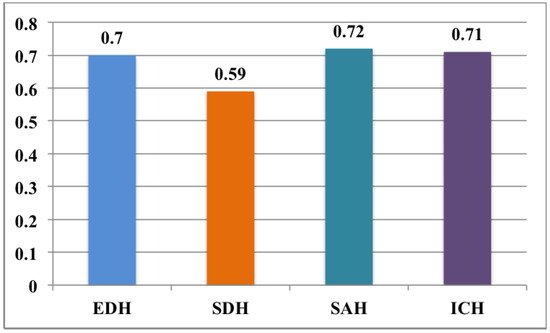
After the training process, researchers evaluate the proposed model for brain hemorrhage detection and classification on the test dataset. The preprocessing and feature extraction are also performed on the testing set before evaluating the model. The trained Faster R-CNN Inception ResNet v2 is then used to detect and classify four common types of brain hemorrhage. It can correctly detect the contours of entire hemorrhage regions with an accuracy of 100%. An example of multiple hemorrhages detection on an image is presented in Figure 9. It can predict bleeding time from 2 to 3 days, recognize hemorrhage type as ICH and SAH, and accurately segment bleeding regions.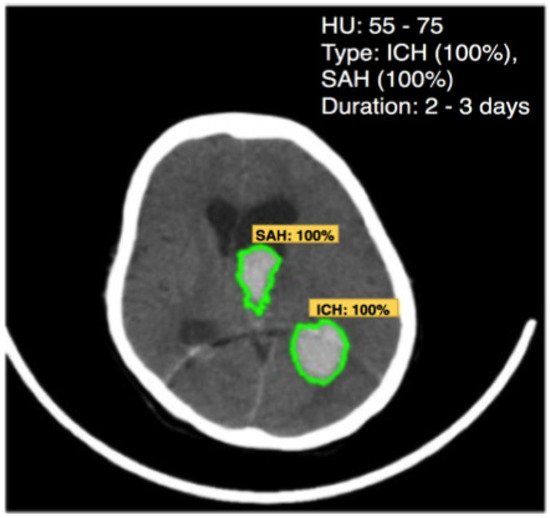
References
- Premier Healthcare Database being used by National Institutes of of Health to Evaluate Impact of COVID-19 on Patients Across the U.S . Premier. Retrieved 2022-5-12
- Benjamin I. Chung; Jeffrey J. Leow; Francisco Gelpi-Hammerschmidt; Ye Wang; Francesco Del Giudice; Smita De; Eric P. Chou; Kang Hyon Song; Leanne Almario; Steven L. Chang; et al. Racial Disparities in Postoperative Complications After Radical Nephrectomy: A Population-based Analysis. Urology 2015, 85, 1411-1416, 10.1016/j.urology.2015.03.001.
- Hoiwan Cheung; Ye Wang; Steven L. Chang; Yash S Khandwala; Francesco Del Giudice; Benjamin I. Chung; Adoption of Robot-Assisted Partial Nephrectomies: A Population-Based Analysis of U.S. Surgeons from 2004 to 2013. Journal of Endourology 2017, 31, 886-892, 10.1089/end.2017.0174.
- Chung, Kyung Jin and Kim, Jae Heon and Min, Gyeong Eun and Park, Hyoung Keun and Li, Shufeng and Del Giudice, Francesco and Han, Deok Hyun and Chung, Benjamin; Changing trends in the treatment of nephrolithiasis in the real world. Journal of Endourology 2019, 33, 248--253.
- Maryam Alavi; Dorothy Leidner; Review: Knowledge Management and Knowledge Management Systems: Conceptual Foundations and Research Issues. MIS Quarterly 2001, 25, 107-136, 10.2307/3250961.
- U. Of Maryland Maryam Alavi; Insead Dorothy Leidner; Knowledge Management Systems: Issues, Challenges, and Benefits. Communications of the Association for Information Systems 1999, 1, 7, 10.17705/1cais.00107.
- Brent Gallupe; Knowledge management systems: surveying the landscape. International Journal of Management Reviews 2001, 3, 61-77, 10.1111/1468-2370.00054.
- Fabian M. Suchanek; Gerhard Weikum; Knowledge bases in the age of big data analytics. Proceedings of the VLDB Endowment 2014, 7, 1713-1714, 10.14778/2733004.2733069.
- Begoli, E.; Horey, J. Design principles for effective knowledge discovery from big data. In Proceedings of the 2012 Joint Working IEEE/IFIP Conference on Software Architecture and European Conference on Software Architecture, 24 Aug 2012; pp. 215–218.
- Dong, X.; Gabrilovich, E.; Heitz, G.; Horn, W.; Lao, N.; Murphy, K.; Strohmann, T.; Sun, S.; Zhang, W. Knowledge vault: A web-scale approach to probabilistic knowledge fusion. In Proceedings of the 20th ACM SIGKDD International Conference on Knowledge Discovery and Data Mining, 2014; pp. 601–610.
- Nor’Ashikin Ali; Alexei Tretiakov; Dick Whiddett; Inga Hunter; Knowledge management systems success in healthcare: Leadership matters. International Journal of Medical Informatics 2016, 97, 331-340, 10.1016/j.ijmedinf.2016.11.004.
- Maramba, George and Coleman, Alfred and Ntawanga, Felix F; Causes of Challenges in Implementing Computer-Based Knowledge Management Systems in Healthcare Institutions: A Case Study of Private Hospitals in Johannesburg, South Africa. The African Journal of Information Systems 2020, 12, 4.
- Manogaran, G.; Thota, C.; Lopez, D.; Vijayakumar, V.; Abbas, K.M.; Sundarsekar, R. Big data knowledge system in healthcare. In Internet of Things and Big Data Technologies for Next Generation Healthcare; 2017; pp. 133–157.
- Le Dinh, T.; Phan, T.C.; Bui, T. Towards an architecture for big data-driven knowledge management systems. In Proceedings of the 22nd Americas Conference on Information Systems (AMCIS 2016), 2016; Association for Information Systems: USA, 2016.
- American Heart Association. What Is High Blood Pressure? South Carolina State Documents Depository: Washington, DC, USA, 2017; pp. 1–2.
- Chobanian, A.V.; Bakris, G.L.; Black, H.R.; Cushman, W.C.; Green, L.A.; Izzo, J.L., Jr.; Jones, D.W.; Materson, B.J.; Oparil, S.; Wright, J.T., Jr.; et al. Seventh report of the joint national committee on prevention, detection, evaluation, and treatment of high blood pressure. Hypertension 2003, 42, 1206–1252.
