Laxogenin C (LGC) is a natural spirostanol deriving from plant hormone which has shown anti-inflammatory, antibacterial, and growth-regulating activities.
Laxogenin C (LGC) is a natural spirostanol deriving from plant hormone which has shown growing regulation similar to those of brassinosteroids.
- plant growth regulator
- Laxogenin C
- Metabolism
- LC-MS/MS
- metabolomics
1. Introduction
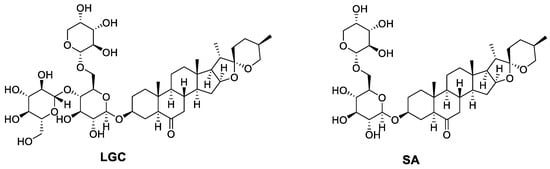
Laxogenin C is a class of natural product steroid glycosides, which is derived from laxogenin. It has the same active functional group as the plant hormones brassinosteroids and therefore shares similarities in their physiological activity with brassinosteroids. Its chemical name is laxogenin-3-O-β-D-glucopyranosyl- (1→4)-[α-L-arabinopyranosyl- (1→6) ]-β-D-glucopyranose. Its chemical formula is C44H70O18 and its structure is shown in Figure 1.
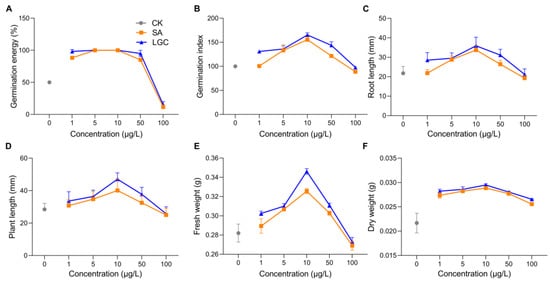
Plant growth regulators (PGRs) are special chemicals that regulate (promote or inhibit) the growth and development of plants at very low dosages [1], which play no phytotoxic roles. There have been a variety of PGRs successfully used in agriculture, and new types of plant hormones, including brassinosteroids (BRs). They are attractive due to their involvement in many physiological procedures and abilities to promote seed germination [2] and plant growth [3,4], enable plants to resist the harsh living environment [5], and facilitate pesticide metabolism [6]. Thus, PGRs, especially those with new scaffolds, need deep insights into their functions and mechanisms where the yield and quality of vegetable products are increased and higher planting efficiency is achieved.2. Tomato Growth Responding to LGC and SA Regulation
23. HistorLC-MS/MS Metabolome Analysis
Laxogenin C was first isolated from the rhizomes of Smilax sieboldii by Kubo et al [1]. At the same time, it was also isolated from the rhizomes of Smilax lebrunii by Jia and Ju [2]. It was also isolated from the bulbs of Allium chinense by Jiang et al [3] and the stem of Smilax scobinicaulis by Zhang[4]. Studies have shown that it has some bioactivities on both animals and plants. It has anti-inflammatory activity and antinociceptive effect. It regulates plant growth in a dose-dependent manner, promoting seed germination, seedling growth and increasing crop and fruit yield at low concentrations and inhibiting them at high concentrations. Spraying laxogenin C also alleviates the harm of drought stress on seedlings.
Kim et al.[5] found that showed laxogenin C had anti-inflammatory activity to inhibit ear edema.
Suh et al.[6] found that GABAB, and non-NMDA receptors located at the supraspinal level may play important roles in the production of antinociception induced by laxogenin C administered supraspinally. Furthermore, laxogenin C administered supraspinally may produce its antinociception by activating descending noradrenergic- but not opioidergic- and serotonergic-neurons.
Guo et al. [7]found that laxogenin C significantly promoted seed germination and seedling growth of rape.
Wang et al. [8]found that laxogenin C promoted seed germination and seedling growth and increased biological yield in maize. Laxogenin C could increase plant height, leaf width, leaf length, and biological yield of maize seedlings to different degrees.
Ma et al. [9] found that laxogenin C improved seed germination and seedling growth of watermelon. The concentration of laxogenin C varies, resulting in different sites of action, the indicators of improvement are also different. For example, different concentrations of Laxogenin C improve the weight of the roots or overground parts, respectively.
Ma et al.[10] found that moderate concentrations of laxogenin C had the positive effect on seed germination and seedling growth of radish, black bean and etchling. Besides, laxogenin C also increased their overground biological yield and the content of Vitamin C effectively. It showed that the suitable concentration of laxogenin C had a certain application value in the production of sprout vegetable.
Zhou and Zhang [11] found that spraying laxogenin C at the elongation-flowering stage coordinated yield components of winter wheat and increased the photosynthetic rate, consequently improved the winter wheat grain yield and quality.
Ding et al. [12]found that spraying exogenous laxogenin C alleviated the harm of drought stress on seedling by accumulating osmotic substances, increasing activity of antioxidant enzymes, removing peroxide, and enhancing photosynthetic ability.
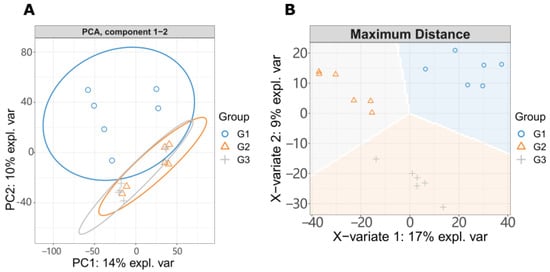
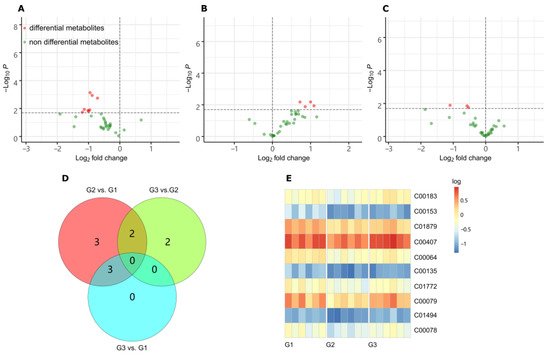
To observe the changes of metabolites with the increase of LGC concentration, we created three groups for metabolome investigation, including a blank (G1), low dose treated group (G2), and a high dose group (G3). We first analyzed the effect of LGC on the overall metabolome of tomato seedlings (Solanum lycopersicum, sly). As shown in Figure 3A, the PCA diagram indicated that LGC had a limited effect on the overall metabolome with a total difference of 24% in both vertical and horizontal directions. The sPLS-DA plot (Figure 3B) showed that the three groups of samples occupied relatively independent spaces, and the three groups of detected ions were distinguished. These differences of metabolome indicated can be explored further.3
4. NePathw discoveries
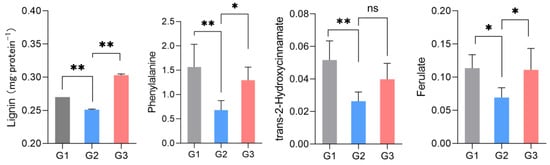
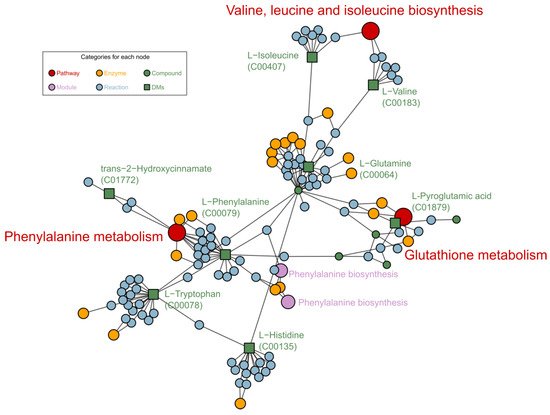
Metabolomic analysis revealed that the most significant metabolites regulated by laxogenin C in tomato were l-phenylalanine, nicotinamide and tryptophan. The most significant metabolic pathways regulated by laxogenin C were phenylalanine metabolism, alanine, aspartate and glutamate metabolism, tryptophan metabolism, phenylpropanoid biosynthesis and phenylalanine, tyrosine and tryptophan biosynthesis. Laxogenin C can affect the lignin content to a certain extent, thus regulating plant growth.
4ays Responding to LGC Regulation
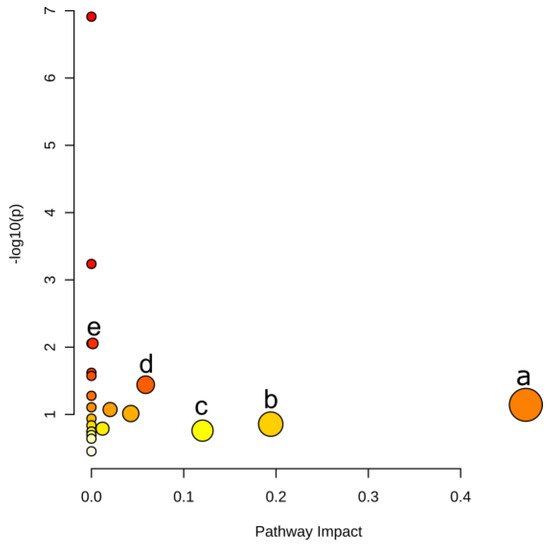
| Pathway | –logP | Impact | Matched Features |
|---|---|---|---|
| Phenylalanine metabolism | 1.14 | 0.470 | l-phenylalanine (C00079) |
| Alanine, aspartate and glutamate metabolism | 0.86 | 0.194 | l-glutamine (C00064) |
| Tryptophan metabolism | 0.76 | 0.120 | l-tryptophan (C00078) |
| Phenylpropanoid biosynthesis | 1.44 | 0.059 | l-phenylalanine (C00079); ferulate (C01494) |
| Phenylalanine, tyrosine and tryptophan biosynthesis | 2.05 | 0.002 | l-phenylalanine (C00079); l-tryptophan (C00078) |
5. APhenotypple Verification
The invention of Zhang et al. discloses a patent for a plant growth regulator containing laxogenin and its derivatives that are pollution-free and environmentally friendly. Laxogenin and its derivatives come from medicinal plant resources and belong to the endogenous natural metabolites of plants, which can be absorbed and metabolized easily by plants, so it will not adversely affect the ecological environment or cause human health and safety problems, and is a non-toxic and non-polluting technology that meets the needs of green agriculture, low cost, high stability and wide range of applications.
5. Current status
The activity of brassinosteroids has been widely noted, such as promoting plant growth and enhancing plant resistance to abiotic stresses. More and more studies have proved the great potential of brassinosteroids in agricultural applications. Synthesis of brassinosteroids and their analogues has been started in the United States, Japan, China and other countries, which have been widely used in agricultural production. It was demonstrated that laxogenin C had biological activity on a variety of plants and was widely used in crops, vegetables and fruits. Studies have shown that laxogenin C promoted seed germination and seedling growth, increased biological yield of crops, enhanced photosynthesis, improved crop quality, increased nutrition and improve the taste of fruits and vegetables, and also enhanced plant resistance to abiotic stresses. The study of laxogenin and laxogenin provides a new way to extract analogues with brassinosteroids activity from plants.