Plastic pollution in the world is widespread and growing. The environment is swamped with nanoplastics (<100 nm), and the health consequences of these less visible pollutants are unknown. Furthermore, there is evidence that microplastics can release nanoplastics by digestive disintegration, implying that macroplastic exposure can cause direct and indirect disease via nanoplastics. Nanoplastics enters an organism through the respiratory and gastro-intestinal tract where they accumulate into the liver through blood circulation via absorption, or epidermal infiltration. It is stated that macroplastics can cause damage directly at the site of exposure, whereas nanoplastics can influence the liver, causing subsequent damage to other organs. Multi-organ dysfunction is brought on by liver changes, and nanoplastics can readily enter the gut-liver axis and disturb the gut microflora.
- nanoplastics
- hepatic glucose metabolism
- lipid peroxidation
- metabolic dysfunction
- gut-liver axis
1. Introduction
2. Pathways Involved in Liver Metabolism
NPs of diameter <100 nm have had particular attention in the science field and are commonly used in studies, because they are internalized by cells more than larger particles [25][31]. Evidence has indicated that the liver and kidneys are major accumulation sites, as well as vital organs for the metabolism and clearance of nanomaterials [26][32]. The accumulation of polystyrene nanoplastics (PS NPs) in the liver and kidneys of mice has been documented, and exposure to NPs induced evident morphological and functional changes in these two organs, suggesting the importance of investigating the impact of NPs on liver and renal cells [27][28][29][33,34,35]. The majority of total glucose disposal happens in insulin-independent tissues, with roughly 50% occurring in the brain and 25% occurring in the splanchnic region (liver and the gastrointestinal tissues) [30][36]. The release of glucose from the liver closely matches glucose use, which averages around 2.0 mg/kg/min [31][37]. The majority of glucose elimination in the body happens in muscle tissue after consuming a glucose-containing meal [32][38]. Glucose homeostasis is dependent on three interconnected processes: pancreatic insulin secretion, stimulation of glucose uptake by splanchnic (liver) and peripheral tissues, and inhibition of hepatic glucose output [33][39]. Adipose tissue accounts for only 4%–5% of total body glucose elimination, which plays a critical role in maintaining whole body glucose homeostasis [34][40]. Pathways involved in liver metabolism related to muscles and adipose tissue are also mentioned (Figure 1).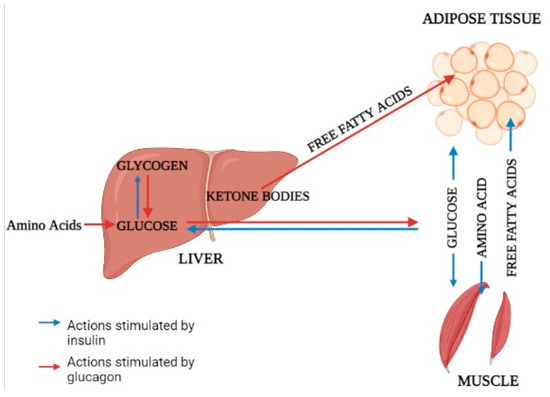
2.1. Glucose Metabolism
In humans, muscle is the principal location of glucose excretion. Once in the cell, glucose can be converted to glycogen or enter the glycolytic pathway [35][41]. Because obesity and diabetes are the two most prominent risk factors for the development of liver disorder, the presence of one or both of them can explain some of the peripheral insulin resistance IR [36][37][42,43]. Glucose disposal is reduced by about 50% in nondiabetic patients compared to normal people, a level comparable to type-2 diabetes mellitus (T2DM) [38][44]. The fact that there is no difference in glucose disposal between normal and overweight patients shows that the problem is not solely connected with improper glucose regulation and/or excess fat accumulation [39][45]. From fatty liver to nonalcoholic steatohepatitis (NASH), glucose utilization in muscle deteriorates progressively, and hyperinsulinemia are not secondary to a decrease in hepatic insulin extraction [40][41][42][46,47,48].2.2. Glucose Output
After an overnight fast, a healthy person’s liver produces glucose at a rate sufficient to meet the needs of the brain [43][51]. The variability of basal human glucose output (HGO) in nondiabetic persons is mostly determined by the amount of lean body mass and the degree of peripheral insulin use [44][45][46][52,53,54]. HGO is suppressed by insulin released into the portal vein following glucose or meal consumption. Hepatic IR occurs when the liver fails to detect this signal [46][54]. The glucose produced by the liver can come from glycogenolysis or gluconeogenesis [47][55]. Insulin suppresses HGO either directly through the hepatic insulin receptor or indirectly by reduced production of gluconeogenic substrates (e.g., alanine, lactate, glycerol, and free fatty acids) in both muscle and liver [48][49][56,57].2.3. Lipolysis and Lipid Oxidation
Aside from muscle and liver, adipose tissue is the third metabolically significant site of insulin action. Whereas insulin-stimulated glucose disposal in fat tissue is minor in comparison to that in muscle, regulation of lipolysis with subsequent release of glycerol and free fatty acids (FFAs) into the bloodstream has significant implications for glucose homeostasis [34][50][40,58]. Increased availability and utilization of FFAs aid in the development of skeletal muscle IR by inhibiting substrate oxidation competitively [51][59]. According to recent 1H nuclear magnetic resonance studies, an increase in intracellular fatty acid metabolites impairs IRS-1 tyrosine phosphorylation, resulting in decreased PI3-kinase activity and glucose transport [52][60]. Free fatty acids (FFAs) stimulate key enzymes and provide energy for gluconeogenesis, while glycerol released during triglyceride hydrolysis acts as a gluconeogenic substrate.2.4. Fatty Acid Metabolism and Energy Supply
The Krebs cycle oxidizes acetyl-coenzyme A (CoA), resulting in reduced forms of nicotinamide adenine dinucleotide (NADH) and reduced flavine-adenine dinucleotide, which transport electrons to the MRC [53][64]. AMPK promotes glucose and fatty acid oxidation while also activating PGC-1a [53][54][64,65]. PGC-1a interacts with peroxisome proliferator-activated receptor a (PPARa) to promote the production of numerous fatty acid-metabolizing enzymes, including carnitine palmitoyltransferase 1 (CPT1) and acyl-CoA dehydrogenases, hence enhancing fatty acid b-oxidation in mitochondria [55][56][57][58][66,67,68,69].2.5. Mitochondrial Damage
The TCA cycle is essential for cellular energy metabolism because it provides energy for cellular respiration [59][75]. In one study, NP-treated L02 cells had higher levels of some endogenous indicators of the TCA cycle, such as malate, and lower levels of others, such as fumarate. The effects of 80 nm NPs on mitochondrial activities and metabolic pathways in normal human hepatic (L02) cells were studied. NP did not cause widespread cell death. However, transmission electron microscopy analysis revealed that the NPs could enter the cells and cause mitochondrial damage, as evidenced by increased production of reactive oxygen species in the mitochondria, changes in the mitochondrial membrane potential, and suppression of mitochondrial respiration.2.6. Protein and Urea Metabolism
Among the three key dietary categories of protein, lipids, and carbohydrates, protein metabolism is crucial for the production of albumin and prothrombin as well as for the detoxification of ammonia. When these mechanisms are addressed in nutrition treatment for liver cirrhosis, they affect the development of hepatic encephalopathy and the hepatic functional reserve, leading to an imbalance in branched-chain amino acid (BCAA) insufficiency, reduced albumin synthesis, and elevated blood ammonia concentrations [60][82]. The primary reason of BCAA shortage in liver cirrhosis patients is an increase in ammonia metabolism in the skeletal muscles [61][83].2.7. Ethanol Metabolism
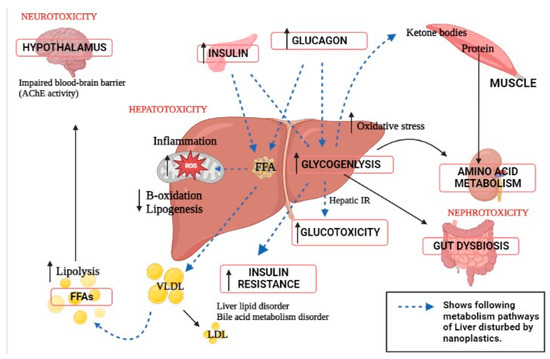
There are at least three different categories of ethanol’s metabolic effects: those brought on by changes in metabolite pools and cofactors brought on by the ethanol’s metabolism, those brought on by neuroendocrine issues brought on by intoxication, and those brought on directly by the pharmacological effects of ethanol on particular cells and processes. These numerous sorts of effects have varying degrees of contribution in practically every significant domain of metabolism. The apparent discrepancies about the metabolic effects of ethanol frequently result from variations in experimental setups that affect how much each of these components contributes [61][62][83,84].3. Impact of Nanoplastics on Liver Metabolism Causing Multi-Organ Dysfunction
The liver, a central metabolic organ, alters lipid metabolism in response to harsh environmental conditions [63][91]. Pathways involved in liver metabolism and neighboring organ dysfunction due to nanoplastics toxicity are presented (Figure 2). After being exposed to 100 ppm of PS-NPs, Lu et al. (2016) discovered that huge volumes of lipid droplets developed in the liver of the zebrafish Danio rerio [64][92]. As reported, it showed greater hepatic inflammation. According to the findings, dietary exposure to PS-NPs increased oxidative stress and interfered with lipid metabolism. Furthermore, after NP exposure, the crude lipid content of turbot Scophthalmus maximus and black rockfish Sebastes schlegelii livers increases dramatically [65][66][93,94]. An in vitro experiment revealed that NPs bind to apolipoprotein A-1 in fish serum, limiting lipid utilization [67][68][95,96]. According to a study, after PS NPs exposure, the liver TG and lipid content were considerably greater than in the control group. In fed fish, mRNA expression of the lipid synthesis-related gene fas and lipid transport-related genes such as cd36 and fatp1 increased considerably [69][97]. The mRNA expression of lipid catabolism-related genes such as ppar and aco increased initially and then declined as PS NP concentrations increased. PS NPs were found to boost the expression of genes involved in lipid production and catabolism in hepatocytes in the short term [70][98]. The trans-generational effect showed fabp10a expression in larval livers in a dose- and size-dependent manner. The 50 nm PS-NPs of 0.1ppm concentration raised fabp10a expression in the larval liver by 21.90%. These impacts’ potential mechanisms are dependent on their distribution and the formation of reactive oxygen species in the larvae. NPs also stimulate steroid hormone biosynthesis in zebrafish larvae, which may result in immune-related disorders [71][72][99,100].