 +1 credit
| Version | Summary | Created by | Modification | Content Size | Created at | Operation |
|---|---|---|---|---|---|---|
| 1 | Veronique Michaud | + 4767 word(s) | 4767 | 2021-05-11 10:01:40 | | | |
| 2 | Conner Chen | Meta information modification | 4767 | 2021-05-12 12:17:27 | | | | |
| 3 | Peter Tang | Meta information modification | 4767 | 2021-10-11 02:56:33 | | |
Video Upload Options
The most frequent form of diabetes is type 2 diabetes mellitus (T2DM) which is often part of a metabolic syndrome (hyperglycaemia, hypertension, hypercholesterolemia, abdominal obesity) that usually requires the use of several medications from different drug classes to bring each of these conditions under control. T2DM is associated with an increase in inflammatory markers such as interleukin-6 (IL-6) and the tumor necrosis factor alpha (TNF-α). Higher levels of IL-6 and TNF-α are associated with a downregulation of several drug metabolizing enzymes, especially the cytochrome P450 (P450) isoforms CYP3As and CYP2C19. A decrease in these P450 isoenzymes may lead to unexpected rise in plasma levels of substrates of these enzymes. It could also give rise to a mismatch between the genotypes determined for these enzymes, the predicted phenotypes based on these genotypes and the phenotypes observed clinically. This phenomenon is described as phenoconversion. Phenoconversion typically results from either a disease (such as T2DM) or concomitant administration of medications inducing or inhibiting (including competitive or non-competitive inhibition) a P450 isoenzyme used by other substrates for their elimination. Phenoconversion could have a significant impact on drug effects and genotypic-focused clinical outcomes.
1. Background
Diabetes is a complex metabolic disorder affecting the glycemic status of the human body. According to the World Health Organization (WHO), “Diabetes is a chronic, metabolic disease characterized by elevated levels of blood glucose, which leads over time to serious damage to the heart, blood vessels, eyes, kidneys and nerves. The most common is type 2 diabetes, usually in adults, which occurs when the body becomes resistant to insulin or doesn’t make enough insulin.” [1][2]. Indeed, more than 90% of individuals with diabetes worldwide have type 2 diabetes mellitus (T2DM). The estimated worldwide diabetes prevalence for 2010 was 285 million individuals while, by 2030, the number of individuals with diabetes will rise to 438 million; that is 1 in every 11 adult persons is expected to be diagnosed with T2DM [1][3].
It is generally considered that T2DM is part of a metabolic syndrome (hyperglycemia, hypertension, hypercholesterolemia, abdominal obesity) that usually requires the use of several medications from different drug classes to bring each of these conditions under control (often 8 to 10 drugs; polypharmacy) [4][5]. Many effective oral therapies are available to treat T2DM, including sulfonylureas, meglitinides (i.e., non-sulfonylurea insulin secretagogues), biguanides, thiazolidinediones, α-glucosidase inhibitors, and dipeptidyl peptidase-4 inhibitor [1][6]. However, response to T2DM oral therapies exhibits high inter-subject variability. Indeed, large variability in drug disposition and effects, including glycemic control, or incidence of adverse drug events (ADEs) is observed among patients receiving the same treatment options [7][8][9]. Accordingly, the American Diabetes Association recommends that each oral antidiabetic medication be individualized while taking into consideration drugs’ effectiveness and tolerability [10].
Chronic hyperglycemia related to diabetes is associated with end organ failure. For instance, T2DM is associated with several micro- and macrovascular complications where macrovascular complications such as retinopathy, nephropathy, coronary artery disease, peripheral vascular disease, stroke and neuropathy account for more than 59% of deaths in these patients [11]. T2DM, nonalcoholic fatty liver disease (NAFLD) and cardiovascular disease usually coexist with a prevalence of 70% in T2DM patients. NAFLD increases the incidence of T2DM and expedites the progress of complications later in life [12][13]. Epidemiological studies have shown an increased risk of cardiovascular complications with fasting blood glucose levels of hemoglobin A1C (HbA1c) just above the normal range (7.0%) [14][15]. It has also been shown that achieving specific glycemic goals can substantially reduce the risk of both developing micro- and macrovascular complications and morbidity. In long-term follow-up, a 1% reduction in mean HbA1c was associated with 14% lower risk of myocardial infarction [11][16][17]. Hence, the clinical practice guidelines of the American Diabetes Association recommend that T2DM treatment should aim for an HbA1c ≤ 7.0% [18]. To achieve this goal, pharmacologic treatments (one or more antidiabetic drugs) are ultimately needed in most T2DM patients along with diet and exercise.
Variability in the drug response has been observed in T2DM patients, implying that some T2DM patients appear resistant to some drugs while others are more sensitive to other drugs. Variability in the systemic exposure to medications is a major determinant of interindividual variability in drug response [19]. Inter-subject variability in the metabolism of these drugs is a major factor, among several others, that may influence their pharmacokinetics.
The cytochrome P450 (P450) superfamily is a major enzymatic system that functions mainly as a monooxygenase [20]. P450s are membrane-bound hemoproteins that play an important role in the metabolism of drugs and other xenobiotics [21][22]. Amongst P450s found in humans, CYP1A2, CYP2B6, CYP2D6, CYP2E1, CYP2C9, CYP2C19, CYP3A4 and CYP3A5 are involved in the metabolism (oxidation) of 70–80% of approved drugs [23]. Large interindividual variability in P450 activities has been observed especially for CYP3A (40-fold), CYP2D6 (100-fold), CYP2B6 (50-fold) and CYP2C9 (40-fold) [24][25][26]. Hence, modulation of the expression or activity of P450 enzymes leads to changes in drug disposition which may subsequently affect pharmacodynamic response.
P450 expression and/or activity is controlled by several intrinsic and extrinsic factors such as genetics, environment, concomitant medications, and inflammatory markers [23]. On one hand, phenotypic P450 activity is determined by quantifying specific metabolic clearance pathways following the administration of probe drug substrates. On the other hand, genetic polymorphisms are observed for several P450 isoenzymes, and genetic testing could help predict P450 activity and patients’ phenotypes [27][28]. In some cases, there is a mismatch between the phenotype predicted from genotyping results and the actual phenotype observed in a patient. This phenomenon is called phenoconversion. The majority of P450 metabolizing enzymes can be subjected to phenoconversion due to multiple factors such as the use of certain medications (e.g., inhibitors, inducers), diet, smoking, age, disease conditions, and inflammatory status [29]. Growing evidence suggests that increased exposure to certain proinflammatory cytokines may regulate the expression of certain P450 enzymes leading to a temporary phenoconversion. For example, some studies reported clinical evidence of genotype–phenotype mismatches for CYP2C19 in patients with cancer, hepatitis, and infection associated with severe inflammation [30][31][32][33][34]. Chronic inflammatory conditions observed in patients with cardiac failure, arthritis, renal failure and T2DM could also lead to phenoconversion. Henceforth, phenoconversion may be the explanation behind inconsistent results assessing drug response in pharmacogenetic studies using genetic results, not phenotype, as the primary predictive variable [35].
2. T2DM as an Inflammatory Disease
Multiple hypotheses have been asserted pertaining to underlying causes and pathogenicity of diabetes. T2DM is associated with risk factors that are both unmodifiable (e.g., genetic predisposition, ethnicity, ageing, and history of gestational diabetes) and modifiable (e.g., sedentary lifestyle, obesity, unhealthy diet, physical inactivity, and smoking) [36][37]. Interestingly, there is increasing evidence that several of the modifiable risk factors listed above may activate inflammatory pathways leading to insulin resistance and T2DM [38].
It has been shown that patients with T2DM have increased levels of interleukin-6 (IL-6). This multifunctional cytokine exhibits diabetogenic effects where it stimulates the release of adrenocorticotropic hormone (ACTH) from the pituitary gland which could lead to hyperglycemia [39][40]. Many studies have indicated that the tumor necrosis factor alpha (TNF-α) may affect insulin action thus leading to the development of diabetes [41][42][43]. In animal models, a study by Hotamisligil et al. correlated T2DM to inflammation and demonstrated the role of TNF-α with obesity and insulin resistance [44]. Tuttle et al. and others have shown that both IL-6 and TNF-α levels are significantly increased in diabetic patients compared to non-diabetic patients [45][46]. Increased levels of inflammatory cytokines have also been associated with the progression and complications of T2DM in both human and animal models [38][47][48]. Targeting inflammation, by the identification of pathways that connect inflammation to T2DM, can help treat and prevent T2DM as well as improve risk stratification by using inflammatory markers as potential indexes [49].
Hyperglycemia per se increases levels of IL-6 and is associated with increased risks of T2DM associated morbidity and mortality [50]. In addition to IL-6 and TNF-α, plasma levels of other inflammatory markers including fibrinogen, serum sialic acid, α1-glycoprotein acid, plasminogen activator inhibitor, C-reactive protein and cortisol are also reported to be increased in patients with T2DM [51][52][53][54].
Under inflammatory conditions such as T2DM, proinflammatory cytokines are not only produced locally in disease-targeted organs but also can circulate through the body affecting distal organs. Cytokines can alter the activities of numerous transcription factors affecting the regulatory pathways of various proteins including drug metabolizing enzymes. The weight of evidence gathered, both in animal and clinical studies, suggests that the regulation of drug metabolizing proteins, such as P450s, would be interconnected with the T2DM inflammation-related disease. Hence, the disposition of drugs metabolized by various P450 enzymes may be affected by inflammatory conditions such as T2DM. A potential phenoconversion can be expected leading to interindividual differences in drug plasma levels and response.
3. P450 Regulation and Inflammation
Drug metabolizing enzymes such as P450s are regulated at transcriptional and post-transcriptional levels [55]. Regulation of P450 mRNA levels by factors such as transcription factors such as the nuclear receptor pregnane X receptor (PXR) and its dimerization with retinoid X receptor (RXR), is responsible for the observed downregulation of P450 enzymes under inflammatory conditions [56]. Furthermore, it has been suggested that transcription factor nuclear factor-kappa B (NF-κB) could control the expression of several P450 enzymes through its interaction with the promotor region of their genes [56] (Figure 1).
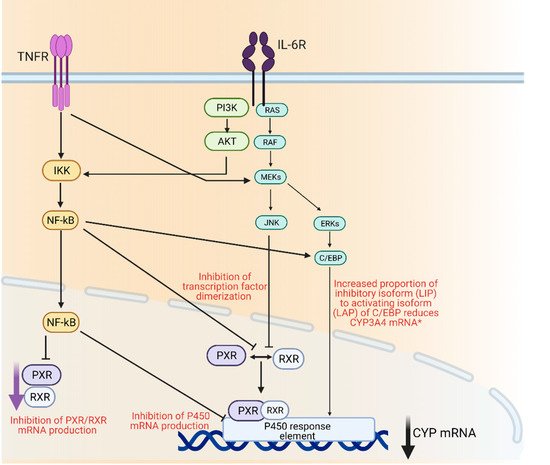
Figure 1. Mechanisms of cytochrome P450 regulation through inflammatory mediators IL-6 and TNFα. AKT; protein kinase B, C/EBP; CCAAT/enhancer-binding protein beta, ERK; extracellular signal regulated kinase, IKK; Iκβ kinase, IL-6R; interleukin 6 receptor, JNK; c-jun N-terminal kinase, MEK; mitogen activated protein kinase, Nf-κβ; nuclear factor kappa light chain enhancer of activate B-cells, PI3K; phosphoinositide 3-kinase, PXR; pregnane X receptor, RAF; rapidly accelerated fibrosarcoma kinase, RAS; small monomeric GTPas, RXR; retinoid X receptor, TNFR; TNFα receptor. Created with BioRender.com.
Other studies have demonstrated a correlation between P450 isoform expression levels and cytokines levels [56][57][58]. An in vitro study examined the effect of five pro-inflammatory cytokines IL-1β, IL-4, IL-6, TNF-α and interferon gamma (IFN-γ) on the expression of CYP1A2, CYP2C, CYP2E1, CYP3A in primary human hepatocyte cultures [59]. It was shown that IL-1β, IL-6 and TNF-α had a depressant effect on these P450 mRNA levels [60]. Decrease in mRNA levels was restored when cells were treated with CYP inducers. However, when hepatocytes were treated concomitantly with a CYP1A2 inducer (naphthoflavone) and TNF-α, or with a CYP3A4 inducer (rifampin) and IL-6, the magnitude of increase in CYP3A4 mRNA levels was reduced [61]. Similarly, activities of hepatic p450 isoenzymes (cyp1a, cyp2b and cyp2e) were significantly reduced when rats were injected with IL-6, IL-1β or TNF-α [62][63].
In a human study, a single injection of interferon alpha 2b (IFN-α2b) produced a significant decrease (20%) in the metabolism of erythromycin (CYP3As), as determined by the erythromycin breath test [64]. CYP3A4 down-regulation observed in patients with advanced cancer was suggested to be linked to the secretion of IL-6 originating from the tumor (as demonstrated in animal models) [65][66][67]. As P450 enzymes are expressed in various tissues in an isoform selective manner and as they can be selectively regulated by multiple cytokines, P450 isoenzyme expression and activities would be differentially regulated by different inflammatory diseases at different stages of progression.
4. Insulin and Glycemic Levels
Hypoglycemia is considered a stressful condition for the human body. Most diabetic patients receiving insulin suffer from episodes of hypoglycemia at least once per week, particularly after having narrow metabolic control in the management of their diabetes. In many studies, hypoglycemia was shown to downregulate cytokine production since cytokine production depends mainly on blood glucose levels [68][69]. According to de Galan et al., insulin-induced hypoglycemia downregulates TNF-α synthesis in a glucose concentration-dependent manner [70]. In that study, insulin effect was measured in non-diabetic and diabetic subjects where it was noticed that in non-diabetic subjects, hypoglycemia downregulated the production capacity of TNF-α. The production capacity of TNF-α was decreased in non-diabetic subjects compared to diabetic subjects at normoglycemia [70].
IL-6 and TNF-α are usually produced by several tissues such as leukocytes, adipocytes, and endothelial cells [71]. In T2DM, it is believed that these cytokines levels are further increased in a hyperglycemia state and that they originate from noncirculating cells, most likely endothelial cells [72]. It is important to note that hyperglycemia-induced oxidative stress leads to the activation of inflammatory gene expression where, according to Guha et al., there is a significant increase in TNF-α arbitrated by reactive oxygen species in cultured monocytic cells incubated with high concentrations of glucose [73].
In one study, the authors suggested that IL-6 and TNF-α show higher concentrations in patients with impaired glucose tolerance compared to those with normal glucose tolerance [72]. A positive association between IL-6 and TNF-α and insulin sensitivity has been reported previously [46], where IL-6 concentrations are negatively correlated with insulin action, while TNF-α is inversely correlated with insulin sensitivity in other studies [74][75].
5. P450, Inflammation and T2DM
Clinical trials have demonstrated that multiple factors such as gender, age, diet and drinking habits, concomitant medications and therapy effectiveness, complications from comorbidities, and diseases such as T2DM and diabetic progression, are contributing to variability in the expression and activity of P450s [76][77][78][79]. Changes in P450 expression and function by T2DM appear to be isoform- and tissue-specific [23].
5.1. Animal Studies
Protein expressions and activities are altered in animal models of T2DM; however, it must be noted that the way T2DM is induced in these animal models, either chemically, by diet or obesity-induced models, or in genetically engineered animals, could lead to different results on p450 mRNA and protein expression [80]. It is also important to note that chemical induction of T2DM in animals will alter and/or induce p450 pathways and that, although there is high conservation of p450 enzymes amongst species, the extent and catalytic activity between species differ substantially [81]. Nevertheless, a number of studies have reported a modulation of various p450 isoforms in rodent animal models including cyp1a1, cyp1a2, cyp2a1, cyp2b1/2, cyp2c6, cyp2c7, cyp3a1/2 and cyp2e1 expression [82][83][84][85]. A summary of alterations reported is presented in Table 1.
Table 1. Effect of T2DM in multiple models on the expression and activity of several P450 isoforms.
| Studies | n | P450s Studied | Effects (mRNA Protein, Activity) |
Drug/Probe Level Change | References |
|---|---|---|---|---|---|
| Animals | |||||
| Liver microsomes from STZ-induced diabetic rats | 6 | 1a1 | Protein levels increased | - | [85] |
| 2e1 | Protein levels increased 4-fold | - | |||
| 4a1 | Protein levels increased 2-fold | - | |||
| Liver microsomes from High-Fat diet (HFD) mice | 45 HFD vs. ND | 3a11/25 | Decreased activity and mRNA levels | Deceased rate of 1-OH-midazolam formation | [86] |
| 2c | Decreased activity and mRNA levels | Decreased rate of M1-repaglinide and OH-tolbutamide formation | |||
| 2b | Decreased activity and mRNA levels | Decreased rate of OH-bupropion formation | |||
| 2d | No change in activity and mRNA levels | No change in OH-bufuralol formation rate | |||
| Liver microsomes from STZ-induced diabetic rats | 12 | 3a2/1 | Protein levels increased 1.5 to 2.5-fold | Verapamil AUC decreased by 22% | [87] |
| Protein levels decreased by 67–32% | Decreased AUCnorverapamil/AUCverapamil by 62% | ||||
| STZ-induced diabetic rats | 18 | 1a2 | Increased activity | Lidocaine decreased levels 3.4-fold | [88] |
| Increased activity | Monoethyl-glycylxylidide (MEGX) increased levels/AUC 2.0 to 2.3-fold | ||||
| Alloxan-induced diabetic rats |
8 | 1a2 | mRNA levels and expression increased 3.4-fold | Oltipraz decreased AUC by 40% | [89] |
| 2b1 | mRNA levels and expression increased 1.9- fold | Oltipraz decreased AUC by 40% | |||
| 3a1 | mRNA levels and expression increased 1.6-fold | Oltipraz decreased AUC by 40% | |||
| Liver microsomes from Alloxan- induced diabetic rats | 8 | 1a2 | mRNA levels and expression increased | Omeprazole faster CLNR | [90] |
| Liver microsomes from STZ-induced diabetic rats | 4 | 1a2 | Increased protein levels | Antipyrine increased CL 1.5-fold | [91] |
| Liver microsomes from Alloxan-induced diabetic rats | 6 | 1a2 | mRNA levels and expression increased 3-fold | Theophylline decreased AUC by 26.1% | [83] |
| 2e1 | mRNA levels and expression increased 3-fold | Theophylline decreased AUC by 26% | |||
| Liver microsomes from Alloxan-induced diabetic rats | 6 | 1a2 | mRNA levels and expression increased 3-fold | 1,3-Dimethyluric acid (1,3-DMU) increased AUC by 110% | [83] |
| Liver microsomes from Alloxan-induced diabetic rats | 9 | 2c11 | mRNA levels and expression decreased | Diclofenac slower CLNR 1.3-fold and increased AUC 1.2-fold | [92] |
| Liver microsomes from STZ-induced diabetic rats | 7 | 2c11 | Protein levels and expression decreased by 20% | Glibenclamide increased AUC 5.8-fold | [93] |
| Alloxan-induced diabetic rats | 8 | 2c6 | Protein expression increased | Phenytoin increased CLNR | [94] |
| STZ-induced diabetic rats | 5 | 3a4 | Increased expression | Atorvastatin decreased AUC 1.7-fold | [95] |
| Liver microsomes from STZ-induced diabetic rats | 4 | 2e1 | mRNA level and expression increased | - | [85] |
| Liver microsomes from Zucker diabetic fatty rats | 6 | 4a1/2/3 | mRNA and protein levels increased 3-8-fold | - | [96] |
| In vitro | |||||
| Primary cultured rat hepatocytes | 6 | 2b | mRNA and protein levels increased 2-fold | - | [97] |
| 2e1 | mRNA and protein levels increased 5-fold | - | |||
| Human | |||||
| HLM from diabetic patients | 6 patients with T2DM vs. no T2DM | 3A4 | mRNA and protein levels decreased 1.5-fold | - | [20] |
| 2E1 | mRNA and protein levels increased 2.5-fold | - | |||
| HLM from Gestational diabetic patients | 9 patients with GDM vs. GDM with Glyburide | 2C9 | Decreased metabolism | Glyburide (decreased rate of metabolite formation) | [98] |
| Gestational diabetic patients | 6 patients with GDM vs. no GDM | 1A2 | Decreased expression | Lidocaine increased AUC 1.8-fold | [99] |
| 3A4 | Decreased expression | Lidocaine increased AUC 1.8-fold | |||
| Diabetic patients | 9 patients with T2DM vs. no T2DM | 3A4 | Decreased activity | Nisoldipine decreased CL 1.7-fold | [48] |
| HLM from diabetic patients | 6 liver samples from T2DM vs. no T2DM | 3A4 | Decreased expression | Atorvastatin lactone decreased CL | [20] |
| Diabetic patients | 7 patients with T2DM vs. no T2DM | 3A4 | Decreased expression | Cyclosporine decreased AUC | [100] |
| Diabetic patients | 225 kidney transplant T2DM patients vs. no T2DM | 3A4/5 | Decreased activity | Tacrolimus increased trough levels | [101] |
| Diabetic patients | 8 patients with T2DM vs. no T2DM | 1A2 | Increased activity | Theophylline increased CL | [102] |
| Diabetic patients | 57 patients with T2DM vs. no T2DM | 1A2 | Increased activity | Caffeine decreased plasma levels | [78] |
| Diabetic patients | 2C19 | Increased expression and activity | Clopidogrel decreased plasma levels | [103] | |
| Diabetic Patients | 35 patients with T2DM vs. 38 patients no T2DM | 1A2 | Increased Activity | C4 hr paraxanthine/C4 hr caffeine | [104] |
| 2C19 | Decreased Activity | Decreased AUC0-8 hr OH-omeprazole/AUC0-8 hr omeprazole 1.9-fold | |||
| 2B6 | Decreased Activity | Decreased Ae0-8 hr OH-bupropion/Ae0-8 hr bupropion by 18-fold | |||
| 3A | Decreased Activity | Decreased AUC0-8 hr OH-midazolam/AUC0-8 hr midazolam 1.6-fold | |||
Abbreviations: Ae; amount excreted unchanged in urine, AUC; area under the curve, C; concentration, CL; clearance; CLNR: non-renal clearance, GDM: gestational diabetes mellitus, OH: hydroxy-, T2DM: Type 2 Diabetes Mellitus, ND: normal diet. please note that human P450s are designated CYPXXX whilst animal p450s are designated cypxxx with lower cases characters.
The most common alteration noticed in chemically induced rodent T2DM models is the induction of cyp2e1, where it is induced almost eight-fold in streptozocin (STZ)-induced diabetic rats [105]. This has been explained by different mechanisms. First, increased ketone bodies by post translational stabilization of the enzyme by high ketone levels [106][107]. Second, by insulin secretion which does not only decrease cyp2e1 gene transcription but also decreases mRNA half-life [108]. This induction can be suppressed by insulin administration, suggesting that insufficient insulin levels could lead to the induction of cyp2e1 [66][82][107][109]. Lastly, regarding decreased growth hormones levels, as T2DM suppresses growth hormone release, this, in turn, can also contribute to cyp2e1 induction through mRNA stabilization or increased transcription [110]. In support of the role of insulin, others have observed that cyp2e1 and cyp2b expression are decreased in primary cultured rat hepatocytes exposed to insulin [97]. In contrast, cyp2e1 mRNA levels and activity were not significantly modulated in a T2DM model from diet-induced obesity in mice [86].
Induction of cyp1a2 was also observed in STZ diabetic rats. Cyp1a2 induction by T2DM resulted in lower verapamil and lidocaine (which are partially metabolized by cyp1a2) area under the curve (AUC) of drug plasma concentrations in STZ diabetic rats [88][87]. In alloxan-induced diabetic rats, induction of cyp1a2 resulted in lower AUC of oltipraz and higher clearance of antipyrine [91][89]. Theophylline is metabolized through cyp1a2 and cyp2e1 to 1,3-dimethyluric acid. In alloxan diabetic rats, it was also shown that T2DM increases the expression of both p450 isoforms resulting in lower theophylline AUC and thus higher 1,3-dimethyluric acid plasma levels [83].
STZ-induced T2DM animal models have been shown to significantly lower the expression of cyp2c11, resulting in decreased metabolism of diclofenac, glibenclamide and nateglinide [111][93][94]. Studies conducted in a genetically engineered T2DM animal models (db/db mice) demonstrated that the expression of the hepatic glucocorticoid receptor was increased with associated increased cortisone levels [112]. Higher levels of cortisone resulted in increased levels of cyp2b and cyp2c causing a change in the metabolism of substrates such as phenytoin [94][113]. In contrast, in their diet-induced obesity model of T2DM, Maximos et al. have also shown that cyp2c and cyp2b activity and mRNA expression was downregulated in this mouse model [86][114].
Studies in T2DM animal models have shown both increased and decreased levels of cyp3a expression and activity. On one hand, cyp3a activity was shown to be reduced in diet-induced obesity diabetic animals, while other studies in STZ diabetic rats indicated that it is increased [86][115][116][117]. Consequently, discrepancy on the impact of T2DM on the metabolism of various substrates has been reported. Studies have shown that cyp3a1 expression is decreased in male STZ-diabetic rats but increased in female STZ-diabetic rats [88][118]. It was shown that glibenclamide clearance was reduced in Zucker diabetic fatty (ZDF) rats, suggesting a reduction in cyp3a activity [119]. Maximos et al. demonstrated that cyp3a11 and cyp3a25 mRNA levels were decreased 2- to 14-fold in the liver which was associated with a 21-fold decrease in midazolam metabolism [86]. They also showed that cyp3a modulation was tissue-dependent [86].
The intestine also expresses a variety of p450 enzymes, mainly cyp3a, that contributes to first-pass metabolism. It was found that cyp3a expression was significantly decreased in the intestine of diabetic rats and mice [117][95]. However, insulin was able to partially reverse the decreased in intestinal cyp3a expression in rats [120].
Most studies have indicated that cyp4a expression and activity are induced in T2DM rats. According to Kroetz et al., cyp4a mRNA levels were induced about eight-fold in STZ-induced diabetics rats, which translated into an associated increase in cyp4a protein expression and activity [96]. The molecular mechanism proposed of the induction of cyp4a in diabetic rats is related to the activation of peroxisome proliferator activated receptor-alpha (PPAR-α) increasing cyp4a transcription while normal regulation of cyp3a is due to the activation of the pregnane X receptor (PXR), which is known to alter the expression profiles of cyp3a [96].
5.2. Human Liver Microsomes and Probes
It has been shown that inflammation-related conditions suppress CYP3A expression and activity in human hepatocytes [57][121]. CYP3A4 expression and activity were significantly lower in hepatic microsomes obtained from diabetic livers. One study reported, using human liver microsomes and midazolam as a probe drug, that CYP3A activity and mRNA and protein expression levels in samples from T2DM patients were decreased 1.6- to 3.3-fold compared to samples from non-diabetic patients [20]. In contrast, CYP2E1 mRNA and protein expression levels as well as activity (using chlorzoxazone as probe drug) were increased significantly [20]. One reason for diabetic induction of CYP2E1 could be hyperketonemia as demonstrated in animal models [122]. CYP2B6 mRNA level has been shown to be reduced under inflammatory conditions in human hepatocytes [57]. Glyburide, a second-generation sulfonylurea, is mainly metabolized by CYP2C9 to cis-3-hydroxycyclohexyl glyburide and trans-4-hydroxycyclohexyl glyburide [123][124]. According to Jain et al. the metabolism of glyburide is decreased in microsomes prepared from the placenta of pregnant women with T2DM compared to that of non-diabetic pregnant women suggesting a decrease in CYP2C9 activity [98].
Together, these P450 enzymes metabolize multiple drugs, and alteration in their enzyme activity or expression could modulate the biotransformation of several drugs in T2DM patients, thus making them either toxic or ineffective (prodrugs).
5.3. Clinical Evidence of Phenoconversion in T2DM
Marques et al. studied 17 hypertensive patients, 9 of whom were also diabetic, to measure the pharmacokinetics of the anti-hypertensive agent nisoldipine, a known CYP3A4 substrate [48]. Additionally, lidocaine disposition was assessed as a marker of CYP3A4 activity. These researchers found that nisoldipine clearance was stereospecific in non-diabetic controls, with the (−) enantiomer exhibiting approximately six-fold higher clearance compared to the (+) enantiomer. However, when non-diabetic and T2DM patients were compared, clearances of the (−) and (+) nisoldipine were reduced by 52% and 38% in T2DM patients, respectively [48]. Consequently, AUCs of (−) and (+) nisoldipine were increased by 143% and 94% in T2DM patients compared to non-diabetic controls [48]. The suggested decrease in CYP3A4 activity in T2DM patients was somewhat confirmed by an increase (~21%) in plasma concentration of lidocaine in T2DM patients 15 min after intravenous infusion of the drug [48]. The fact that lidocaine—a relatively high liver extraction ratio drug—was administered intravenously could explain the difference in the magnitude of changes observed between lidocaine and nifedipine although a decrease in the clearance was observed for both drugs. Moises et al. compared the clearance of lidocaine in pregnant woman vs. non-pregnant woman. They also noticed that lidocaine clearance was lower in pregnant women with gestational diabetes, suggesting that gestational diabetes reduced the activity of CYP3A4 (and possibly CYP1A2) which is responsible for the metabolism of this drug although the combinatorial effect of pregnancy and gestational diabetes (i.e., diabetes with a different origin than T2DM), cannot be excluded [99].
Dostalek et al. showed using population pharmacokinetic modelling that T2DM patients had a significantly reduced clearance of atorvastatin lactone when compared to non-diabetic patients [20]. CYP3A4 is responsible for the metabolism of atorvastatin lactone and acid forms into corresponding hydroxylated metabolites with a higher intrinsic metabolic clearance for the lactone form compared to the acid form [125]. CYP3A4 downregulation due to T2DM could result in less atorvastatin lactone clearance thus forcing it to equilibrium with the acid form, which could lead to a higher risk of 3-hydroxy-3-methyl-glutaryl-CoA reductase (HMG-CoA reductase) inhibitor (statin)-induced myotoxicity.
Diabetes is one of leading causes of kidney diseases; consequently, 30–40% of all kidney transplant recipients in the United States are diabetic at the time of transplantation surgery, and an additional 15–20% develop new-onset diabetes after transplant [126]. Cyclosporine is a calcineurin inhibitor used as an immunosuppressant to prevent organ transplant rejection. Cyclosporine is metabolized in both the intestine and the liver by CYP3A4, resulting in the formation of multiple metabolites [127]. Of the most important metabolites of cyclosporine are the 2-hydroxylated metabolites (AM1 and AM9) [59]. Factors that can contribute to its pharmacokinetics (PK) variability include the extent of cyclosporine pre-systemic elimination by CYP3A4 and/or by the efflux transporter ABCB1. Hryniewieck et al. investigated the associations of cardiovascular diseases with cyclosporine metabolites and indices of cyclosporine metabolism [128]. Their results showed lower AM9 metabolite/cyclosporine ratio of their plasma concentrations in patients with diabetes. This finding suggests a decreased hepatic metabolism in T2DM patients.
Tacrolimus, another calcineurin inhibitor used to prevent organ transplant rejection, is metabolized by CYP3A4/5 to active and inactive metabolites [129][130][131]. There is a wide intersubject variability in the tacrolimus dose needed to achieve therapeutic trough levels. Jacobson et al. found that T2DM patients exhibit increased trough levels suggesting a decrease in CYP3A activities [101].
Gravel et al. have shed light on the clinical impact of T2DM on P450s by investigating activities of seven of the major CYPs (CYP1A2, CYP2B6, CYP2C9, CYP2C19, CYP2D6, CYP2E1, and CYP3A4/5) in T2DM compared to non-T2DM patients following the administration of oral probes (caffeine, bupropion, tolbutamide, omeprazole, dextromethorphan, chlorzoxazone, and midazolam) [104]. They concluded that the activity of CYP2C19, CYP2B6, and CYP3A in T2DM patients was decreased by 46%, 45%, and 38%, respectively; these effects were attributed to some cytokines such as IL-6 [104].
Korrapati et al. found that, while a group of T2DM patients did not differ significantly in their theophylline clearance, theophylline metabolism was positively associated with the degree of HbA1c within the diabetic group suggesting that CYP1A2 may be induced by poor glycemic control [102]. Urry et al. and Gravel et al. have demonstrated that an increase in paraxanthine to caffeine ratio is suggestive of an increase in CYP1A2 activity in patients with T2DM and that CYP1A2 activity can be dependent on glycemic levels as well as HbA1c [78][104]. Hong et al. described a clear association between endogenous insulin levels and CYP1A2 activity [132]. The exact mechanism of CYP1A2 modulation by inflammatory factors is not known but studies may suggest the role of aryl hydrocarbon receptor activation in immune responses or under oxidative stress [133].
In regard to other P450 isoforms, CYP2D6 activity was not changed in patients with T2DM using dextromethorphan as a probe substrate [134]. CYP2E1 has been reported to show no change in activity and expression and that it is less sensitive to disease state (e.g., inflammation) or T2DM [23][104][135][136]. In contrast, as mentioned previously, an induction in cyp2e1 has been noticed in STZ-diabetic rats.
References
- Organization WH. Diabetes. Available online: (accessed on 1 April 2021).
- Bergman, R.N.; Finegood, D.T.; Kahn, S.E. The evolution of beta-cell dysfunction and insulin resistance in type 2 diabetes. Eur. J. Clin. Investig. 2002, 32 (Suppl. 3), 35–45.
- Atlas IDFD. Available online: (accessed on 1 April 2021).
- Peron, E.P.; Ogbonna, K.C.; Donohoe, K.L. Antidiabetic medications and polypharmacy. Clin. Geriatr. Med. 2015, 31, 17–27.
- Nathan, D.M.; Buse, J.B.; Davidson, M.B.; Ferrannini, E.; Holman, R.R.; Sherwin, R.; Zinman, B. Medical management of hyperglycemia in type 2 diabetes: A consensus algorithm for the initiation and adjustment of therapy: A consensus statement of the American Diabetes Association and the European Association for the Study of Diabetes. Diabetes Care 2009, 32, 193–203.
- Bolen, S.; Feldman, L.; Vassy, J.; Wilson, L.; Yeh, H.C.; Marinopoulos, S.; Wiley, C.; Selvin, E.; Wilson, R.; Bass, E.; et al. Systematic review: Comparative effectiveness and safety of oral medications for type 2 diabetes mellitus. Ann. Intern. Med. 2007, 147, 386–399.
- Manolopoulos, V.G. Pharmacogenomics and adverse drug reactions in diagnostic and clinical practice. Clin. Chem. Lab. Med. 2007, 45, 801–814.
- Pearson, E.R. Pharmacogenetics in diabetes. Curr. Diab. Rep. 2009, 9, 172–181.
- Pacanowski, M.A.; Hopley, C.W.; Aquilante, C.L. Interindividual variability in oral antidiabetic drug disposition and response: The role of drug transporter polymorphisms. Expert Opin. Drug Metab. Toxicol. 2008, 4, 529–544.
- Chaudhury, A.; Duvoor, C.; Dendi, V.S.R.; Kraleti, S.; Chada, A.; Ravilla, R.; Marco, A.; Shekhawat, N.s.; Montales, M.T.; Kuriakose, K.; et al. Clinical Review of Antidiabetic Drugs: Implications for Type 2 Diabetes Mellitus Management. Front. Endocrinol. (Lausanne) 2017, 8, 6.
- UK Prospective Diabetes Study (UKPDS) Group. Intensive blood-glucose control with sulphonylureas or insulin compared with conventional treatment and risk of complications in patients with type 2 diabetes (UKPDS 33). Lancet 1998, 352, 837–853.
- Dharmalingam, M.; Yamasandhi, P.G. Nonalcoholic Fatty Liver Disease and Type 2 Diabetes Mellitus. Indian J. Endocrinol. Metab. 2018, 22, 421–428.
- Xia, M.F.; Bian, H.; Gao, X. NAFLD and Diabetes: Two Sides of the Same Coin? Rationale for Gene-Based Personalized NAFLD Treatment. Front. Pharmacol. 2019, 10, 877.
- Fuller, J.H.; McCartney, P.; Jarrett, R.J.; Keen, H.; Rose, G.; Shipley, M.J.; Hamilton, P.J. Hyperglycaemia and coronary heart disease: The Whitehall study. J. Chronic Dis. 1979, 32, 721–728.
- Balkau, B.; Shipley, M.; Jarrett, R.J.; Pyorala, K.; Pyorala, M.; Forhan, A.; Eschwège, E. High blood glucose concentration is a risk factor for mortality in middle-aged nondiabetic men. 20-year follow-up in the Whitehall Study, the Paris Prospective Study, and the Helsinki Policemen Study. Diabetes Care 1998, 21, 360–367.
- Holman, R.R.; Paul, S.K.; Bethel, M.A.; Matthews, D.R.; Neil, H.A. 10-year follow-up of intensive glucose control in type 2 diabetes. N. Engl. J. Med. 2008, 359, 1577–1589.
- Zoungas, S.; Chalmers, J.; Ninomiya, T.; Li, Q.; Cooper, M.E.; Colagiuri, S.; Fulcher, G.; de Galan, B.E.; Harrap, S.; Hamet, P.; et al. Association of HbA1c levels with vascular complications and death in patients with type 2 diabetes: Evidence of glycaemic thresholds. Diabetologia 2012, 55, 636–643.
- American Diabetes Association. Standards of Medical Care in Diabetesd. Diabetes Care 2019, 42, S90–S102.
- Tracy, T.S.; Chaudhry, A.S.; Prasad, B.; Thummel, K.E.; Schuetz, E.G.; Zhong, X.B.; Tien, Y.C.; Jeong, H.; Pan, X.; Shireman, L.; et al. Interindividual Variability in Cytochrome P450-Mediated Drug Metabolism. Drug Metab. Dispos. 2016, 44, 343–351.
- Dostalek, M.; Court, M.H.; Yan, B.; Akhlaghi, F. Significantly reduced cytochrome P450 3A4 expression and activity in liver from humans with diabetes mellitus. Br. J. Pharmacol. 2011, 163, 937–947.
- Estabrook, R.W. A passion for P450s (rememberances of the early history of research on cytochrome P450). Drug Metab. Dispos. 2003, 31, 1461–1473.
- Guengerich, F.P. Cytochrome P450s and other enzymes in drug metabolism and toxicity. AAPS J. 2006, 8, E101–E111.
- Zanger, U.M.; Schwab, M. Cytochrome P450 enzymes in drug metabolism: Regulation of gene expression, enzyme activities, and impact of genetic variation. Pharmacol. Ther. 2013, 138, 103–141.
- Hart, S.N.; Wang, S.; Nakamoto, K.; Wesselman, C.; Li, Y.; Zhong, X.B. Genetic polymorphisms in cytochrome P450 oxidoreductase influence microsomal P450-catalyzed drug metabolism. Pharm. Genom. 2008, 18, 11–24.
- Lamba, J.K.; Lin, Y.S.; Schuetz, E.G.; Thummel, K.E. Genetic contribution to variable human CYP3A-mediated metabolism. Adv. Drug Deliv. Rev. 2002, 54, 1271–1294.
- Saitoh, A.; Sarles, E.; Capparelli, E.; Aweeka, F.; Kovacs, A.; Burchett, S.K.; Wiznia, A.; Nachman, S.; Fenton, T.; Spector, S.A. CYP2B6 genetic variants are associated with nevirapine pharmacokinetics and clinical response in HIV-1-infected children. AIDS 2007, 21, 2191–2199.
- Shah, R.R.; Smith, R.L. Addressing phenoconversion: The Achilles’ heel of personalized medicine. Br. J. Clin. Pharmacol. 2015, 79, 222–2240.
- Bathum, L.; Skjelbo, E.; Mutabingwa, T.K.; Madsen, H.; Hørder, M.; Brøsen, K. Phenotypes and genotypes for CYP2D6 and CYP2C19 in a black Tanzanian population. Br. J. Clin. Pharmacol. 1999, 48, 395–401.
- Klomp, S.D.; Manson, M.L.; Guchelaar, H.J.; Swen, J.J. Phenoconversion of Cytochrome P450 Metabolism: A Systematic Review. J. Clin. Med. 2020, 9, 2890.
- Williams, M.L.; Bhargava, P.; Cherrouk, I.; Marshall, J.L.; Flockhart, D.A.; Wainer, I.W. A discordance of the cytochrome P450 2C19 genotype and phenotype in patients with advanced cancer. Br. J. Clin. Pharmacol. 2000, 49, 485–488.
- Helsby, N.A.; Lo, W.-Y.; Sharples, K.; Riley, G.; Murray, M.; Spells, K.; Dzhelai, M.; Simpson, A.; Findlay, M. CYP2C19 pharmacogenetics in advanced cancer: Compromised function independent of genotype. Br. J. Cancer 2008, 99, 1251–1255.
- Veringa, A.; Avest, M.T.; Span, L.F.; van den Heuvel, E.R.; Touw, D.J.; Zijlstra, J.G.; Kosterink, J.G.W.; van der Werf, T.S.; Alffenaar, J.W.C. Voriconazole metabolism is influenced by severe inflammation: A prospective study. J. Antimicrob. Chemother. 2017, 72, 261–267.
- Ohnishi, A.; Murakami, S.; Akizuki, S.; Mochizuki, J.; Echizen, H.; Takagi, I. In Vivo metabolic activity of CYP2C19 and CYP3A in relation to CYP2C19 genetic polymorphism in chronic liver disease. J. Clin. Pharmacol. 2005, 45, 1221–1229.
- Burns, K.E.; Goldthorpe, M.A.; Porteus, F.; Browett, P.; Helsby, N.A. CYP2C19 genotype-phenotype discordance in patients with multiple myeloma leads to an acquired loss of drug-metabolising activity. Cancer Chemother. Pharmacol. 2014, 73, 651–655.
- Shah, R.R.; Smith, R.L. Phenocopy and phenoconversion: Do they complicate association studies? Pharmacogenomics 2012, 13, 981–984.
- Shaw, J.E.; Sicree, R.A.; Zimmet, P.Z. Global estimates of the prevalence of diabetes for 2010 and 2030. Diabetes Res. Clin. Pract. 2010, 87, 4–14.
- Chan, J.C.; Malik, V.; Jia, W.; Kadowaki, T.; Yajnik, C.S.; Yoon, K.H.; Hu, F.B. Diabetes in Asia: Epidemiology, risk factors, and pathophysiology. JAMA 2009, 301, 2129–2140.
- Shoelson, S.E.; Lee, J.; Goldfine, A.B. Inflammation and insulin resistance. J. Clin. Investig. 2006, 116, 1793–1801.
- Kushner, I. Regulation of the acute phase response by cytokines. Perspect. Biol. Med. 1993, 36, 611–622.
- Akira, S.; Taga, T.; Kishimoto, T. Interleukin-6 in biology and medicine. Adv. Immunol. 1993, 54, 1–78.
- Lechleitner, M.; Koch, T.; Herold, M.; Dzien, A.; Hoppichler, F. Tumour necrosis factor-alpha plasma level in patients with type 1 diabetes mellitus and its association with glycaemic control and cardiovascular risk factors. J. Intern. Med. 2000, 248, 67–76.
- McCarty, M.F. Interleukin-6 as a central mediator of cardiovascular risk associated with chronic inflammation, smoking, diabetes, and visceral obesity: Down-regulation with essential fatty acids, ethanol and pentoxifylline. Med. Hypotheses 1999, 52, 465–477.
- Yudkin, J.S.; Yajnik, C.S.; Mohamed-Ali, V.; Bulmer, K. High levels of circulating proinflammatory cytokines and leptin in urban, but not rural, Indians. A potential explanation for increased risk of diabetes and coronary heart disease. Diabetes Care 1999, 22, 363–364.
- Hotamisligil, G.S.; Shargill, N.S.; Spiegelman, B.M. Adipose expression of tumor necrosis factor-alpha: Direct role in obesity-linked insulin resistance. Science 1993, 259, 87–91.
- Tuttle, H.A.; Davis-Gorman, G.; Goldman, S.; Copeland, J.G.; McDonagh, P.F. Proinflammatory cytokines are increased in type 2 diabetic women with cardiovascular disease. J. Diabetes Complicat. 2004, 18, 343–351.
- Bastard, J.P.; Jardel, C.; Bruckert, E.; Blondy, P.; Capeau, J.; Laville, M.; Vidal, H.; Hainque, B. Elevated levels of interleukin 6 are reduced in serum and subcutaneous adipose tissue of obese women after weight loss. J. Clin. Endocrinol. Metab. 2000, 85, 3338–3342.
- Shah, R.R.; Smith, R.L. Inflammation-Induced phenoconversion of polymorphic drug metabolizing enzymes: Hypothesis with implications for personalized medicine. Drug Metab. Dispos. 2015, 43, 400–410.
- Marques, M.P.; Coelho, E.B.; Santos, N.A.D.; Geleilete, T.J.; Lanchote, V.L. Dynamic and kinetic disposition of nisoldipine enantiomers in hypertensive patients presenting with type-2 diabetes mellitus. Eur. J. Clin. Pharmacol. 2002, 58, 607–614.
- Goldfine, A.B.; Fonseca, V.; Shoelson, S.E. Therapeutic approaches to target inflammation in type 2 diabetes. Clin. Chem. 2011, 57, 162–167.
- Dotson, S.; Freeman, R.; Failing, H.J.; Adler, G.K. Hypoglycemia increases serum interleukin-6 levels in healthy men and women. Diabetes Care 2008, 31, 1222–1223.
- Crook, M.A.; Tutt, P.; Pickup, J.C. Elevated serum sialic acid concentration in NIDDM and its relationship to blood pressure and retinopathy. Diabetes Care 1993, 16, 57–60.
- Pickup, J.C.; Mattock, M.B.; Chusney, G.D.; Burt, D. NIDDM as a disease of the innate immune system: Association of acute-phase reactants and interleukin-6 with metabolic syndrome X. Diabetologia 1997, 40, 1286–1292.
- Fearnley, G.R.; Vincent, C.T.; Chakrabarti, R. Reduction of blood fibrinolytic activity in diabetes mellitus by insulin. Lancet 1959, 2, 1067.
- Emerging Risk Factors Collaboration; Kaptoge, S.; Angelantonio, E.D.; Lowe, G.; Pepys, M.B.; Thompson, S.G.; Collins, R.; Danesh, J. C-Reactive protein concentration and risk of coronary heart disease, stroke, and mortality: An individual participant meta-analysis. Lancet 2010, 375, 132–140.
- Morgan, E.T. Impact of infectious and inflammatory disease on cytochrome P450-mediated drug metabolism and pharmacokinetics. Clin. Pharmacol Ther. 2009, 85, 434–438.
- de Jong, L.M.; Jiskoot, W.; Swen, J.J.; Manson, M.L. Distinct Effects of Inflammation on Cytochrome P450 Regulation and Drug Metabolism: Lessons from Experimental Models and a Potential Role for Pharmacogenetics. Genes 2020, 11, 1509.
- Aitken, A.E.; Richardson, T.A.; Morgan, E.T. Regulation of drug-metabolizing enzymes and transporters in inflammation. Annu. Rev. Pharmacol. Toxicol. 2006, 46, 123–149.
- Mallick, P.; Taneja, G.; Moorthy, B.; Ghose, R. Regulation of drug-metabolizing enzymes in infectious and inflammatory disease: Implications for biologics-small molecule drug interactions. Expert Opin. Drug Metab. Toxicol. 2017, 13, 605–616.
- Christensen, H.; Hermann, M. Immunological response as a source to variability in drug metabolism and transport. Front. Pharmacol. 2012, 3, 8.
- Abdel-Razzak, Z.; Loyer, P.; Fautrel, A.; Gautier, J.C.; Corcos, L.; Turlin, B.; Beaune, P.; Guillouzo, A. Cytokines down-regulate expression of major cytochrome P-450 enzymes in adult human hepatocytes in primary culture. Mol. Pharmacol. 1993, 44, 707–715.
- Muntane-Relat, J.; Ourlin, J.C.; Domergue, J.; Maurel, P. Differential effects of cytokines on the inducible expression of CYP1A1, CYP1A2, and CYP3A4 in human hepatocytes in primary culture. Hepatology 1995, 22 Pt 1, 1143–1153.
- Chen, Y.L.; Florentin, I.; Batt, A.M.; Ferrari, L.; Giroud, J.P.; Chauvelot-Moachon, L. Effects of interleukin-6 on cytochrome P450-dependent mixed-function oxidases in the rat. Biochem. Pharmacol. 1992, 44, 137–148.
- Pous, C.; Giroud, J.P.; Damais, C.; Raichvarg, D.; Chauvelot-Moachon, L. Effect of recombinant human interleukin-1 beta and tumor necrosis factor alpha on liver cytochrome P-450 and serum alpha-1-acid glycoprotein concentrations in the rat. Drug Metab. Dispos. 1990, 18, 467–470.
- Craig, P.I.; Tapner, M.; Farrell, G.C. Interferon suppresses erythromycin metabolism in rats and human subjects. Hepatology 1993, 17, 230–235.
- Kacevska, M.; Robertson, G.R.; Clarke, S.J.; Liddle, C. Inflammation and CYP3A4-mediated drug metabolism in advanced cancer: Impact and implications for chemotherapeutic drug dosing. Expert Opin. Drug Metab. Toxicol. 2008, 4, 137–149.
- Donahue, B.S.; Morgan, E.T. Effects of vanadate on hepatic cytochrome P-450 expression in streptozotocin-diabetic rats. Drug Metab. Dispos. 1990, 18, 519–526.
- Morgan, E.T.; Goralski, K.B.; Piquette-Miller, M.; Renton, K.W.; Robertson, G.R.; Chaluvadi, M.R.; Charles, K.A.; Clarke, S.J.; Kacevska, M.; Liddle, C.; et al. Regulation of drug-metabolizing enzymes and transporters in infection, inflammation, and cancer. Drug Metab. Dispos. 2008, 36, 205–216.
- Morohoshi, M.; Fujisawa, K.; Uchimura, I.; Numano, F. Glucose-Dependent interleukin 6 and tumor necrosis factor production by human peripheral blood monocytes In Vitro. Diabetes 1996, 45, 954–959.
- Hancu, N.; Netea, M.G.; Baciu, I. High glucose concentrations increase the tumor necrosis factor-alpha production capacity by human peripheral blood mononuclear cells. Rom. J. Physiol. 1998, 35, 325–330.
- de Galan, B.E.; Netea, M.G.; Smits, P.; van der Meer, J.W. Hypoglycaemia downregulates endotoxin-induced production of tumour necrosis factor-alpha, but does not affect IL-1beta, IL-6, or IL-10. Cytokine 2003, 22, 71–76.
- Kany, S.; Vollrath, J.T.; Relja, B. Cytokines in Inflammatory Disease. Int. J. Mol. Sci. 2019, 20, 6008.
- Konukoglu, D.; Hatemi, H.; Bayer, H.; Bagriacik, N. Relationship between serum concentrations of interleukin-6 and tumor necrosis factor alpha in female Turkish subjects with normal and impaired glucose tolerance. Horm. Metab. Res. 2006, 38, 34–37.
- Guha, M.; Bai, W.; Nadler, J.L.; Natarajan, R. Molecular mechanisms of tumor necrosis factor alpha gene expression in monocytic cells via hyperglycemia-induced oxidant stress-dependent and -independent pathways. J. Biol. Chem. 2000, 275, 17728–17739.
- Mishima, Y.; Kuyama, A.; Tada, A.; Takahashi, K.; Ishioka, T.; Kibata, M. Relationship between serum tumor necrosis factor-alpha and insulin resistance in obese men with Type 2 diabetes mellitus. Diabetes Res. Clin. Pract. 2001, 52, 119–123.
- Lofgren, P.; van Harmelen, V.; Reynisdottir, S.; Naslund, E.; Ryden, M.; Rossner, S.; Arner, P. Secretion of tumor necrosis factor-alpha shows a strong relationship to insulin-stimulated glucose transport in human adipose tissue. Diabetes 2000, 49, 688–692.
- Mendonza, A.E.; Gohh, R.Y.; Akhlaghi, F. Blood and plasma pharmacokinetics of ciclosporin in diabetic kidney transplant recipients. Clin. Pharmacokinet. 2008, 47, 733–742.
- Jamwal, R.; de la Monte, S.M.; Ogasawara, K.; Adusumalli, S.; Barlock, B.B.; Akhlaghi, F. Nonalcoholic Fatty Liver Disease and Diabetes Are Associated with Decreased CYP3A4 Protein Expression and Activity in Human Liver. Mol. Pharm. 2018, 15, 2621–2632.
- Urry, E.; Jetter, A.; Landolt, H.P. Assessment of CYP1A2 enzyme activity in relation to type-2 diabetes and habitual caffeine intake. Nutr. Metab. (Lond.) 2016, 13, 66.
- Sotaniemi, E.A. Diabetes and Elimination of Antipyrine inMan: An Analysis of 298 Patients Classified by Type of Diabetes, Age, Sex, Duration ofDisease and Liver Involvement. Pharmacol. Toxicol. 2002, 90, 155–160.
- Wang, T.; Shankar, K.; Ronis, M.J.; Mehendale, H.M. Mechanisms and outcomes of drug- and toxicant-induced liver toxicity in diabetes. Crit. Rev. Toxicol. 2007, 37, 413–459.
- Martignoni, M.; Groothuis, G.M.; de Kanter, R. Species differences between mouse, rat, dog, monkey and human CYP-mediated drug metabolism, inhibition and induction. Expert Opin. Drug Metab. Toxicol. 2006, 2, 875–894.
- Shimojo, N.; Ishizaki, T.; Imaoka, S.; Funae, Y.; Fujii, S.; Okuda, K. Changes in amounts of cytochrome P450 isozymes and levels of catalytic activities in hepatic and renal microsomes of rats with streptozocin-induced diabetes. Biochem. Pharmacol. 1993, 46, 621–627.
- Kim, Y.C.; Lee, A.K.; Lee, J.H.; Lee, I.; Lee, D.C.; Kim, S.H.; Kim, S.G.; Lee, M.G. Pharmacokinetics of theophylline in diabetes mellitus rats: Induction of CYP1A2 and CYP2E1 on 1,3-dimethyluric acid formation. Eur. J. Pharm. Sci. 2005, 26, 114–123.
- Chen, G.M.; Hu, N.; Liu, L.; Xie, S.S.; Wang, P.; Li, J.; Xie, L.; Wang, G.J.; Liu, X.D. Pharmacokinetics of verapamil in diabetic rats induced by combination of high-fat diet and streptozotocin injection. Xenobiotica 2011, 41, 494–500.
- Raza, H.; Ahmed, I.; John, A.; Sharma, A.K. Modulation of xenobiotic metabolism and oxidative stress in chronic streptozotocin-induced diabetic rats fed with Momordica charantia fruit extract. J. Biochem. Mol. Toxicol. 2000, 14, 131–139.
- Maximos, S.; Chamoun, M.; Gravel, S.; Turgeon, J.; Michaud, V. Tissue Specific Modulation of cyp2c and cyp3a mRNA Levels and Activities by Diet-Induced Obesity in Mice: The Impact of Type 2 Diabetes on Drug Metabolizing Enzymes in Liver and Extra-Hepatic Tissues. Pharmaceutics 2017, 9, 40.
- Hu, N.; Xie, S.; Liu, L.; Wang, X.; Pan, X.; Chen, G.; Zhang, L.; Liu, H.; Liu, X.; Liu, X.; et al. Opposite effect of diabetes mellitus induced by streptozotocin on oral and intravenous pharmacokinetics of verapamil in rats. Drug Metab. Dispos. 2011, 39, 419–425.
- Gawronska-Szklarz, B.; Musial, D.H.; Pawlik, A.; Paprota, B. Effect of experimental diabetes on pharmacokinetic parameters of lidocaine and MEGX in rats. Pol. J. Pharmacol. 2003, 55, 619–624.
- Bae, S.K.; Kim, J.Y.; Yang, S.H.; Kim, J.W.; Kim, T.; Lee, M.G. Pharmacokinetics of oltipraz in rat models of diabetes mellitus induced by alloxan or streptozotocin. Life Sci. 2006, 78, 2287–2294.
- Lee, D.Y.; Lee, M.G.; Shin, H.S.; Lee, I. Changes in omeprazole pharmacokinetics in rats with diabetes induced by alloxan or streptozotocin: Faster clearance of omeprazole due to induction of hepatic CYP1A2 and 3A1. J. Pharm. Pharm. Sci. 2007, 10, 420–433.
- Ueyama, J.; Wang, D.; Kondo, T.; Saito, I.; Takagi, K.; Takagi, K.; Kamijima, M.; Nakajima, T.; Miyamoto, K.I.; Wakusawa, S.; et al. Toxicity of diazinon and its metabolites increases in diabetic rats. Toxicol. Lett. 2007, 170, 229–237.
- Kim, Y.C.; Oh, E.Y.; Kim, S.H.; Lee, M.G. Pharmacokinetics of diclofenac in rat model of diabetes mellitus induced by alloxan or steptozotocin. Biopharm. Drug Dispos. 2005, 27, 85–92.
- Liu, H.; Liu, L.; Li, J.; Mei, D.; Duan, R.; Hu, N.; Guo, H.; Zhong, Z.; Liu, X. Combined contributions of impaired hepatic CYP2C11 and intestinal breast cancer resistance protein activities and expression to increased oral glibenclamide exposure in rats with streptozotocin-induced diabetes mellitus. Drug Metab. Dispos. 2012, 40, 1104–1112.
- Kim, Y.C.; Kang, H.E.; Lee, M.G. Pharmacokinetics of phenytoin and its metabolite, 4’-HPPH, after intravenous and oral administration of phenytoin to diabetic rats induced by alloxan or streptozotocin. Biopharm. Drug Dispos. 2008, 29, 51–61.
- Wang, Z.; Yang, H.; Xu, J.; Zhao, K.; Chen, Y.; Liang, L.; Li, P.; Chan, N.; Geng, D.; Zhang, X.; et al. Prediction of Atorvastatin Pharmacokinetics in High-Fat Diet and Low-Dose Streptozotocin-Induced Diabetic Rats Using a Semiphysiologically Based Pharmacokinetic Model Involving Both Enzymes and Transporters. Drug Metab. Dispos. 2019, 47, 1066–1079.
- Kroetz, D.L.; Yook, P.; Costet, P.; Bianchi, P.; Pineau, T. Peroxisome proliferator-activated receptor alpha controls the hepatic CYP4A induction adaptive response to starvation and diabetes. J. Biol. Chem. 1998, 273, 31581–31589.
- Woodcroft, K.J.; Novak, R.F. Insulin effects on CYP2E1, 2B, 3A, and 4A expression in primary cultured rat hepatocytes. Chem. Biol. Interact. 1997, 107, 75–91.
- Jain, S.; Zharikova, O.L.; Ravindran, S.; Nanovskya, T.N.; Mattison, D.R.; Hankins, G.D.; Ahmed, M.S. Glyburide metabolism by placentas of healthy and gestational diabetics. Am. J. Perinatol. 2008, 25, 169–174.
- Moisés, E.C.D.; Duarte, L.D.B.; Cavalli, R.D.C.; Marques, M.P.; Lanchote, V.L.; Duarte, G.; da Cunha, S.P. Pharmacokinetics of lidocaine and its metabolite in peridural anesthesia administered to pregnant women with gestational diabetes mellitus. Eur. J. Clin. Pharmacol. 2008, 64, 1189–1196.
- Akhlaghi, F.; Dostalek, M.; Falck, P.; E Mendonza, A.; Amundsen, R.; Gohh, R.Y.; Asberg, A. The concentration of cyclosporine metabolites is significantly lower in kidney transplant recipients with diabetes mellitus. Ther. Drug Monit. 2012, 34, 38–45.
- Jacobson, P.A.; Oetting, W.S.; Brearley, A.M.; LeDuc, R.; Guan, W.; Schladt, D.; Matas, A.; Lamba, V.; Julian, B.A.; Mannon, R.B.; et al. Novel polymorphisms associated with tacrolimus trough concentrations: Results from a multicenter kidney transplant consortium. Transplantation 2011, 91, 300–308.
- Korrapati, M.R.; Vestal, R.E.; Loi, C.M. Theophylline metabolism in healthy nonsmokers and in patients with insulin-dependent diabetes mellitus. Clin. Pharmacol. Ther. 1995, 57, 413–418.
- Hall, H.M.; Banerjee, S.; McGuire, D.K. Variability of clopidogrel response in patients with type 2 diabetes mellitus. Diabetes Vasc. Dis. Res. 2011, 8, 245–253.
- Gravel, S.; Chiasson, J.; Turgeon, J.; Grangeon, A.; Michaud, V. Modulation of CYP450 Activities in Patients with Type 2 Diabetes. Clin. Pharmacol. Ther. 2019, 106, 1280–1289.
- Bellward, G.D.; Chang, T.; Rodrigues, B.; McNeill, J.H.; Maines, S.; Ryan, D.E.; Levin, W.; Thomas, P.E. Hepatic cytochrome P-450j induction in the spontaneously diabetic BB rat. Mol. Pharmacol. 1988, 33, 140–143.
- Abdelmegeed, M.A.; Carruthers, N.J.; Woodcroft, K.J.; Kim, S.K.; Novak, R.F. Acetoacetate induces CYP2E1 protein and suppresses CYP2E1 mRNA in primary cultured rat hepatocytes. J. Pharmacol. Exp. Ther. 2005, 315, 203–213.
- Shimojo, N. Cytochrome P450 changes in rats with streptozocin-induced diabetes. Int. J. Biochem. 1994, 26, 1261–1268.
- Woodcroft, K.J.; Hafner, M.S.; Novak, R.F. Insulin signaling in the transcriptional and posttranscriptional regulation of CYP2E1 expression. Hepatology 2002, 35, 263–273.
- Favreau, L.V.; Schenkman, J.B. Composition changes in hepatic microsomal cytochrome P-450 during onset of streptozocin-induced diabetes and during insulin treatment. Diabetes 1988, 37, 577–584.
- Chen, G.F.; Ronis, M.J.; Ingelman-Sundberg, M.; Badger, T.M. Hormonal regulation of microsomal cytochrome P4502E1 and P450 reductase in rat liver and kidney. Xenobiotica 1999, 29, 437–451.
- Xu, F.; Zhu, L.; Qian, C.; Zhou, J.; Geng, D.; Li, P.; Xuan, W.; Wu, F.; Zhao, K.; Kong, W.; et al. Impairment of Intestinal Monocarboxylate Transporter 6 Function and Expression in Diabetic Rats Induced by Combination of High-Fat Diet and Low Dose of Streptozocin: Involvement of Butyrate-Peroxisome Proliferator-Activated Receptor-gamma Activation. Drug Metab. Dispos. 2019, 47, 556–566.
- Liu, Y.; Nakagawa, Y.; Wang, Y.; Sakurai, R.; Tripathi, P.V.; Lutfy, K.; Friedman, T.C. Increased glucocorticoid receptor and 11-hydroxysteroid dehydrogenase type 1 expression in hepatocytes may contribute to the phenotype of type 2 diabetes in db/db mice. Diabetes 2005, 54, 32–40.
- Schuetz, E.G.; Schmid, W.; Schutz, G.; Brimer, C.; Yasuda, K.; Kamataki, T.; Bornheim, L.; Myles, K.; Cole, T.J. The glucocorticoid receptor is essential for induction of cytochrome P-4502B by steroids but not for drug or steroid induction of CYP3A or P-450 reductase in mouse liver. Drug Metab. Dispos. 2000, 28, 268–278.
- Lam, J.L. Expression and Functional Analysis of Hepatic Cytochromes P450, Nuclear Receptors, and Membrane Transporters in 10- and 25-Week-Old db/db Mice. Drug Metab. Dispos. 2010, 38, 2252–2258.
- Verrecchia, A.; Guaitani, A. Insulin-Mimetic effects of vanadate in preventing the increase of P450IIIA and P450IA subfamily proteins in streptozotocin-diabetic rats. Acta Diabetol. 1993, 30, 128–131.
- Barnett, C.R.; Gibson, G.G.; Wolf, C.R.; Flatt, P.R.; Ioannides, C. Induction of cytochrome P450III and P450IV family proteins in streptozotocin-induced diabetes. Biochem. J. 1990, 268, 765–769.
- Kudo, T.; Toda, T.; Ushiki, T.; Ohi, K.; Ikarashi, N.; Ochiai, W.; Sugiyama, K.l. Differences in the pharmacokinetics of Cyp3a substrates in TSOD and streptozotocin-induced diabetic mice. Xenobiotica 2010, 40, 282–290.
- Thummel, K.E.; Schenkman, J.B. Effects of testosterone and growth hormone treatment on hepatic microsomal P450 expression in the diabetic rat. Mol. Pharmacol. 1990, 37, 119–129.
- Zhou, X.; Rougee, L.R.; Bedwell, D.W.; Cramer, J.W.; Mohutsky, M.A.; Calvert, N.A.; Moulton, R.D.; Cassidy, K.C.; Yumibe, N.P.; Adams, L.A.; et al. Difference in the Pharmacokinetics and Hepatic Metabolism of Antidiabetic Drugs in Zucker Diabetic Fatty and Sprague-Dawley Rats. Drug Metab. Dispos. 2016, 44, 1184–1192.
- Borbas, T.; Benko, B.; Dalmadi, B.; Szabo, I.; Tihanyi, K. Insulin in flavin-containing monooxygenase regulation. Flavin-containing monooxygenase and cytochrome P450 activities in experimental diabetes. Eur. J. Pharm. Sci. 2006, 28, 51–58.
- Dickmann, L.J.; Patel, S.K.; Rock, D.A.; Wienkers, L.C.; Slatter, J.G. Effects of interleukin-6 (IL-6) and an anti-IL-6 monoclonal antibody on drug-metabolizing enzymes in human hepatocyte culture. Drug Metab. Dispos. 2011, 39, 1415–1422.
- Vahabzadeh, M. Effect of Diabetes Mellitus on the Metabolism of Drugs and Toxins. J. Clin. Toxicol. 2015, 5, 2161-0495.
- Kirchheiner, J.; Brockmoller, J.; Meineke, I.; Bauer, S.; Rohde, W.; Meisel, C.; Roots, I. Impact of CYP2C9 amino acid polymorphisms on glyburide kinetics and on the insulin and glucose response in healthy volunteers. Clin. Pharmacol. Ther. 2002, 71, 286–296.
- Rydberg, T.; Wahlin-Boll, E.; Melander, A. Determination of glibenclamide and its two major metabolites in human serum and urine by column liquid chromatography. J. Chromatogr. 1991, 564, 223–233.
- Fujino, H.; Saito, T.; Tsunenari, Y.; Kojima, J.; Sakaeda, T. Metabolic properties of the acid and lactone forms of HMG-CoA reductase inhibitors. Xenobiotica 2004, 34, 961–971.
- Kasiske, B.L.; Snyder, J.J.; Gilbertson, D.; Matas, A.J. Diabetes mellitus after kidney transplantation in the United States. Am. J. Transplant. 2003, 3, 178–185.
- Fahr, A. Cyclosporin clinical pharmacokinetics. Clin. Pharmacokinet. 1993, 24, 472–495.
- Hryniewiecka, E.; Zegarska, J.; Zochowska, D.; Samborowska, E.; Jazwiec, R.; Kosieradzki, M.; Nazarewski, S.; Dadlez, M.; Pączek, L. Cyclosporine Metabolites’ Metabolic Ratios May Be Markers of Cardiovascular Disease in Kidney Transplant Recipients Treated with Cyclosporine A-Based Immunosuppression Regimens. Cardiovasc. Toxicol. 2019, 19, 255–263.
- Mancinelli, L.M.; Frassetto, L.; Floren, L.C.; Dressler, D.; Carrier, S.; Bekersky, I.; Benet, L.Z.; Christians, U. The pharmacokinetics and metabolic disposition of tacrolimus: A comparison across ethnic groups. Clin. Pharmacol. Ther. 2001, 69, 24–31.
- Sattler, M.; Guengerich, F.P.; Yun, C.H.; Christians, U.; Sewing, K.F. Cytochrome P-450 3A enzymes are responsible for biotransformation of FK506 and rapamycin in man and rat. Drug Metab. Dispos. 1992, 20, 753–761.
- Lecointre, K.; Furlan, V.; Taburet, A.-M. In vitro effects of tacrolimus on human cytochrome P450. Fundam. Clin. Pharmacol. 2002, 16, 455–460.
- Hong, C.-C. Cytochrome P450 1A2 (CYP1A2) activity and risk factors for breast cancer: A cross-sectional study. Breast Cancer Res. 2004, 6, R352–R365.
- Beischlag, T.V.; Morales, J.L.; Hollingshead, B.D.; Perdew, G.H. The aryl hydrocarbon receptor complex and the control of gene expression. Crit. Rev. Eukaryot. Gene Expr. 2008, 18, 207–250.
- Matzke, G.R.; Frye, R.F.; Early, J.J.; Straka, R.J.; Carson, S.W. Evaluation of the influence of diabetes mellitus on antipyrine metabolism and CYP1A2 and CYP2D6 activity. Pharmacotherapy 2000, 20, 182–190.
- Villeneuve, J.P.; Pichette, V. Cytochrome P450 and liver diseases. Curr. Drug Metab. 2004, 5, 273–282.
- Pucci, L.; Chirulli, V.; Marini, S.; Lucchesi, D.; Penno, G.; Gervasi, P.G.; Del Prato, S.; Longo, V. Expression and activity of CYP2E1 in circulating lymphocytes are not altered in diabetic individuals. Pharmacol. Res. 2005, 51, 561–565.


