 +1 credit
| Version | Summary | Created by | Modification | Content Size | Created at | Operation |
|---|---|---|---|---|---|---|
| 1 | Tsung-Chieh Lin | + 891 word(s) | 891 | 2021-03-16 10:11:40 | | | |
| 2 | Rita Xu | Meta information modification | 891 | 2021-04-06 11:47:57 | | |
Video Upload Options
Leptin is an obesity-associated adipokine that is known to regulate energy metabolism and reproduction and to control appetite via the leptin receptor. Recent work has identified specific cell types other than adipocytes that harbor leptin and leptin receptor expression, particularly in cancers and tumor microenvironments, and characterized the role of this signaling axis in cancer progression.
1. Introduction
Leptin (LEP), a protein hormone secreted by adipose tissues, primarily functions as the ligand of leptin receptor (LEPR) to regulate appetite and energy expenditure [1][2]. Leptin plays critical roles in the modulation of processes involving in the hormones synthesis, blood pressure, reproduction, osteogenesis, hematopoiesis, angiogenesis, and immunity [3]. Moreover, leptin is also uncovered to participate in the pathophysiology of energy metabolism [4], endocrine diseases [5], neurovascular diseases [6], or obesity and metabolism-associated diseases [7]. Leptin is encoded by the OB gene on chromosome 7. The 2 LEP isoforms and 6 LEPR isoforms are shown with the protein domains indicated (Figure 1). The leptin receptor, encoded by LEPR, is a member of the class 1 cytokine receptor family and has been indicated to play critical roles in the pathogenesis of many malignant cancer types [1][8][9]. The downstream effects of leptin signaling can induce malignancies via the activation of specific signaling pathways in cancer cells [10][11][12]. Recent studies indicate that leptin receptors are highly abundant in many cancer types [13][14][15]. Accumulated experimental results have highlighted the role of leptin–leptin receptor signaling in promoting several processes linked to cancer progression, including cell proliferation, metastasis, angiogenesis and chemoresistance [16][17][18][19].
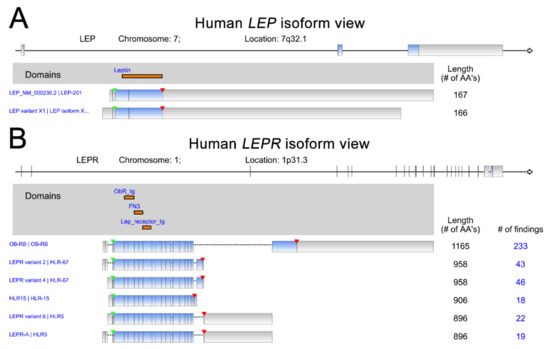
Figure 1. Human LEP (A) and LEPR (B) isoforms. The data were retrieved and analyzed from RefSeq. The protein domains of various isoforms are indicated in orange. The start of transcription and stop codon position are indicated by green and red arrowheads, respectively.
2. Leptin and Leptin Receptor Expression in Cancer
Single-cell RNA sequencing (scRNA-seq) has become a powerful tool to delineate the composition of different cell types or states in a given tissue on the basis of sets of differentially expressed genes [20][21][22][23]. Recently, scRNA-seq of normal tissue led to the discovery of specific biomarkers in multiple cell types that might contribute to cancer development [24]. A new cell-type atlas with publicly available genome-wide expression scRNA-seq data of 192 individual cell-type clusters from 13 different human tissues was launched in November 2020 (The Human Protein Atlas, https://www.proteinatlas.org/, accessed on January 2021) [25]. The leptin receptor expression in the four normal tissues with the highest leptin receptor levels, namely, the skin, lung, liver, and heart, is shown at the single-cell scale (Figure 2). Relatively high leptin receptor expression was detected in fibroblasts, endothelial cells, and macrophages in skin tissue. Hepatocytes, Ito cells, endothelial cells and cholangiocytes in the liver all showed leptin receptor expression. In addition, leptin receptor expression was specifically detected in alveolar type 2 cells and endothelial cells compared with other lung cell types. In the heart, leptin receptor expression was found in endothelial cells, mixed immune cells, smooth muscle cells, and fibroblasts, but not in cardiomyocytes. These observations further suggest potential sites of leptin-mediated signaling that may play roles in tumorigenesis.
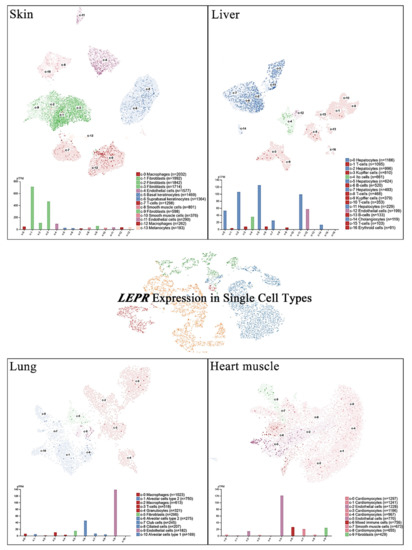
Figure 2. LEPR expression in single cells of different types. The LEPR expression level was analyzed by single-cell RNA sequencing (scRNA-seq) in various human tissues. The RNA expression levels in the cell type clusters identified in each tissue were visualized by a UMAP plot of single cells (top) and in a bar chart (bottom). The read counts were normalized to transcripts per million protein-coding genes (pTPM) for each cluster.
Cancer cells and the tumor microenvironment expressing leptin and leptin receptors suggest that the potential leptin autocrine/paracrine signaling loop could affect tumor progression. A total of 32 blood samples from colorectal cancer patients and 25 healthy subjects were analyzed for serum levels of leptin. Leptin was significantly higher in patients than in controls (p < 0.05) [26]. An immunohistochemical analysis of bone metastatic tissue of breast cancer further showed that the leptin receptor was prevalently expressed in the cytosol and the nuclei of metastatic cells, whereas leptin was detected in both metastatic cells and stromal cells [27]. A cohort of gastric cancer enrolling 117 newly diagnosed and untreated patients was studied. The results indicated that LEPR methylation levels were significantly lower in tumor samples than in adjacent (5 cm away) nontumor samples, suggesting the potentially high expression level of leptin receptor in gastric cancer [28]. An immunohistochemistry study using a tissue microarray of bladder cancer showed that strong leptin expression tended to be present more often in tumors than in benign tissues [29]. Higher RNA levels of both leptin and leptin receptors were found in prostate cancer patients than in healthy controls in a study including 176 men [30]. Leptin levels in patients with endometrial cancer were significantly higher than those in the control group [31].
Relative leptin and leptin receptor expression data from different types of cancers were retrieved from a public database (https://ist.medisapiens.com/, accessed on January 2021) (Figure 3). The relative leptin expression level is high in head and neck cancer, peritoneal cancer, pancreatic cancer, cervical cancer, and breast cancer. In addition, leptin receptor expression is relatively high in liver cancer, indicating the potential pathological roles of this axis in cancers.
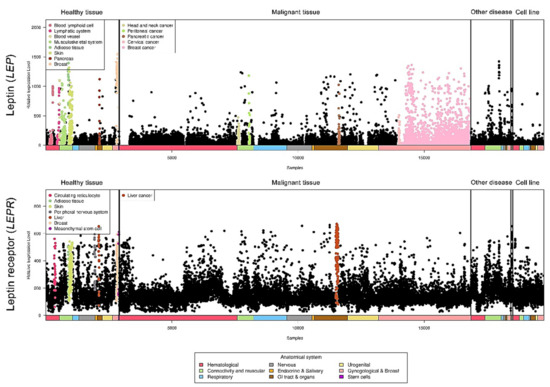
Figure 3. LEP and LEPR expression in a pancancer panel. In a pancancer dataset, LEP and LEPR expression levels were presented separately in various cancer types. The colored dots represent individual patients with higher expression of the indicated molecule among all cancer types. The raw data were retrieved from the online IST database.
References
- Tartaglia, L.A.; Dembski, M.; Weng, X.; Deng, N.; Culpepper, J.; Devos, R.; Richards, G.J.; Campfield, L.A.; Clark, F.T.; Deeds, J.; et al. Identification and expression cloning of a leptin receptor, OB-R. Cell 1995, 83, 1263–1271.
- Halaas, J.L.; Gajiwala, K.S.; Maffei, M.; Cohen, S.L.; Chait, B.T.; Rabinowitz, D.; Lallone, R.L.; Burley, S.K.; Friedman, J.M. Weight-reducing effects of the plasma protein encoded by the obese gene. Science 1995, 269, 543–546.
- Charchour, R.; Dufour-Rainfray, D.; Morineau, G.; Vatier, C.; Fellahi, S.; Vigouroux, C.; Genoux, A.; Capeau, J.; Lacorte, J.M.; Collet, C.; et al. Mutltifaceted biological roles of leptin. Ann. Biol. Clin. 2020, 78, 231–242.
- Garcia-Castano, A.; Madariaga, L.; de Nanclares, G.P.; Ariceta, G.; Gaztambide, S.; Castano, L. Novel mutations associated with inherited human calcium-sensing receptor disorders: A clinical genetic study. Eur. J. Endocrinol. 2019, 180, 59–70.
- Scheja, L.; Heeren, J. The endocrine function of adipose tissues in health and cardiometabolic disease. Nat. Rev. Endocrinol. 2019, 15, 507–524.
- Opatrilova, R.; Caprnda, M.; Kubatka, P.; Valentova, V.; Uramova, S.; Nosal, V.; Gaspar, L.; Zachar, L.; Mozos, I.; Petrovic, D.; et al. Adipokines in neurovascular diseases. Biomed. Pharmacother. 2018, 98, 424–432.
- Pham, D.V.; Park, P.H. Recent insights on modulation of inflammasomes by adipokines: A critical event for the pathogenesis of obesity and metabolism-associated diseases. Arch. Pharmacal. Res. 2020, 43, 997–1016.
- Schwartz, M.W.; Woods, S.C.; Porte, D., Jr.; Seeley, R.J.; Baskin, D.G. Central nervous system control of food intake. Nature 2000, 404, 661–671.
- Tartaglia, L.A. The leptin receptor. J. Biol. Chem. 1997, 272, 6093–6096.
- Lipsey, C.C.; Harbuzariu, A.; Daley-Brown, D.; Gonzalez-Perez, R.R. Oncogenic role of leptin and Notch interleukin-1 leptin crosstalk outcome in cancer. World J. Methodol. 2016, 6, 43–55.
- Allison, M.B.; Myers, M.G., Jr. 20 years of leptin: Connecting leptin signaling to biological function. J. Endocrinol. 2014, 223, T25–T35.
- Mullen, M.; Gonzalez-Perez, R.R. Leptin-Induced JAK/STAT Signaling and Cancer Growth. Vaccines 2016, 4, 26.
- Howard, J.M.; Pidgeon, G.P.; Reynolds, J.V. Leptin and gastro-intestinal malignancies. Obes. Rev. Off. J. Int. Assoc. Study Obes. 2010, 11, 863–874.
- Garofalo, C.; Koda, M.; Cascio, S.; Sulkowska, M.; Kanczuga-Koda, L.; Golaszewska, J.; Russo, A.; Sulkowski, S.; Surmacz, E. Increased expression of leptin and the leptin receptor as a marker of breast cancer progression: Possible role of obesity-related stimuli. Clin. Cancer Res. Off. J. Am. Assoc. Cancer Res. 2006, 12, 1447–1453.
- Ishikawa, M.; Kitayama, J.; Nagawa, H. Enhanced expression of leptin and leptin receptor (OB-R) in human breast cancer. Clin. Cancer Res. Off. J. Am. Assoc. Cancer Res. 2004, 10, 4325–4331.
- Saxena, N.K.; Sharma, D.; Ding, X.; Lin, S.; Marra, F.; Merlin, D.; Anania, F.A. Concomitant activation of the JAK/STAT, PI3K/AKT, and ERK signaling is involved in leptin-mediated promotion of invasion and migration of hepatocellular carcinoma cells. Cancer Res. 2007, 67, 2497–2507.
- Sharma, D.; Saxena, N.K.; Vertino, P.M.; Anania, F.A. Leptin promotes the proliferative response and invasiveness in human endometrial cancer cells by activating multiple signal-transduction pathways. Endocr. Relat. Cancer 2006, 13, 629–640.
- Carino, C.; Olawaiye, A.B.; Cherfils, S.; Serikawa, T.; Lynch, M.P.; Rueda, B.R.; Gonzalez, R.R. Leptin regulation of proangiogenic molecules in benign and cancerous endometrial cells. Int. J. Cancer 2008, 123, 2782–2790.
- Chen, C.; Chang, Y.C.; Liu, C.L.; Liu, T.P.; Chang, K.J.; Guo, I.C. Leptin induces proliferation and anti-apoptosis in human hepatocarcinoma cells by up-regulating cyclin D1 and down-regulating Bax via a Janus kinase 2-linked pathway. Endocr. Relat. Cancer 2007, 14, 513–529.
- Gao, R.; Kim, C.; Sei, E.; Foukakis, T.; Crosetto, N.; Chan, L.K.; Srinivasan, M.; Zhang, H.; Meric-Bernstam, F.; Navin, N. Nanogrid single-nucleus RNA sequencing reveals phenotypic diversity in breast cancer. Nat. Commun. 2017, 8, 228.
- Kim, C.; Gao, R.; Sei, E.; Brandt, R.; Hartman, J.; Hatschek, T.; Crosetto, N.; Foukakis, T.; Navin, N.E. Chemoresistance Evolution in Triple-Negative Breast Cancer Delineated by Single-Cell Sequencing. Cell 2018, 173, 879–893.
- Azizi, E.; Carr, A.J.; Plitas, G.; Cornish, A.E.; Konopacki, C.; Prabhakaran, S.; Nainys, J.; Wu, K.; Kiseliovas, V.; Setty, M.; et al. Single-Cell Map of Diverse Immune Phenotypes in the Breast Tumor Microenvironment. Cell 2018, 174, 1293–1308.
- Chung, W.; Eum, H.H.; Lee, H.O.; Lee, K.M.; Lee, H.B.; Kim, K.T.; Ryu, H.S.; Kim, S.; Lee, J.E.; Park, Y.H.; et al. Single-cell RNA-seq enables comprehensive tumour and immune cell profiling in primary breast cancer. Nat. Commun. 2017, 8, 15081.
- Peng, S.; Hebert, L.L.; Eschbacher, J.M.; Kim, S. Single-Cell RNA Sequencing of a Postmenopausal Normal Breast Tissue Identifies Multiple Cell Types That Contribute to Breast Cancer. Cancers 2020, 12, 3639.
- Uhlen, M.; Bjorling, E.; Agaton, C.; Szigyarto, C.A.; Amini, B.; Andersen, E.; Andersson, A.C.; Angelidou, P.; Asplund, A.; Asplund, C.; et al. A human protein atlas for normal and cancer tissues based on antibody proteomics. Mol. Cell. Proteom. Mcp 2005, 4, 1920–1932.
- Mhaidat, N.M.; Alzoubi, K.H.; Kubas, M.A.; Banihani, M.N.; Hamdan, N.; Al-Jaberi, T.M. High levels of leptin and non-high molecular weight-adiponectin in patients with colorectal cancer: Association with chemotherapy and common genetic polymorphisms. Biomed. Rep. 2021, 14, 13.
- Maroni, P.; Luzzati, A.; Perrucchini, G.; Cannavo, L.; Bendinelli, P. Leptin, Leptin Receptor, KHDRBS1 (KH RNA Binding Domain Containing, Signal Transduction Associated 1), and Adiponectin in Bone Metastasis from Breast Carcinoma: An Immunohistochemical Study. Biomedicines 2020, 8, 510.
- Yu, H.; Pan, R.; Qi, Y.; Zheng, Z.; Li, J.; Li, H.; Ying, J.; Xu, M.; Duan, S. LEPR hypomethylation is significantly associated with gastric cancer in males. Exp. Mol. Pathol. 2020, 116, 104493.
- Kashiwagi, E.; Abe, T.; Kinoshita, F.; Ushijima, M.; Masaoka, H.; Shiota, M.; Netto, G.J.; Eto, M.; Miyamoto, H. The role of adipocytokines and their receptors in bladder cancer: Expression of adiponectin or leptin is an independent prognosticator. Am. J. Transl. Res. 2020, 12, 3033–3045.
- Kamel, H.F.M.; Nassir, A.M.; Al Refai, A.A. Assessment of expression levels of leptin and leptin receptor as potential biomarkers for risk of prostate cancer development and aggressiveness. Cancer Med. 2020, 9, 5687–5696.
- Cymbaluk-Ploska, A.; Gargulinska, P.; Chudecka-Glaz, A.; Kwiatkowski, S.; Pius-Sadowska, E.; Machalinski, B. The Suitability of FGF21 and FGF23 as New Biomarkers in Endometrial Cancer Patients. Diagnostics 2020, 10, 414.


