 +1 credit
| Version | Summary | Created by | Modification | Content Size | Created at | Operation |
|---|---|---|---|---|---|---|
| 1 | José Rodríguez-Alvarez | + 4307 word(s) | 4307 | 2021-02-07 02:18:02 | | | |
| 2 | Peter Tang | Meta information modification | 4307 | 2021-03-18 12:54:32 | | |
Video Upload Options
Pathogenic processes underlying Alzheimer’s disease (AD) affect synaptic function from initial asymptomatic stages, long time before the onset of cognitive decline and neurodegeneration. Therefore, reliable biomarkers enabling early AD diagnosis and prognosis are needed to maximize the time window for therapeutic interventions. MicroRNAs (miRNAs) have recently emerged as promising cost-effective and non-invasive biomarkers for AD, since they can be readily detected in different biofluids, including cerebrospinal fluid (CSF) and blood. Moreover, a growing body of evidence indicates that miRNAs regulate synaptic homeostasis and plasticity processes, suggesting that they may be involved in early synaptic dysfunction during AD.
1. Introduction
Alzheimer’s disease (AD) is a progressive and irreversible brain disorder and the most frequent form of dementia among the elderly, reaching nearly 70% of cases [1][2]. Although the development of the disease is variable between patients, three phases can be distinguished as part of a continuous process of degeneration (Figure 1): (1) The preclinical phase, usually lasting more than 10 years, characterized by early changes in biomarkers in the absence of clinical symptoms; (2) the prodromal phase comprising the earliest symptomatic stage of the disease when cognitive decline starts to be evident while biomarker levels do not reach the cutoff criteria for diagnosing dementia [3], and (3) a dementia stage in which the pathology and symptomatology is fully developed [4]. The duration of each phase is not constant but rather depends on the age of onset, gender, and genetic risk factors [5].
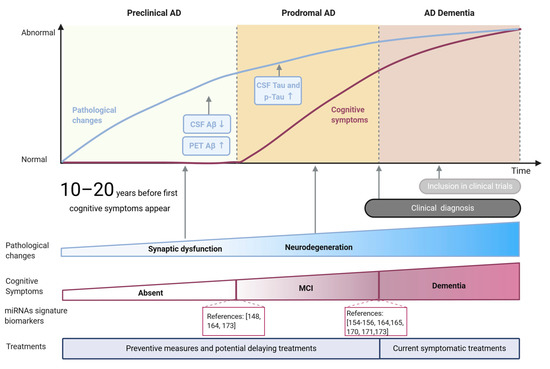
Figure 1. Main stages and features of Alzheimer’s disease. Pathological changes and cognitive symptoms are represented as blue and brown lines, respectively. Pathological hallmarks currently used as biomarkers (Aβ and tau) are shown in blue rectangles, while key global pathological changes are indicated with arrows. Cognitive symptoms are summarized as MCI (mild cognitive impairment) and dementia stages. miRNA-based signatures for potential diagnosis of MCI and AD stages are indicated as references.
The development of these stages is related to the spread of pathological changes across different brain regions. AD pathological hallmarks, comprising accumulation of amyloid-β peptide (Aβ) aggregates forming extracellular plaques, and hyperphosphorylated species of tau microtubule-associated protein, forming intraneuronal neurofibrillary tangles (NFTs) are known to follow an anatomical-temporal pattern starting in the temporal lobe and spreading to neocortical areas at later stages [6][7]. Although amyloid plaques are irregularly distributed in the brain, and their accumulation does not correlate with cognitive impairment [8], NFTs tau pathology progress pattern tends to be mostly maintained between patients [6]. Due to the stability of this pattern, NFTs pathology is the base of the most used pathological classification of the disease, established by Braak and Braak three decades ago [6]. The first two stages (I-II) could be associated with a preclinical phase of the disease, where tau pathology is mainly focused on the entorhinal cortex with subtle hippocampus affection [7][9] accompanied by synaptic function alteration. In stages III-IV the pathology affects the subcortical limbic region and clinically might correspond to the prodromal phase. Finally, during the last stages (V-VI), the pathology spreads to most neocortical areas [6][7] with observable extensive neuronal death, corresponding with AD dementia [6][9]. Increasing evidence in AD experimental models suggest that this progression pattern arises from trans-synaptic propagation of misfolded tau between established neural circuits [10].
Despite the huge amount of work done in the field during the last decades, and the significant advances achieved, our knowledge of the mechanisms underlying this multifactorial complex disease is still limited. This fact added to the lack of accessible and reliable methods for detecting preclinical phases has probably led to the failure of potential therapies so far [11]. In this regard, both preclinical and prodromal stages represent a potential therapeutic window where novel pharmacological and non-pharmacological therapies are more likely to delay the progression of the disease and improve the lives of patients. Therefore, it is urgent to improve the tools currently available to achieve a reliable and earlier detection of AD, ideally during initial phases characterized by alteration of synaptic function [12].
2. Synaptic Function and Synaptic Alteration in AD
Changes in synapses’ structure and function involve gene regulatory networks controlling spine development, maturation, and maintenance. Interestingly, mutations in genes encoding synaptic proteins, and mutations in genes related to Aβ metabolism/clearance have been related to AD risk [13]. An increasing amount of evidence indicates that cognitive decline observed in the early stages of neurodegenerative diseases such as AD is a consequence of synaptic alterations that occurs before neurodegeneration takes place [14][15]. Since aberrant changes in dendritic spine morphology and density linked to altered number and function of neurotransmitter receptors contribute to synaptic failure in AD [15], better knowledge of both physiology and pathology of synapses is necessary to understand the mechanisms underlying AD pathology.
Synapses are dynamic structures whose correct function requires highly specialized molecular machinery at both pre- and post-synaptic terminals. Whereas pre-synaptic terminals are structurally similar in inhibitory and excitatory synapses, post-synaptic compartments differ in their organization [16]. Inhibitory synapses are typically located at the dendritic shaft or even at the neuronal soma where gephyrin anchors GABA receptors in the membrane. On the contrary, excitatory synapses containing glutamate receptors mostly rely on the dendritic spine structure, specialized protrusions of diverse sizes and shapes that allow a greater concentration of synapses in a compact area of the post-synaptic terminal [17]. Formed by a complex organization of scaffold proteins (including homer, shank, and PSD-95 protein families), the post-synaptic density (PSD) supports the structure of the post-synapse, anchoring ionotropic glutamate N-methyl-d-aspartate receptors (NMDAR) and synaptic α-amino-3-hydroxy-5-methylisoxazole-4-propionic acid receptors (AMPAR) as well as metabotropic glutamate receptors (mGluRs) in the cell surface together with a large number of signaling molecules and actin filaments [18].
Synapses are able to modify their structure and function upon neural activity, adapting the strength or efficacy of synaptic transmission to different contexts in a process known as synaptic plasticity [19]. Between several synaptic plasticity mechanisms that can occur in pre- and post-synaptic compartments, the most widely studied and understood are long-term potentiation (LTP) and long-term depression (LTD) processes in which both NMDAR and AMPAR could be involved. Initial Ca2+ influx through post-synaptic NMDAR regulates the recruitment or removal of synaptic AMPAR, reinforcing or weakening synaptic transmission, respectively, processes thought to underlie learning and memory functions [20][21].
The PSD-95 family is the most abundant post-synaptic scaffolding protein within the PSD containing three protein-protein interaction motifs (PDZ domains) that facilitate signal coupling by bringing together cytoplasmic signaling molecules such as kinases and phosphatases close to their substrate, controlling receptor assembling at synapses [18][22]. Different members of the PSD-95 family mediate AMPAR targeting to mature synapses supporting synaptic transmission and are also able to interact with transmembrane AMPAR regulatory proteins (TARP) stabilizing new synaptic AMPAR at the synapse [23]. Moreover, PSD-95 connects pre- and post-synaptic elements through the interaction with cell-adhesion molecules (CAMs) such as, neuroligins, neurexins, ephrins, or cadherins [24][25]. CAMs, at the same time, can be linked to F-actin cytoskeleton, giving a stable but flexible structure to the dendritic spines that underlies synaptic communication.
As expected, synaptic dysfunction observed in early AD patients is associated with extensive loss of synaptic markers [26][27] and a relationship between dysregulation of synaptic proteins and early cognitive dysfunction has been remarked [27][28]. Cognitive function evaluated by tests such as the Mini-Mental State Exam (MMSE) or the delayed word list recall tests that evaluate hippocampus-dependent tasks exhibit a positive correlation with the number of synapses in brain related areas as the hippocampus and frontal cortex of early AD patients [14][29].
Interestingly, synaptic density constitutes a better correlation with clinical symptoms than classical AD histopathological markers such as amyloid plaques and NFT [14][26][29][30]. In this regard, solid evidence indicates that oligomeric forms of Aβ (oAβ), instead of amyloid plaques, contribute to synaptic alterations and correlate with synaptic loss [12][31][32][33]. In the same line, it has been described that Aβ aggregation is enriched at synapses even before the formation of amyloid plaques or tau NFT [34].
Accordingly, oAβ are thought to initiate the pathological events described as the amyloid cascade hypothesis [35], according to which changes in Aβ metabolism result in its oligomerization that initially triggers disruption and loss of synaptic connections follow by inflammatory response involving microglial and astrocytic activation, alteration of calcium homeostasis and oxidative stress resulting in neurodegeneration. Indeed, oAβ were shown to alter pre-synaptic functions such as axonal transport, synaptic vesicles trafficking and recycling, and neurotransmitter release [36]. Moreover, evidence indicate that oAβ also affect post-synaptic function and are especially toxic to glutamatergic synapses. Dysregulation of glutamatergic transmission is the main described mechanism by which oAβ could alter spines shape and number [33][37][38][39][40] leading to synaptic failure [37]. For instance, the cascade triggered by oAβ affect the regulation of downstream kinases and phosphatases that increase NMDAR and AMPAR internalization [28][37][40], creating an imbalance between LTP and LTD. While these structural and functional alterations have been shown to contribute to cognitive dysfunction present in AD patients [41], several studies have also linked AMPAR decrease in the cell surface with synaptic alterations in AD experimental models, including primary neuronal cultures and transgenic mice models [28][42] in which, interestingly, a correlation also exists with learning and memory deficits [27][28]. Moreover, loss of synapses in the CA1 of transgenic mice models of AD are consistent with the synapse loss described in AD [15].
Furthermore, oAβ would facilitate tau phosphorylation, which in turn decreases its affinity for microtubules and facilitates its aggregation and NFTs formation contributing to signaling deficiency and neurodegeneration [43]. On the other hand, besides the well-known role of tau in microtubule assembly, studies in transgenic mice highlighted a dendritic role for tau during synaptic pathology [44][45][46]. During pathological processes, tau is able to bind to scaffolding proteins and glutamate receptors at the PSD affecting synaptic function by altering LTP-LTD balance [32]. In addition, tau has been shown to be necessary for Src-family tyrosine kinase Fyn recruitment to post-synaptic NMDAR complexes in a mechanism that mediates Aβ excitotoxicity [46]. Thus, both Aβ and tau constitute key pathogenic players in early neurodegenerative processes linked to AD [32], and they are thought to interact locally at synapses leading to synaptic failure and cognitive impairment [30][47][48].
3. miRNAs as Mediators of Synaptic Dysfunction in AD
Increasing evidence indicates that the alteration of protein functionality in the synapse could be involved in early synaptic alterations in AD [26][27]. Given the regulatory role of miRNAs, those miRNAs targeting synaptic-related proteins may be an important mechanism underlying the synaptic dysfunction present in early stages of the disease [49]. Thus, alterations in the levels of specific miRNAs could be important in the development of synaptic pathology that leads to neurodegeneration in AD by modifying the synaptic structure and function that underlie synaptic plasticity. In addition, miRNAs are capable of regulating the mechanisms of toxicity mediated by central factors of the pathology such as tau and Aβ. Moreover; miRNAs can be enveloped in membranous vesicles that can be released to the peripheral circulation in the form of extracellular vesicles such as exosomes, favoring miRNAs conservation [50]. In this context, it is reasonable to think that the possibility of detecting alteration in the levels of specific miRNAs during pathology constitutes a valuable tool for AD detection. Indeed, these facts have opened a very prolific field with an increasing number of candidates to be used as biomarkers for AD, among which, synaptic-related miRNAs seem the most promising candidates as biomarkers for the detection of early stages of AD since synaptic dysfunction precedes neurodegeneration and the clinical symptoms.
4. miRNAs as Biomarkers of AD
4.1. Current Biomarkers for AD
The increasing incidence of AD project devastating numbers: 152 million people will be living with dementia by 2050 [51] while the annual cost of dementia will reach 1 trillion dollars. The massive impact of the disease on the health and economic systems, as well as on families and caregivers, raises the pressure to accelerate the search for effective treatments able to, at least, delay the disease progression, but also to validate diagnostic tools that enable earlier detection of the disease [51]. Since MCI patients converted to AD at an annual rate of 17.2 percent [52], an earlier diagnosis would allow a better scenario for potential therapies to succeed, avoiding the limitation of an environment where neuronal death is already widespread and allowing the inclusion in clinical studies of patients in early stages of the disease, increasing the possibility of achieving better therapeutic results.
Currently, the use of biomarkers that can identify AD during its asymptomatic phase [53][54][55] is limited to Aβ1–42/Tau levels in cerebrospinal fluid (CSF) and imaging techniques such as the positron emission tomography (PET) that allow the observation of Aβ accumulation in the brain or 18F-fluorodeoxyglucose-PET (FDG-PET) to detect the decrease in glucose metabolic rate. Even combination of imaging approaches at different stages of the diagnosis are being evaluated to improve the available diagnostic tools [56]. However, due to their invasiveness and/or cost, they are not able to be included in routine clinical screenings, needed for early detection. In addition, recent studies discourage the use of CSF Aβ levels as a tool for detecting MCI cases since the accuracy in these cases is lower than recommended [57].
A promising candidate for monitoring disease progression and treatment response in pre-clinical research is the Neurofilament Light Chain (NfL). Remarkably, work done on the Dominantly Inherited Alzheimer Network (DIAN) demonstrated that the increased NfL levels in serum and CSF predict disease progression and brain neurodegeneration at asymptomatic stages of familial AD [58]. Of importance, NfL would constitute a general marker of neurodegeneration regardless of the subjacent cause [59].
4.2. Synaptic-Related miRNAs as Early Biomarkers for AD
The potential value of other molecules present in biological fluids (including CSF, blood, urine, and tears) to differentiate between AD and control subjects are also under evaluation. In this regard, miRNAs, close modulators of the specific pathogenic processes underlying AD and present in all these circulating fluids, are presented as promising candidates. Easily measured by simple and affordable techniques, including quantitative real-time PCR (RT-qPCR), miRNAs detection would allow a cost-effective and non-invasive method that could certainly be included in screening studies and patient follow-up over time.
miRNAs dysregulated either in brain or circulating fluids during AD pathology have been described over the last years and are the subject of recent review articles [60][61]. Some miRNAs already commented in this review (including miR-26b, miR-34a/c, miR-125b, miR-146a, and miR-210) have been described to be altered in brain and blood from AD patients, although the direction of changes is not always consistent between both miRNA sources [60][61]. Moreover, miRNAs isolated from AD plasma and serum (including miR-107, miR342-3p, miR-15b-5p, miR-545-3p, and miR-191-5p) have been proposed as potential AD biomarkers [60]. In addition, miR-455-3p, related to Aβ toxicity modulation, has been proposed as potential AD biomarker since increased levels observed in serum are consistent with levels in AD brains, fibroblasts, lymphocytes, and even AD transgenic models. Furthermore, a panel of miRNAs involved in pathological processes underlying AD, such as neuroinflammation, has been proposed as a diagnostic tool to predict AD onset, since the ability of a single miRNA to detect prodromal AD has not been fully demonstrated [61].
While intensive research is being done on miRNA-based biomarkers for AD, the relationship between synaptic function regulation and AD biomarkers is not present in many studies in the field. Most relevant findings in synaptic-related miRNAs obtained from circulating biofluids of MCI and AD patients and their potential value as biomarkers are summarized in Table 2, where it is evident that most studies have been done in blood samples, including serum and plasma, indicating an interest to explore less invasive biomarkers.
For instance, miR-132 decrease in serum from MCI and AD patients [62][63] has been reproduced in plasma samples [64], however an increase has also been reported in MCI subjects by Sheinerman and colleagues [65], evidencing that reproducibility between studies can be difficult even when obtaining miRNAs from the same sample source. In the same study, they have also reported the increase of another member of the same family, miR-134, and remarkably, both miRNAs showed notable performance with an area under the curve (AUC) over 0.9 (close to the ideal value of 1, which represents the maximum accuracy of a classifier distinguishing between two groups [66] and sensitivity between 82% and 86% for detection of MCI cases. Interestingly, miR-132 has also been proposed as a member of a serum-based signature for MCI detection, together with miR-206, which is also downregulated in MCI serum [63]. With an outstanding AUC of 0.98, a sensitivity of 85%, and specificity of 98%, this synaptic-related miRNA signature seems certainly promising.
The use of miRNA-based signatures, which consider the alteration of more than one miRNA at the same time, can give higher accuracy, sensitivity, and specificity values that could be an advantage for potential diagnostic tools as exposed in Table 1.
Table 1. miRNA-based signatures including at least one synaptic-related miRNAs proposed as MCI-AD biomarker.
| Source | Cohort | AUC | Sen/Spec (%) | NDD Tested/Specific for AD? | Other Biomarkers | Cognitive Test | Ref. | |
|---|---|---|---|---|---|---|---|---|
|
miR-9/miR-874 miR-329/miR-181a miR-99/let-7e |
Plasma |
HC = 50 AD = 50 |
0.96 |
88/96 |
PD-FTD/No |
CSF Aβ CSF tau |
MMSE |
[67] |
|
miR-23a, miR-29a, miR-125b, miR-22 |
Serum |
HCC = 30 AD = 30 |
0.84 |
80/72 |
MMSE |
[68] |
||
|
miR-26a-5p, miR-107, miR-26b-5p, miR-112, miR-161, let-7d-3p, miR-5010-3p, miR-1285-5p, miR-151a-3p, miR-103a-3p, miR-532-5p, let-7f-5p. |
Blood |
HCC = 22 + 21 MCI = 18 AD = 94 |
0.84 0.93 |
81/88 95/95 |
PD-MS/Yes |
MMSE |
[69] |
|
|
miR-206, miR-132 |
Serum |
HCC = 76 MCI = 66 |
0.98 |
85/98 |
[63] |
|||
|
miR-30a-5p, miR-34c, miR-27a-3p, piR_019949, piR_020364 |
CSF exosomes |
HCC = 38 + 44 MCI = 17 AD = 23 + 19 |
0.83 |
CSF Aβ CSF tau |
MMSE |
[70] |
||
|
miR26b, miR125b |
CSF |
HCC = 18 AD = 22 |
0.80 |
CSF Aβ CSF tau |
MMSE |
[71] |
||
|
miR-191, miR-15b |
Plasma |
HCC = 20 + 17 MCI = 9 AD = 11 + 20 |
0.96 |
95/82 |
MMSE |
[72] |
||
|
miR-92a-3p, miR-181c-5p, miR-210-3p |
Plasma |
HCC = 14 + 24 MCI = 26 AD = 56 |
0.90 0.85 |
85/86 93/71 |
FTD/Yes |
MMSE GDS |
[73] |
|
|
miR-26a-5p, miR-181c-3p, miR-126-5p, miR-22-3p, miR-148b-5p, miR-106b3p, miR-6119-5p, miR-1246 and miR-660-5p |
Serum |
HCC = 9 + 86 AD = 19 + 121 |
0.99 |
93/99 |
MMSE CDR |
[74] |
Synaptic-related miRNAs within each signature are highlighted in bold letters. Discovery cohorts and validation cohorts (D + V) are shown when reported. Control subject are referred in all cases as HCC: Healthy cognitive controls. MCI: Mild cognitive impairment. AD: Alzheimer’s disease. AUC: Area under the curve, sensitivity and specificity values for the combination of miRNAs in the signature are included when available. If more than one diseased cohort, several AUC values are included and are shown in the same line corresponding to the group being compared to HCC. Other neurodegenerative diseases (NDD) tested in the same study are reported: PD: Parkinson’s disease, MS: Multiple sclerosis, FTD: Frontotemporal dementia. Specificity of miRNA changes for detecting MCI and/or AD subjects is indicated with YES; when miRNA changes are also present in other tested NDD, No is indicated. Cognitive tests used for patients’ inclusion in each cohort are indicated as MMSE: Mini-Mental State Examination and GDS: Geriatric Depression Scale. CDR: Clinical dementia rating.
In this regard, another signature based in four serum-miRNA levels, including synaptic-related miR-29a, miR-125b, and miR-23a has shown an encouraging performance for differentiating AD cases from healthy cognitive controls (HCC) [68]. The diagnostic value of miR-29a/b family has been tested both in serum and CSF [75][68][62][76][77] although results are not consistent between studies, the alteration of these miRNAs in biological fluids during AD pathology seems to be clear. On the other hand, miR-125b and miR-23a increase has been consistently observed in serum [68][78], displaying good capacity of differentiation between AD and control subjects specifically for miR-125b alone. The potential of miR-125b has also been tested in CSF [71][76], where it has been proposed as a specific tool since, in addition, it is able to distinguish AD from FTD patients [71]. An increase in related miR-125a levels has also been described in CSF from AD patients [62][77], constituting a potential biomarker as previously reported, with special value differentiating also AD from FTD patients [62].
Altered levels of miR-34a were observed both in plasma and CSF [79][76][80], and values near 0.8 were reported for the AUC for plasma-based miRNA performance as AD biomarker. Another member of miR-34 family, miR-34c, was reported to be increased in plasma samples from AD patients, and more interestingly, in mild AD patients [79]. Furthermore, both family members have been included in a signature combining miRNA and piRNAs (PIWI-interacting RNAs) that can distinguish AD cases with 83% accuracy. Although the great value of this signature is predicting the conversion of MCI to AD, this capacity is due to piRNAs levels [70].
Regarding longitudinal studies, to our knowledge, only a few articles have evaluated miRNA levels over time as a predictive tool of MCI progression to AD. Indeed, miR-206 (mentioned above for its potential to distinguish MCI patients) has also shown a good prognostic capacity to classify MCI progression to AD over five years [81]. In another study, miR-181a and miR-146a levels in blood from MCI patients have been documented as a useful tool to distinguish between MCI patients that progress to AD (pMCI) and those who remain stable in MCI state (sMCI) two years after the first measure [82]. The levels in serum of another member of the family, miR-181c, have also been reported to distinguish MCI and AD from control subjects, although the direction of level changes is inconsistent between studies [75][74][78]. Interestingly, an increase in miR-181c in plasma samples from MCI and AD patients has been reported to be specific compared with an FTD cohort [73]. Moreover, both miR-181a and miR-181c have been included in individual plasma-based miRNA signatures. The first one, composed of six miRNAs [67], also include miR-9, which levels have been reported to similarly be altered in whole-blood [83], serum [75], and exosome-enriched CSF [84] from AD patients compared to HCC. With a high AUC, sensitivity, and specificity, this signature can differentiate AD, PD, and FTD from HCC, constituting a useful tool for detecting general neurodegeneration. Interestingly, the signature including miR-181c, is composed of two other synaptic-related miRNAs: miR-92a-3p and miR-210-3p, and besides the potential for distinguishing MCI and AD patients from HCC, promising preliminary results were reported in the signature capacity for evaluating MCI progression to AD after a follow-up of the patients from 1 to 11 years [73]. The potential value of miR-92a as biomarker for AD has also been evaluated in serum, where its levels were shown to be decreased during AD pathology [62].
miR-26b consistent upregulation has been reported in serum and whole blood samples from AD patients [71][85][86], whereas downregulation of miR-26a [74] has been reported in a study that comprised one of the biggest cohorts of AD patients included in this review. While miR-26b levels in CSF samples exhibited specificity for AD detection with an AUC value of 0.82 and the capacity to distinguish AD from FTD patients [71]; differentiation between AD and FTD patients was not possible in serum despite a higher AUC (0.97) for AD cohort [62]. Interestingly, both members of the family were comprised in a blood-based miRNA signature with other 10 miRNAs [69] including miR-107, also proposed itself as plasma biomarker for MCI and AD detection. Remarkably, this signature was tested in other neurodegenerative diseases, such as MS and PD, exhibiting specificity for MCI and AD detection. Furthermore, while miR-26b was also included in a CSF-based signature together with miR-125b [71]; miR-26a was included in serum-based miRNA signature together with miR-181c and other four miRNAs. This last signature’s AUC, sensitivity, and specificity is the highest included in this review for detecting AD cases, with 0.99 accuracy, 93% sensitivity and 99% specificity [74].
miR-137 and miR-501, both known to target GRIA1, have been proposed as potential AD biomarkers after decreased levels identification in serum [75][87], while miR-128 [65] and miR-191 [72] have been proposed as plasma-based biomarkers for AD with an AUC performance over 0.95. miR-191 has been considered together with miR-15 for diagnostic value improvement, and slightly better results were achieved, especially for specificity [72].
Consistent downregulation of miR-146a levels was reported in serum, plasma, and CSF from AD patients [62][76]. Despite the small cohort size, downregulation of miR-451 was also observed in plasma EVs with high AUC value distinguishing AD cases from HCC and specific results compared to Dementia with Lewy bodies (DLB) plasma samples [88]. Increased levels of miR-485-3p were reported in AD serum compared to healthy controls, with an AUC value of 0.93 differentiating both groups [89].
4.3. Potential and Limitations of Synaptic-Related miRNAs as Early AD Biomarkers
As mentioned above, miRNAs could also be isolated from exosome-enriched or EVs fraction, though the best source for obtaining miRNAs-enriched samples is still unclear. Some studies propose that exosome-related miRNAs could represent a stable source of miRNAs over time and differentially expressed during pathological states [90][91], whereas other reports suggest that miRNAs expression within exosomes could be certainly low [92]. Even miRNAs included in vesicles and whole plasma cell-free miRNA profiles have been reported to be different [93]. The possibility of diverse miRNA sources, including CSF, plasma, and serum, is an advantage but also raises a problem when looking for reproducibility between studies. However, limitation goes beyond the above mentioned, since reported changes are often inconsistent within the same sample type, as observable in Table 2. The cohort size the parameters used for groups classification, subjects’ inclusion–exclusion criteria, miRNAs extraction and quantification methods, and statistical analysis performed, could make intricate the comparison between studies. Moreover, although the ROC curve analysis is not the only method available for testing diagnostic value, it is certainly the most used. However, the information given in some studies is limited to the significant or not significant differential expression between groups, which beyond the importance of this information; it does not determine the diagnostic value of a molecule itself.
The advantages and potential value of miRNAs as early biomarkers for AD highlight the urgent need for protocols standardization as an essential tool that would allow a faster progress in obtaining more reliable results in order to bring the advances to the clinics. Remarkably, molecular diagnostics companies, such as DiamiR, are already developing and commercializing miRNA-based technologies, constituting a reflection of the progress made in the area and the real possibilities of incorporating miRNAs as biomarkers for AD not only in screening and diagnosis but also as a valuable tool for improving definition of clinical trials participants.
References
- Prince, M.; Comas-Herrera, A.; Knapp, M.; Guerchet, M.; Karagiannidou, M. World Alzheimer Report 2016 Improving Healthcare for People Living with Dementia Coverage, Quality and Costs Now and In the Future; World Alzheimer: London, UK, 2016.
- World Health Organization. Dementia Fact Sheet. Available online: (accessed on 8 August 2018).
- Dubois, B.; Hampel, H.; Feldman, H.H.; Scheltens, P.; Aisen, P.; Andrieu, S.; Bakardjian, H.; Benali, H.; Bertram, L.; Blennow, K. Preclinical Alzheimer’s disease: Definition, natural history, and diagnostic criteria. Alzheimer’s Dement. 2016, 12, 292–323.
- Jack, C.R.; Bennett, D.A.; Blennow, K.; Carrillo, M.C.; Dunn, B.; Haeberlein, S.B.; Holtzman, D.M.; Jagust, W.; Jessen, F.; Karlawish, J. NIA-AA Research Framework: Toward a biological definition of Alzheimer’s disease. Alzheimers Dement. 2018, 14, 535–562.
- Vermunt, L.; Sikkes, S.A.M.; van den Hout, A.; Handels, R.; Bos, I.; van der Flier, W.M.; Kern, S.; Ousset, P.-J.; Maruff, P.; Skoog, I.; et al. Duration of preclinical, prodromal, and dementia stages of Alzheimer’s disease in relation to age, sex, and APOE genotype. Alzheimer’s Dement. 2019, 15, 888–898.
- Braak, H.; Braak, E. Neuropathological stageing of Alzheimer-related changes. Acta Neuropathol. 1991, 82, 239–259.
- Hyman, B.T.; Van Hoesen, G.W.; Damasio, A.R.; Barnes, C.L. Alzheimer’s disease: Cell-specific pathology isolates the hippocampal formation. Science 1984, 225, 1168–1170.
- Querfurth, H.W.; LaFerla, F.M. Alzheimer’s Disease. N. Engl. J. Med. 2010, 362, 329–344.
- Braak, H.; Alafuzoff, I.; Arzberger, T.; Kretzschmar, H.; Del Tredici, K. Staging of Alzheimer disease-associated neurofibrillary pathology using paraffin sections and immunocytochemistry. Acta Neuropathol. 2006, 112, 389–404.
- Pooler, A.M.; Polydoro, M.; Wegmann, S.; Nicholls, S.B.; Spires-Jones, T.L.; Hyman, B.T. Propagation of tau pathology in Alzheimer’s disease: Identification of novel therapeutic targets. Alzheimers Res. Ther. 2013, 5, 49.
- Cummings, J.L.; Morstorf, T.; Zhong, K. Alzheimer’s disease drug-development pipeline: Few candidates, frequent failures. Alzheimer’s Res. Ther. 2014, 6, 1–7.
- Walsh, D.M.; Klyubin, I.; Fadeeva, J.V.; Cullen, W.K.; Anwyl, R.; Wolfe, M.S.; Rowan, M.J.; Selkoe, D.J. Naturally secreted oligomers of amyloid β protein potently inhibit hippocampal long-term potentiation in vivo. Nature 2002, 416, 535–539.
- Lambert, J.C.; Heath, S.; Even, G.; Campion, D.; Sleegers, K.; Hiltunen, M.; Combarros, O.; Zelenika, D.; Bullido, M.J.; Tavernier, B.; et al. Genome-wide association study identifies variants at CLU and CR1 associated with Alzheimer’s disease. Nat. Genet. 2009, 41, 1094–1099.
- DeKosky, S.T.; Scheff, S.W. Synapse loss in frontal cortex biopsies in Alzheimer’s disease: Correlation with cognitive severity. Ann. Neurol. 1990, 27, 457–464.
- Androuin, A.; Potier, B.; Nägerl, U.V.; Cattaert, D.; Danglot, L.; Thierry, M.; Youssef, I.; Triller, A.; Duyckaerts, C.; El Hachimi, K.H.; et al. Evidence for altered dendritic spine compartmentalization in Alzheimer’s disease and functional effects in a mouse model. Acta Neuropathol. 2018, 135, 839–854.
- Sheng, M.; Hoogenraad, C.C. The Postsynaptic Architecture of Excitatory Synapses: A More Quantitative View. Annu. Rev. Biochem. 2007, 76, 823–847.
- Harris, K.M.; Kater, S.B. Dendritic spines: Cellular specializations imparting both stability and flexibility to synaptic function. Annu. Rev. Neurosci. 1994, 17, 341–371.
- O’brien, R.J.; Xu, D.; Petralia, R.S.; Steward, O.; Huganir, R.L.; Worley, P. Synaptic Clustering of AMPA Receptors by the Extracellular Immediate-Early Gene Product Narp. Neuron 1999, 23, 309–323.
- Kandel, E.R. The molecular biology of memory: CAMP, PKA, CRE, CREB-1, CREB-2, and CPEB. Mol. Brain. 2012, 5, 14.
- Citri, A.; Malenka, R.C. Synaptic plasticity: Multiple forms, functions, and mechanisms. Neuropsychopharmacology 2008, 33, 18–41.
- Huganir, R.L.; Nicoll, R.A. AMPARs and synaptic plasticity: The last 25 years. Neuron 2013, 80, 704–717.
- Kim, E.; Sheng, M. PDZ domain proteins of synapses. Nat. Rev. Neurosci. 2004, 5, 771–781.
- Chowdhury, D.; Hell, J.W. Homeostatic synaptic scaling: Molecular regulators of synaptic AMPA-type glutamate receptors. F1000Research 2018, 7, 234.
- Hruska, M.; Henderson, N.T.; Xia, N.L.; Le Marchand, S.J.; Dalva, M.B. Anchoring and synaptic stability of PSD-95 is driven by ephrin-B3. Nat. Neurosci. 2015, 18, 1594–1605.
- Dean, C.; Dresbach, T. Neuroligins and neurexins: Linking cell adhesion, synapse formation and cognitive function. Trends Neurosci. 2006, 29, 21–29.
- Masliah, E.; Mallory, M.; Alford, M.; DeTeresa, R.; Hansen, L.A.; McKeel, D.W.; Morris, J.C. Altered expression of synaptic proteins occurs early during progression of Alzheimer’s disease. Neurology 2001, 56, 127–130.
- Reddy, P.H.; Mani, G.; Park, B.S.; Jacques, J.; Murdoch, G.; Whetsell, W.; Kaye, J.; Manczak, M. Differential loss of synaptic proteins in Alzheimer’s disease: Implications for synaptic dysfunction. J. Alzheimer’s Dis. 2005, 7, 103–117.
- Miñano-Molina, A.J.; España, J.; Martín, E.; Barneda-Zahonero, B.; Fadó, R.; Solé, M.; Trullás, R.; Saura, C.A.; Rodríguez-Alvarez, J. Soluble oligomers of amyloid-β peptide disrupt membrane trafficking of α-amino-3-hydroxy-5-methylisoxazole-4-propionic acid receptor contributing to early synapse dysfunction. J. Biol. Chem. 2011, 286, 27311–27321.
- Scheff, S.W.; Price, D.A.; Schmitt, F.A.; DeKosky, S.T.; Mufson, E.J.; Rubin, E.H.; Morris, J.C. Synaptic alterations in CA1 in mild Alzheimer disease and mild cognitive impairment. Neurology 2007, 68, 1501–1508.
- Selkoe, D.J. Alzheimer’s disease is a synaptic failure. Science 2002, 298, 789–791.
- Pickett, E.K.; Koffie, R.M.; Wegmann, S.; Henstridge, C.M.; Herrmann, A.G.; Colom-Cadena, M.; Lleo, A.; Kay, K.R.; Vaught, M.; Soberman, R.; et al. Non-Fibrillar Oligomeric Amyloid-within Synapses. J. Alzheimer’s Dis. 2016, 53, 787–800.
- Ittner, A.; Ittner, L.M. Dendritic Tau in Alzheimer’s Disease. Neuron 2018, 99, 13–27.
- Townsend, M.; Shankar, G.M.; Mehta, T.; Walsh, D.M.; Selkoe, D.J. Effects of secreted oligomers of amyloid β-protein on hippocampal synaptic plasticity: A potent role for trimers. J. Physiol. 2006, 572, 477–492.
- Bilousova, T.; Miller, C.A.; Poon, W.W.; Vinters, H.V.; Corrada, M.; Kawas, C.; Hayden, E.Y.; Teplow, D.B.; Glabe, C.; Albay, R., III; et al. Synaptic amyloid-b oligomers precede p-tau and differentiate high pathology control cases. Am. J. Pathol. 2016, 186, 185–198.
- Hardy, J.A.; Higgins, G.A. Alzheimer’s Disease: The Amyloid Cascade Hypothesis. Science 1992, 256, 184–185.
- Ovsepian, S.V.; O’Leary, V.B.; Zaborszky, L.; Ntziachristos, V.; Dolly, J.O. Synaptic vesicle cycle and amyloid β: Biting the hand that feeds. Alzheimer’s Dement. 2018, 14, 502–513.
- Hsieh, H.; Boehm, J.; Sato, C.; Iwatsubo, T.; Tomita, T.; Sisodia, S.; Malinow, R. AMPAR Removal Underlies Aβ-Induced Synaptic Depression and Dendritic Spine Loss. Neuron 2006, 52, 831–843.
- Parameshwaran, K.; Dhanasekaran, M.; Suppiramaniam, V. Amyloid beta peptides and glutamatergic synaptic dysregulation. Exp. Neurol. 2008, 210, 7–13.
- Lacor, P.N.; Buniel, M.C.; Furlow, P.W.; Sanz Clemente, A.; Velasco, P.T.; Wood, M.; Viola, K.L.; Klein, W.L. Ab Oligomer-Induced Aberrations in Synapse Composition, Shape, and Density Provide a Molecular Basis for Loss of Connectivity in Alzheimer’s Disease. J. Neurosci. 2007, 27, 796–807.
- Snyder, E.M.; Nong, Y.; Almeida, C.G.; Paul, S.; Moran, T.; Choi, E.Y.; Nairn, A.C.; Salter, M.W.; Lombroso, P.J.; Gouras, G.K.; et al. Regulation of NMDA receptor trafficking by amyloid-β. Nat. Neurosci. 2005, 8, 1051–1058.
- Wang, Z.-X.; Tan, L.; Liu, J.; Yu, J.-T. The Essential Role of Soluble Aβ Oligomers in Alzheimer’s Disease. Mol. Neurobiol. 2016, 53, 1905–1924.
- Baglietto-Vargas, D.; Prieto, G.A.; Limon, A.; Forner, S.; Rodriguez-Ortiz, C.J.; Ikemura, K.; Ager, R.R.; Medeiros, R.; Trujillo-Estrada, L.; Martini, A.C.; et al. Impaired AMPA signaling and cytoskeletal alterations induce early synaptic dysfunction in a mouse model of Alzheimer’s disease. Aging Cell 2018, 17, e12791.
- Wang, Y.; Mandelkow, E. Tau in physiology and pathology. Nat. Rev. Neurosci. 2016, 17, 22–35.
- Roberson, E.D.; Scearce-Levie, K.; Palop, J.J.; Yan, F.; Cheng, I.H.; Wu, T.; Gerstein, H.; Yu, G.-Q.; Mucke, L. Reducing endogenous tau ameliorates amyloid beta-induced deficits in an Alzheimer’s disease mouse model. Science 2007, 316, 750–754.
- Roberson, E.D.; Halabisky, B.; Yoo, J.W.; Yao, J.; Chin, J.; Yan, F.; Wu, T.; Hamto, P.; Devidze, N.; Yu, G.-Q. Amyloid- /Fyn-Induced Synaptic, Network, and Cognitive Impairments Depend on Tau Levels in Multiple Mouse Models of Alzheimer’s Disease. J. Neurosci. 2011, 31, 700–711.
- Ittner, L.M.; Ke, Y.D.; Delerue, F.; Bi, M.; Gladbach, A.; van Eersel, J.; Wölfing, H.; Chieng, B.C.; Christie, M.J.; Napier, I.A.; et al. Dendritic function of tau mediates amyloid-β toxicity in alzheimer’s disease mouse models. Cell 2010, 142, 387–397.
- Walsh, D.M.; Selkoe, D.J. Deciphering the molecular basis of memory failure in Alzheimer’s disease. Neuron 2004, 44, 181–193.
- Miller, E.C.; Teravskis, P.J.; Dummer, B.W.; Zhao, X.; Huganir, R.L.; Liao, D. Tau phosphorylation and tau mislocalization mediate soluble Ab oligomer-induced AMPA glutamate receptor signaling deficits. Eur. J. Neurosci. 2014, 39, 1214–1224.
- Park, I.; Kim, H.J.; Kim, Y.; Hwang, H.S.; Kasai, H.; Kim, J.H.; Park, J.W. Nanoscale imaging reveals miRNA-mediated control of functional states of dendritic spines. Proc. Natl. Acad. Sci. USA 2019, 116, 9616–9621.
- Luarte, A.; Henzi, R.; Fernández, A.; Gaete, D.; Cisternas, P.; Pizarro, M.; Batiz, L.F.; Villalobos, I.; Masalleras, M.; Vergara, R.; et al. Astrocyte-Derived Small Extracellular Vesicles Regulate Dendritic Complexity through miR-26a-5p Activity. Cells 2020, 9, 930.
- Alzheimer’s Disease International. World Alzheimer Report 2019: Attitudes to Dementia; Alzheimer’s Disease International: London, UK, 2019.
- Landau, S.M.; Harvey, D.; Madison, C.M.; Reiman, E.M.; Foster, N.L.; Aisen, P.S.; Petersen, R.C.; Shaw, L.M.; Trojanowski, J.Q.; Jack, C.R.; et al. Comparing predictors of conversion and decline in mild cognitive impairment. Neurology 2010, 75, 230–238.
- Sperling, R.A.; Aisen, P.S.; Beckett, L.A.; Bennett, D.A.; Craft, S.; Fagan, A.M.; Iwatsubo, T.; Jack, C.R.; Kaye, J.; Montine, T.J.; et al. Toward defining the preclinical stages of Alzheimer’s disease: Recommendations from the National Institute on Aging-Alzheimer’s Association workgroups on diagnostic guidelines for Alzheimer’s disease. Alzheimer’s Dement. 2011, 7, 280–292.
- Jack, C.R.; Knopman, D.S.; Jagust, W.J.; Petersen, R.C.; Weiner, M.W.; Aisen, P.S.; Shaw, L.M.; Vemuri, P.; Wiste, H.J.; Weigand, S.D.; et al. Tracking pathophysiological processes in Alzheimer’s disease: An updated hypothetical model of dynamic biomarkers. Lancet Neurol. 2013, 12, 207–216.
- El Kadmiri, N.; Said, N.; Slassi, I.; El Moutawakil, B.; Nadifi, S. Biomarkers for Alzheimer Disease: Classical and Novel Candidates’ Review. Neuroscience 2018, 370, 181–190.
- Chételat, G.; Arbizu, J.; Barthel, H.; Garibotto, V.; Law, I.; Morbelli, S.; van de Giessen, E.; Agosta, F.; Barkhof, F.; Brooks, D.J.; et al. Amyloid-PET and 18F-FDG-PET in the diagnostic investigation of Alzheimer’s disease and other dementias. Lancet Neurol. 2020, 19, 951–962.
- Ritchie, C.; Smailagic, N.; Noel-Storr, A.H.; Takwoingi, Y.; Flicker, L.; Mason, S.E.; Mcshane, R. Plasma and cerebrospinal fluid amyloid beta for the diagnosis of Alzheimer’s disease dementia and other dementias in people with mild cognitive impairment (MCI). Cochrane Database Syst. Rev. 2014, 2014.
- Preische, O.; Schultz, S.A.; Apel, A.; Kuhle, J.; Kaeser, S.A.; Barro, C.; Gräber, S.; Kuder-Buletta, E.; LaFougere, C.; Laske, C.; et al. Serum neurofilament dynamics predicts neurodegeneration and clinical progression in presymptomatic Alzheimer’s disease. Nat. Med. 2019, 25, 277–283.
- Khalil, M.; Teunissen, C.E.; Otto, M.; Piehl, M.; Sormani, M.P.; Gattringer, T.; Barro, C.; Kappos, L.; Comabella, M.; Fazekas, F.; et al. Neurofilaments as biomarkers in neurological disorders. Nat. Rev. Neurol. 2018, 14, 577–589.
- Swarbrick, S.; Wragg, N.; Ghosh, S.; Stolzing, A. Systematic Review of miRNA as Biomarkers in Alzheimer’s Disease. Mol. Neurobiol. 2019, 56, 6156–6167.
- Zhao, Y.; Jaber, V.; Alexandrov, P.N.; Vergallo, A.; Lista, S.; Hampel, H.; Lukiw, W.J. microRNA-Based Biomarkers in Alzheimer’s Disease (AD). Front. Neurosci. 2020, 14, 1–16.
- Denk, J.; Oberhauser, F.; Kornhuber, J.; Wiltfang, J.; Fassbender, K.; Schroeter, M.L.; Volk, A.E.; Diehl-Schmid, J.; Prudlo, J.; Danek, A.; et al. Specific serum and CSF microRNA profiles distinguish sporadic behavioural variant of frontotemporal dementia compared with Alzheimer patients and cognitively healthy controls. PLoS ONE. 2018, 13, e0197329.
- Xie, B.; Zhou, H.; Zhang, R.; Song, M.; Yu, L.; Wang, L.; Liu, Z.; Zhang, Q.; Cui, D.; Wang, X.; et al. Serum miR-206 and miR-132 as Potential Circulating Biomarkers for Mild Cognitive Impairment. J. Alzheimer’s Dis. 2015, 45, 721–731.
- Cha, D.J.; Mengel, D.; Mustapic, M.; Liu, W.; Selkoe, D.J.; Kapogiannis, D.; Galasko, D.; Rissman, R.A.; Bennett, D.A.; Walsh, D.M. miR-212 and miR-132 Are Downregulated in Neurally Derived Plasma Exosomes of Alzheimer’s Patients. Front. Neurosci. 2019, 13, 1208.
- Sheinerman, K.S.; Tsivinsky, V.G.; Abdullah, L.; Crawford, F.; Umansky, S.R. Plasma microRNA biomarkers for detection of mild cognitive impairment: Biomarker validation study. Aging 2013, 5, 925–938.
- Hajian-Tilaki, K. Receiver Operating Characteristic (ROC) Curve Analysis for Medical Diagnostic Test Evaluation. Casp. J. Intern. Med. 2013, 4, 627.
- Sheinerman, K.S.; Toledo, J.B.; Tsivinsky, V.G.; Irwin, D.; Grossman, M.; Weintraub, D.; Hurtig, H.I.; Chen-Plotkin, A.; Wolk, D.A.; McCluskey, L.F.; et al. Circulating brain-enriched microRNAs as novel biomarkers for detection and differentiation of neurodegenerative diseases. Alzheimers Res. Ther. 2017, 9, 89.
- Barbagallo, C.; Mostile, G.; Baglieri, G.; Giunta, F.; Luca, A.; Raciti, L.; Zappia, M.; Purrello, M.; Ragusa, M.; Nicoletti, A. Specific Signatures of Serum miRNAs as Potential Biomarkers to Discriminate Clinically Similar Neurodegenerative and Vascular-Related Diseases. Cell Mol. Neurobiol. 2020, 40, 531–546.
- Leidinger, P.; Backes, C.; Deutscher, S.; Schmitt, K.; Mueller, S.C.; Frese, K.; Haas, J.; Ruprecht, K.; Paul, F.; Stähler, C.; et al. A blood based 12-miRNA signature of Alzheimer disease patients. Genome Biol. 2013, 14, R78.
- Jain, G.; Stuendl, A.; Rao, P.; Berulava, T.; Pena Centeno, T.; Kaurani, L.; Burkhardt, S.; Delalle, I.; Kornhuber, J.; Hüll, M.; et al. A combined miRNA–piRNA signature to detect Alzheimer’s disease. Transl. Psychiatry 2019, 9, 250.
- Galimberti, D.; Villa, C.; Fenoglio, C.; Serpente, M.; Ghezzi, L.; Cioffi, S.M.G.; Arighi, A.; Fumagalli, G.; Scarpini, E. Circulating miRNAs as Potential Biomarkers in Alzheimer’s Disease. J. Alzheimer’s Dis. 2014, 42, 1261–1267.
- Kumar, P.; Dezso, Z.; MacKenzie, C.; Oestreicher, J.; Agoulnik, S.; Byrne, M.; Bernier, F.; Yanagimachi, M.; Aoshima, K.; Oda, Y. Circulating miRNA biomarkers for Alzheimer’s disease. PLoS ONE 2013, 8, e69807.
- Siedlecki-Wullich, D.; Català-Solsona, J.; Fábregas, C.; Hernández, I.; Clarimon, J.; Lleó, A.; Boada, M.; Saura, C.A.; Rodríguez-Álvarez, J.; Miñano-Molina, A.J. Altered microRNAs related to synaptic function as potential plasma biomarkers for Alzheimer’s disease. Alzheimer’s Res. Ther. 2019, 11, 46.
- Guo, R.; Fan, G.; Zhang, J.; Wu, C.; Du, Y.; Ye, H.; Li, Z.; Wang, L.; Zhang, Z.; Zhang, L.; et al. A 9-microRNA Signature in Serum Serves as a Noninvasive Biomarker in Early Diagnosis of Alzheimer’s Disease. J. Alzheimer’s Dis. 2017, 60, 1365–1377.
- Geekiyanage, H.; Jicha, G.A.; Nelson, P.T.; Chan, C. Blood serum miRNA: Non-invasive biomarkers for Alzheimer’s disease. Exp. Neurol. 2012, 235, 491–496.
- Kiko, T.; Nakagawa, K.; Tsuduki, T.; Furukawa, K.; Arai, H.; Miyazawa, T. MicroRNAs in plasma and cerebrospinal fluid as potential markers for Alzheimer’s disease. J. Alzheimer’s Dis. 2014, 39, 253–259.
- Müller, M.; Jäkel, L.; Bruinsma, I.B.; Claassen, J.A.; Kuiperij, H.B.; Verbeek, M.M. MicroRNA-29a Is a Candidate Biomarker for Alzheimer’s Disease in Cell-Free Cerebrospinal Fluid. Mol. Neurobiol. 2016, 53, 2894–2899.
- Tan, L.L.; Yu, J.-T.T.; Liu, Q.-Y.Y.; Tan, M.-S.S.; Zhang, W.; Hu, N.; Wang, Y.-L.L.; Sun, L.; Jiang, T.; Tan, L.L. Circulating miR-125b as a biomarker of Alzheimer’s disease. J. Neurol. Sci. 2014, 336, 52–56.
- Bhatnagar, S.; Chertkow, H.; Schipper, H.M.; Yuan, Z.; Shetty, V.; Jenkins, S.; Jones, T.; Wang, E. Increased microRNA-34c abundance in Alzheimer’s disease circulating blood plasma. Front. Mol. Neurosci. 2014, 7, 2.
- Cosín-Tomás, M.; Antonell, A.; Lladó, A.; Alcolea, D.; Fortea, G.; Ezquerra, M.; Lleó, A.; Martí, M.J.; Pallàs, M.; Sanchez-Valle, R.; et al. Plasma miR-34a-5p and miR-545-3p as Early Biomarkers of Alzheimer’s Disease: Potential and Limitations. Mol. Neurobiol. 2017, 54, 5550–5562.
- Kenny, A.; McArdle, H.; Calero, M.; Rabano, A.; Madden, S.F.; Adamson, K.; Forster, R.; Spain, E.; Prehn, J.H.M.; Henshall, D.C.; et al. Elevated plasma microRNA-206 levels predict cognitive decline and progression to dementia from mild cognitive impairment. Biomolecules 2019, 9, 734.
- Ansari, A.; Maffioletti, E.; Milanesi, E.; Marizzoni, M.; Frisoni, G.B.; Blin, O.; Richardson, J.C.; Bordet, R.; Forloni, G.; Gennarelli, M.; et al. miR-146a and miR-181a are involved in the progression of mild cognitive impairment to Alzheimer’s disease. Neurobiol. Aging 2019, 82, 102–109.
- Souza, V.C.; Morais, G.S.; Henriques, A.D.; Machado-Silva, W.; Perez, D.I.V.; Brito, C.J.; Camargos, E.F.; Moraes, C.F.; Nóbrega, O.T. Whole-Blood Levels of MicroRNA-9 Are Decreased in Patients With Late-Onset Alzheimer Disease. Am. J. Alzheimer’s Dis. Other Dementiasr. 2020, 35, 153331752091157.
- Riancho, J.; Vázquez-Higuera, J.L.; Pozueta, A.; Lage, C.; Kazimierczak, M.; Bravo, M.; Calero, M.; Gonalezález, A.; Rodríguez, E.; Lleó, A.; et al. MicroRNA Profile in Patients with Alzheimer’s Disease: Analysis of miR-9-5p and miR-598 in Raw and Exosome Enriched Cerebrospinal Fluid Samples. J. Alzheimer’s Dis. 2017, 57, 483–491.
- Satoh, J.I.; Kino, Y.; Niida, S. MicroRNA-Seq data analysis pipeline to identify blood biomarkers for alzheimer’s disease from public data. Biomark Insights 2015, 2015, 21–31.
- Denk, J.; Boelmans, K.; Siegismund, C.; Lassner, D.; Arlt, S.; Jahn, H. MicroRNA Profiling of CSF Reveals Potential Biomarkers to Detect Alzheimer`s Disease. Hoheisel JD, ed. PLoS ONE 2015, 10, e0126423.
- Hara, N.; Kikuchi, M.; Miyashita, A.; Hatsuta, H.; Saito, Y.; Kasuga, K.; Murayama, S.; Ikeuchi, T.; Kuwano, R. Serum microRNA miR-501-3p as a potential biomarker related to the progression of Alzheimer’s disease. Acta Neuropathol. Commun. 2017, 5, 10.
- Gámez-Valero, A.; Campdelacreu, J.; Vilas, D.; Ispierto, L.; Reñé, R.; Álvarez, R.; Armengol, M.P.; Borràs, F.E.; Beyer, K. Exploratory study on microRNA profiles from plasma-derived extracellular vesicles in Alzheimer’s disease and dementia with Lewy bodies. Transl. Neurodegener. 2019, 8, 31.
- Yu, L.; Li, H.; Liu, W.; Zhang, L.; Tian, Q.; Li, H.; Li, M. MiR-485-3p serves as a biomarker and therapeutic target of Alzheimer’s disease via regulating neuronal cell viability and neuroinflammation by targeting AKT3. Mol. Genet. Genomic Med. 2020.
- Lugli, G.; Cohen, A.M.; Bennett, D.A.; Shah, R.C.; Fields, C.J.; Hernandez, A.G.; Smalheiser, N.R. Plasma Exosomal miRNAs in Persons with and without Alzheimer Disease: Altered Expression and Prospects for Biomarkers. PLoS ONE 2015, 10, e0139233.
- Valadi, H.; Ekström, K.; Bossios, A.; Sjöstrand, M.; Lee, J.J.; Lötvall, J.O. Exosome-mediated transfer of mRNAs and microRNAs is a novel mechanism of genetic exchange between cells. Nat. Cell Biol. 2007, 9, 654–659.
- Chevillet, J.R.; Kang, Q.; Ruf, I.K.; Briggs, H.A.; Vojtech, L.N.; Hughes, S.M.; Cheng, H.H.; Arroyo, J.D.; Meredith, E.K.; Gallichotte, E.N.; et al. Quantitative and stoichiometric analysis of the microRNA content of exosomes. Proc. Natl. Acad. Sci. USA 2014, 111, 14888–14893.
- Endzelinš, E.; Berger, A.; Melne, V.; Bajo-Santos, C.; Sobolevska, K.; Abols, A.; Rodriguez, M.; Šantare, D.; Rudnickiha, A.; Lietuvietis, V.; et al. Detection of circulating miRNAs: Comparative analysis of extracellular vesicle-incorporated miRNAs and cell-free miRNAs in whole plasma of prostate cancer patients. BMC Cancer 2017, 17, 730.

