 +1 credit
| Version | Summary | Created by | Modification | Content Size | Created at | Operation |
|---|---|---|---|---|---|---|
| 1 | Alenka Vesel | + 6560 word(s) | 6560 | 2021-03-09 06:37:19 | | | |
| 2 | Bruce Ren | Meta information modification | 6560 | 2021-03-16 02:27:57 | | |
Video Upload Options
A suitable technique for localized surface treatment of solid materials is an atmospheric pressure plasma jet (APPJ). The properties of the APPJ plasma often depend on small details like the concentration of gaseous impurities what influences the surface kinetics. The simplest and often most useful configuration of the APPJ is presented, characterized by optical emission spectroscopy (OES), and results are discussed in view of various papers.
1. Introduction
A standard method for tailoring surface properties is a brief treatment of a solid material by non-equilibrium gaseous plasma. Plasma sustained in molecular gases is rich in reactive chemical species that interact with surfaces of different materials, causing its modification. A variety of gaseous plasmas have been used for the treatment of different materials. Non-equilibrium plasmas are divided into low-pressure [1] and atmospheric-pressure plasmas [2]. Low-pressure plasmas are usually sustained in the range of pressures between about 1 and 1000 Pa. In-between 1000 and 100,000 Pa (1 bar), there is a black zone rarely tackled by researchers. Gaseous plasma can also be sustained at pressures well above 1 bar, but the practical applications are limited. Low-pressure plasmas often occupy large volumes, so any material is treated rather uniformly over the entire surface facing the plasma. The application of such low-pressure plasmas for modification of a specific area on the surface of products is, however, limited because of the complicated handling of the products that should enter a vacuum chamber. Treatment of numerous products in the continuous mode thus represents a technological challenge when low-pressure plasma is used for surface modification. This obstacle is the main reason for using atmospheric pressure plasmas which can be focused onto the desired surface area, especially when localized treatment is the goal. Atmospheric-pressure plasma jet (APPJ) enables, for example, polymer activation over an area of the order of the cross-section of the visible plasma jet [3][4][5]. The APPJ is also very popular for medical applications such as wound treatment [6][7], cancer treatment [8][9], bacterial inactivation [10][11], and even for the deposition of thin films [12][13] and coatings [14][15]. In the latter case, the localized surface treatment may not be an advantage any more, especially if larger substrates need to be coated. This can be overcome by scanning the surface of the substrate material [16]. A review of recent applications of the APPJ was published by Penkov et al. [17].
Atmospheric-pressure plasmas are sustained either by a rather low-frequency alternative current (AC) discharges, or radiofrequency (RF), or even microwave (MW) discharges. Depending on the frequency of the power supply, the plasma may be continuous or in short pulses. When the frequency of the power supply is large enough so that the period is shorter than the typical life-time of gaseous plasma, the plasma is sustained in the continuous mode. The continuous mode often occurs at frequencies larger than MHz. Low-frequency discharges will typically create individual streamers of electrons, which will, in turn, cause the formation of a rather dense plasma with the life-time much shorter than the period of the voltage supply.
Numerous methods for atmospheric pressure plasma characterization have been invented [18][19][20][21]. Most are based on optical emission or absorption. As long as the discharge is in the continuous mode, methods will give the correct values of plasma parameters. In the case of pulsed plasmas, only a few methods will enable measuring plasma parameters in real-time. Most methods will just give values averaged over the acquisition time. Some methods have a high spatial resolution, while many others will average the signal over the probed volume. Most of the methods also require a deep understanding of the physical phenomena, so the interpretation of the measured signal is far from being trivial. This is a reason why they are not routinely used by researchers who work on the modification of materials’ surface properties by plasmas but are not specialists in plasma physics.
Because users of plasma techniques are often not familiar with physical processes in non-equilibrium gaseous plasmas, they are seeking an appropriate method that will give basic information about the properties of plasmas. Especially characterization of the APPJ plasmas [22][23] is of particular interest because they are simple to construct and do not require expensive, complicated instruments. APPJ plasmas may be of different configurations, but the simplest one is single-electrode APPJ. A review of APPJ devices can be found in [22][23]. Plasmas at atmospheric pressure are much more demanding for characterization than low-pressure plasmas because of the simple fact that large spatial or temporal gradients are typically present. Any improper interpretation of the measured signal will lead to a misunderstanding of the phenomena taking place on the surface of a sample during plasma treatment. To this end, the users are looking for a simple, cheap, and reliable technique for the characterization of atmospheric-pressure plasmas. One such technique is optical emission spectroscopy (OES), which can give information on the presence of various species in the discharge.
Let us briefly present this technique. Because plasma emits a light, the basic principle of OES is to collect and detect the emitted light photons. The gaseous atoms and molecules in plasma are excited to various levels upon plasma conditions. The excitation is often a consequence of an inelastic collision of a free electron with a molecule or atom. The electron energy has to be above the threshold. Many excited states are at the potential energy of approximately 10 eV, so much higher than the electron temperature. Therefore, only the electrons within the high-energy tail of the energy distribution function will be capable of exciting the radiative states. An alternative is a step-wise excitation: An electron first excites an atom or a molecule to a metastable state, and another electron causes excitation to the radiative level. Such two-step processes are effective as long as the excited metastable is not relaxed by any method (quenched). An alternative is a collision of at least one atom or molecule in a metastable state of high potential energy with another particle. The resultant molecule is of a short life-time and relaxes by radiation (excimer, exciplex molecules). A three-body collision is often required in the latter case. Such collisions are likely to occur at atmospheric pressure because the three-body collision frequency is roughly 1 MHz at 1 bar.
Whatever mechanism, the shelf-time of the radiative state is very short—of the order of nanoseconds. The extremely short shelf-time assures for relaxation of such states by radiation rather than any other method (such as quenching). Different atoms and molecules will radiate in a specific range of wavelengths that correspond to the potential energy difference between the upper and lower excited states. The lower state may or may not be the ground state. The relaxation of excited atoms is usually exhibited in separated lines. High-resolution spectrometers will also reveal the fine structure.
The two-atom molecules will radiate in bands. For a given electronic transition, there will be numerous vibrational transitions, and for a given vibrational, there will be rotational transitions. In some cases, the lower electronic state of a two-atom molecule is not stable but dissociates. In such cases, the molecule will relax by continuum radiation. More complex molecules will normally relax by radiating a continuum.
In any case, the wavelengths indicate the upper and lower excited levels; therefore, the spectral features can be attributed to specific atoms or molecules. The radiation intensity depends on numerous factors, so optical emission spectroscopy is a qualitative technique. It may be semi-quantitative if a known concentration of another atom or molecule is added intentionally. The technique is often called actinometry or titration. Great care should be taken when interpreting the results of actinometry or titration [24].
Inexpensive spectrometers will cover a range of wavelengths between approximately 200 and 1200 nm, i.e., in the visible, near-infrared, and ultraviolet ranges. The spectral response is far from being constant, so calibration with a standard source is recommended at any attempt to use OES for plasma characterization. The standard spectrometers will therefore detect radiation arising in a range of photon energies between the upper and lower energy levels (1 and 6 eV). Most atomic transitions such as Ar, He, O, N, H, to the ground state are below 200 nm. These transitions are, therefore, invisible by standard spectrometers. The transitions to the ground state are normally much more extensive than to other states, so one misses most radiation when using standard spectrometers. This limitation should be taken into account at any attempt to interpret the plasma spectra acquired by OES. The VUV spectrometers (wavelength 100–200 nm) are increasingly popular in plasma science, but one should keep in mind that the radiation of photon energy above the dissociation energy of oxygen molecules (5.2 eV) is absorbed in air, what complicates the experimental setup. Still, knowing the above limitations, one can find OES a useful, simple, and inexpensive technique, so it is widely used for the basic characterization of atmospheric plasmas.
OES can also enable the determination of the gas temperature, electron density, and electron excitation temperature; however, this already requires more in-depth knowledge. The methods for deduction of these plasma properties are not trivial and are beyond the scope of this paper. Gas temperature is assumed to be similar to rotational temperature (Tg ≈ Trot). Gas temperature Tg is thus determined from the calculation of rotational temperature Trot of diatomic molecules considering Boltzmann distribution of rotational states [13][25][26]. For the APPJ plasmas, OH(A) and N2(C) excited states are usually used for the determination of the rotational states. However, the obtained Trot may differ if calculated from OH or N2, and it often leads to an overestimation of Tg [13].
The spatial resolution depends on the lenses mounted at the end of the optical fiber. Normally, the radiation is collected from a solid angle of few degrees. The acquisition time depends on the radiation intensity. Widely used inexpensive spectrometers will have an adjustable acquisition period between approximately 1 ms and several s. Obviously, simple spectrometers will be particularly useful for characterization of plasma in a continuous mode. When the plasma is in the form of streamers of shelf-time well below a ms, the OES will give values averaged over numerous streamers.
2. OES Characterization of the Reactive Species along the APPJ Plasma Jet
APPJs have nowadays become very important in many applications, especially for localized treatment of polymers and for various biomedical applications. Therefore, the knowledge on the generation of excited species and the control of their intensities during the treatment of materials with the APPJ is important. OES is a method that enables the real-time monitoring of the reactive plasma species during the operation of the APPJ.
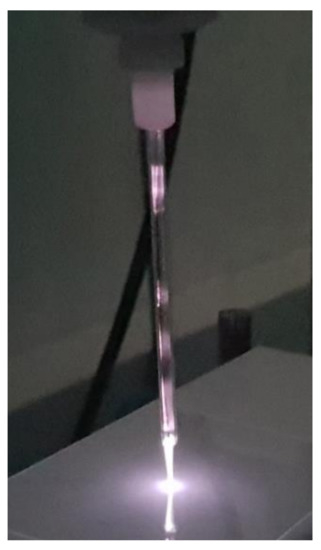
Here we report an example of the OES measurement along the plasma jet of one of the most commonly used and simple configurations of the APPJ (Figure 1). It is a single electrode APPJ having only one electrode. Alternatively, an additional electrode can be placed outside the dielectric tube, but in many practical cases, this is not necessary. A glowing plasma is stretching from the tip of the metallic electrode (a copper wire) mounted coaxially into the dielectric tube (made of Pyrex glass). The luminosity of gaseous plasma is the largest at the electrode tip and decreases with increasing distance. More details of this APPJ can be found in [3]. The discharge tube was made from Pyrex. The length of the discharge tube was 15 cm, and the inner diameters was 3 mm. A copper wire electrode was mounted inside the tube. A diameter of the copper electrode was 0.3 mm and the length of the electrode was the same as the length of the dielectric tube, i.e., 15 cm. The length of luminous plasma depends on the type of gas flown through the dielectric tube, the gas flow, and the properties of the power supply. In our case, a visible part of the plasma jet extended up to 3 cm from the exit of the discharge tube. The plasma jet shown in Figure 1 was fed with Ar gas with a purity of 5.0. The flow rate was adjusted to 1 slm. The powered copper electrode that was mounted inside the Pyrex dielectric tube was connected to an AC power supply. The voltage of the power supply used in this study was 7 kV (peak-to-peak), whereas the excitation (sinusoidal) frequency was 25 kHz. The power was estimated to a few Watts. The electrical field is the highest at the tip of the electrode. The high enough electric field causes the formation of electron streamers. Therefore, our plasma was in the form of streamers rather than continuous plasma. The electron streamers may also appear along the electrode, but they are much weaker because of the lower electric field. The configuration of streamers, as shown in Figure 2, is typical for the case when the plasma device is in ambient air. If the device is placed in a container filled with a noble gas, the intense streamers will not be observed only along the axis but will also propagate radially.
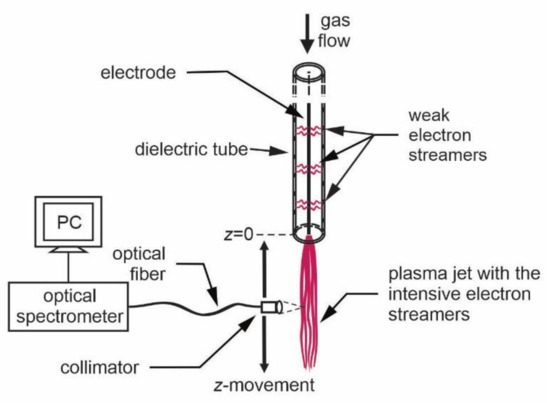
OES was applied for basic plasma characterization of the glowing plasma as shown in Figure 2. The radiation was acquired through an optical fiber, which was mounted on a movable holder. An appropriate lens was placed on the tip of the optical fiber to enable space-resolved measurements. The spectrum acquisition time depends on the luminosity of the plasma jet and the properties of the spectrometer, but the typical value was 10 ms. The time resolution of the simple spectrometer was therefore good enough to perform a gradual characterization with a reasonable vertical resolution by moving the optical fiber vertically along the jet, as shown in Figure 2.
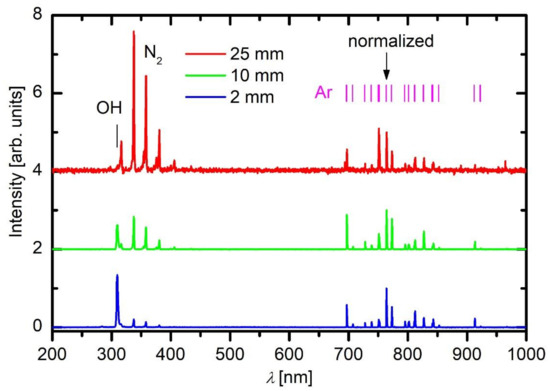
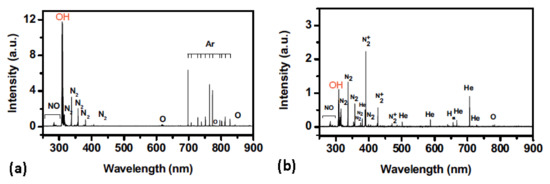
A typical OES spectrum of Ar plasma acquired close to the electrode tip of the APPJ device (i.e., 2 mm from the exit) is shown in Figure 3 (lower curve). Moreover, the OES spectra acquired 10 and 25 mm from the electrode tip are shown in Figure 3 as well. Figure 3 reveals transitions of neutral Ar atoms that correspond to the relaxation of highly excited states to the metastable state. The transitions are in the red part of the spectrum. There are also transitions to the ground state, but they appear in the far UV range, which cannot be probed with the simple optical spectrometer. Interesting enough, Ar lines are not the only spectral features in plasma 2 mm from the exit of the dielectric tube. The most intensive feature appears at the bandhead of approximately 309 nm, and it corresponds to the transition of the OH radicals from the electronically excited to the ground state. Furthermore, there is a band of lines in the near UV range that corresponds to the transition of highly excited neutral nitrogen molecules in C3Πu state to N2 molecules in B3Πg state. This transition is called 2nd positive system. Details on the most common transitions of various atoms and molecules likely to occur in the APPJ are very well presented in the paper of Golda et al. [27]. Spectral features as observed in Figure 3 in the spectrum acquired close to the APPJ exit also persist in the spectra recorded at longer distances from the exit of the discharge tube; however, their intensity is significantly lower, and also their ratio strongly depends on the distance from the dielectric tube. The axial distribution of the major spectral features versus the distance is shown in Figure 4.
Park et al. [28] used a device similar to what is shown in Figure 1 but powered it with a DC pulsed discharge. In such discharges, the streamers, as shown in Figure 2, shrink to bullets of a spatially confined dense plasma, which propagate away from the powered electrode at a velocity of the order of 104 m s−1. The visible appearance of gaseous plasma is not much different from the one shown in Figure 1, but the electrical properties are completely different. Despite the difference, the optical spectra acquired by Park et al. are similar to those in Figure 3. In the optical spectra acquired by Park et al., the OH line at 309 nm was dominant, and the N2 band in the near UV range was clearly visible, too (Figure 5). They also provided images of the discharges taken with the fast camera to show the evolution of the plasma bullets. The optical spectra taken in such cases obviously give values averaged over numerous such localized plasma bullets.
Additionally, also Sarani et al. [29] and Seo et al. [30] observed similar spectra as shown in Figure 3 for the dielectric-barrier discharge (DBD) type APPJ feed with pure Ar as well as Weltman et al. [31]. Sarani et al. [29] used the APPJ very similar to the device shown in Figure 1. Intensive OH radiation was observed even in pure Ar, and suppressed by the intentional addition of other gases. They provided possible channels for the formation of hydroxyl radicals. The OH radical can be generated by a collision of the water molecule and an electron (electron-impact dissociation), or a metastable Ar atom, or by the reaction of an excited oxygen atom with a water molecule, which was found the dominant mechanism by Sarani et al. Their arguments were based on the papers of Herron et al. [32] and Kim et al. [33]. In addition, Roy et al. [34] used OES to investigate the production of OH and O radicals in air/Ar/H2O plasma and found that Ar plays a significant role in their production. The production of OH and O radicals was increasing with increasing Ar content.
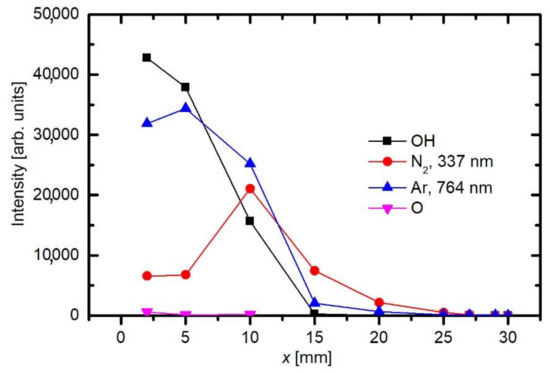
As already explained before, the appearance of OH and N2 spectral features in Figure 3 is not because of the inadequate purity of Ar gas, but rather because of the interaction of gaseous plasma with the neighboring atmosphere. As shown schematically in Figure 2, the electron streamers are formed stochastically in the APPJ, which is powered with an AC discharge at a typical frequency of 10 kHz. The streamers propagate along the axis of the Ar jet. They will not propagate in air because of the numerous channels for the loss of electrons’ kinetic energy. Still, some streamers reach the edge of the Ar gas jet, where diffusion of air from the surrounding atmosphere occurs. Furthermore, the streamers inside the Ar jet cause formation of Ar metastables with a large radiation life-time. The metastables are therefore quenched rather than relaxed by the radiation. The quenching is unlikely to occur in pure Ar, but very probable at a collision between an Ar metastable and a gaseous molecule. The Ar metastables diffuse within the jet and may finally reach the edge of the pure Ar jet, where they transfer their potential energy to air molecules. The optical spectrometer will collect any radiation arising from a certain solid angle, as determined by the lenses (Figure 2). That is why the nitrogen emission lines appear in the spectrum collected close to the electrode (Figure 3). The relative intensity of nitrogen emission depends on the kinetics of gas mixing and on the plasma excitation of gaseous species. Figure 5 shows a maximum in the nitrogen emission along the axis. A maximum is usually a consequence of two opposite effects. In this particular case, the diffusion of nitrogen inside the plasma jet increases with increasing distance from the electrode. From this point of view, the N2 emission should increase with increasing distance from the electrode. On the other hand, the absolute luminosity of gaseous plasma decreases with increasing distance. The combination of these two opposite effects causes the maximum in nitrogen radiation, as revealed in Figure 5. Figure 6 shows the intensities of nitrogen and OH radicals radiation normalized to the main Ar line at 764 nm. Now we observe that the relative intensity of nitrogen radiation keeps increasing with increasing distance and remains large even at the distance of 25 mm where the absolute intensity is poor. The effect is explained by the mixing of the gases. A maximum in N2 emission versus a distance was also observed by Chauvet et al. [35]; however, they observed a maximum at a somehow shorter distance at approximately 5 mm.
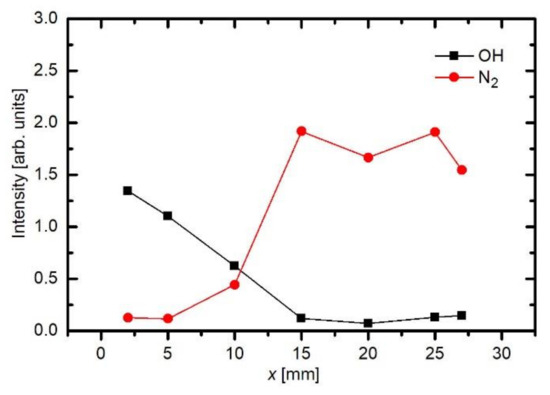
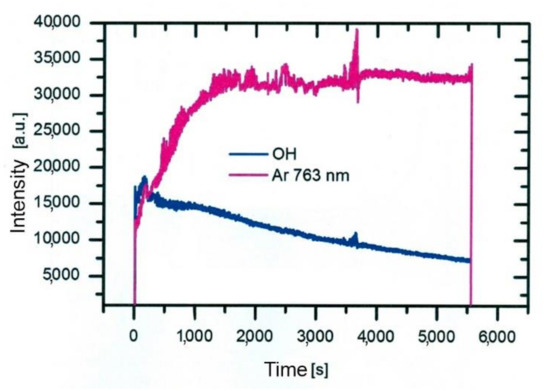
Such a maximum as observed for nitrogen species in Figure 5 is not observed for OH radiation. For OH radicals, we observe intensive radiation in the first few mm from the exit of the discharge tube and then rather fast decay. Water vapor abounds in air in any laboratory. The saturated water vapor pressure at room temperature (25 °C) is about 3.2 kPa. This value corresponds to 100% humidity. The air humidity in the lab is never that high, but it is rarely below 10%, so the partial pressure of water vapor is still several tenths of kPa. The water vapor from ambient air cannot explain the completely different behavior of the OH as compared to N2. A more feasible explanation is the presence of water vapor within the dielectric tube. Unlike nitrogen, which is quickly removed from the dielectric tube by passing Ar at a rather large flow rate, water molecules stick to surfaces of solid materials, where they form a layer that is only slowly desorbed at room temperature. The consequence of this water film is the appearance of strong OH radiation even at the electrode tip. The OH radiation depends on the amount of water released from the surfaces, which in turn depends on the amount of water absorbed. Upon continuous flushing of the dielectric tube with Ar, the water concentration decreases with time but remains significant for hours. Figure 7 represents the evolution of Ar and OH lines for one and a half hours [36]. As the discharge is turned on, the OH signal is larger than the Ar line. Within the first minutes, the Ar line increases, and the OH remains fairly intact. After prolonged treatment, the Ar line finally reaches a constant value, but OH keeps decreasing. This important fact should be taken into account at any attempt to explain the plasma-surface interaction upon activation of a polymer product by the APPJ sustained in a noble gas. We should be aware that any APPJ sustained in pure Ar at ambient conditions is therefore rich in OH radicals.
Similar results were observed by other authors too. Seo et al. [30] used Ar of purity 99.999% for sustaining the APPJ at the frequency of 50 kHz and reported optical spectra similar to those in Figure 3. They employed a somehow more sophisticated discharge configuration with an additional grounded ring mounted on the other side of the dielectric tube but observed practically identical behavior of the OH signal as in Figure 5 and Figure 6 when using Ar feed gas. In contrary, the peak of the nitrogen radiation was not so obvious as in Figure 5, but the relative intensity was almost identical to the behavior, as shown in Figure 6. Here we should also mention, that Seo et al. found a dominant OH emission only in the case of Ar plasma, whereas in the case of He plasma, OH emission was only minor. Because of a very high OH radical concentration in Ar plasma, they obtained a much better improvement of surface hydrophilicity of polydimethylsiloxane when treated with Ar gas than with He.
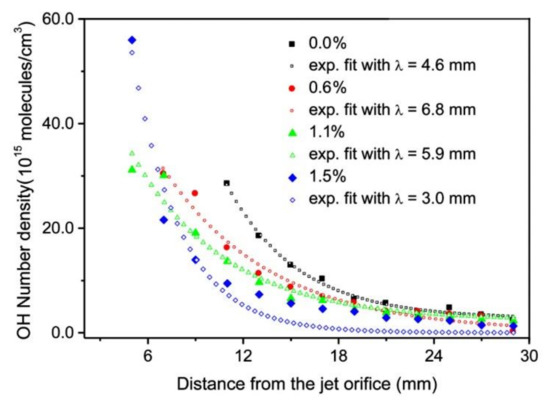
Figure 5 and Figure 6 are also in agreement with the reports by Srivastava et al., who found that the decay length of OH radicals was much shorter than the length of the visible plasma jet [37]. As shown in Figure 5, the intensity of OH radiation remains roughly constant for the first few mm and then decreases rapidly. In Figure 5 and Figure 6, the OH signal becomes marginal for lengths more than approximately 15 mm, although the radiation from nitrogen bands persists much longer. One can assume that the OH radicals are lost along the jet, but it should be stressed that optical emission spectroscopy is a qualitative technique, and it does not reveal the concentration of radicals in the ground state. A comparison with similar configurations, where absolute techniques were used, is recommended. Srivastava et al. [37] performed a complete characterization of the APPJ sustained in pure Ar with a small admixture of water vapor. They measured the absolute density of OH radicals by a reliable technique (cavity ring-down spectroscopy) and found the OH density as large as 3 × 10²² m−3 for high purity Ar. The OH density increased up to approximately 5 × 10²² m−3 for the admixture of approximately 1 vol.% of water. Therefore, an important conclusion is that a common APPJ, as shown in Figure 1, always contains a large number of OH radicals, which typically arise from the desorption of water molecules from the dielectric tube or even connecting tubes. Srivastava et al. also employed optical absorption spectroscopy to measure the variation of the OH density along the axis of the APPJ and found a rather exponential decay with a characteristic length of a few mm, as shown in Figure 8 [37]. The decay length depended on the concentration of water vapor in Ar. The decay was the fastest at the maximal concentration of OH radicals, i.e., at the water admixture of approximately 1%. Srivastava et al. also provided explanations for the loss of OH radicals, which included recombination reactions, three-body collision quenching, and reactions of OH with H, O, or even NH radicals. They found the most extensive loss by the reaction H + OH → H2O with a coefficient of approximately 2 × 10⁻¹⁶ m3 s−1 [37].
The results reported above clearly show that a relative gas humidity of the atmosphere may significantly alter the density of reactive species what may lead to unrepeatable results of the APPJ treatment. APPJs are usually feed by a noble gas (Ar or He), because in this case, the gaseous plasma expands rather far from the powered electrode, whereas in the case of molecular gases, the plasma plume is much shorter. Any APPJ sustained in pure noble gas at ambient conditions is thus rich in OH radicals. In fact, there is hardly any report in the literature on OES characterization of the APPJ without a significant signal arising from OH radicals. Some authors used high purity Ar and carefully pre-treated the APPJ devices, but none reported the OH-free optical spectrum [37][29][38][28][39][40][31]. Many authors also intentionally added a small admixture of water vapor to the feed gas to investigate the kinetics of the OH formation and its concentration profile [37][29][38][39][41].
Water vapor was added to the APPJ intentionally by Ilik et al. [41]. They used He as a carrier gas. The flow rate was as large as 20 slm. They managed to spray water droplets into the APPJ and studied the evolution of optical spectra. The discharge was powered with a sinusoidal AC supply operating at 18 kV and 15 kHz. The spectra were averaged over a rather long jet, but were similar to the one presented in Figure 3 except that a weak He line was observed instead of Ar lines. The authors demonstrated that the addition of water droplets did not influence the spectra much. In particular, the relative intensity of nitrogen prevailed at all experimental conditions. The water spraying only caused suppression of all spectral features, thus indicating the negative effect on the electron density or temperature.
The influence of water vapor on the electrical and spectral properties of the APPJ was further investigated by Nikiforov et al. [38]. They used a device similar to that presented in Figure 1, except that the electrode was deep inside the dielectric tube, and a grounded electrode was also applied. They provided precious information about the electrical behavior of an AC discharge because they measured both the voltage and current, as well as the Lissajous curves, which give information on the exact power of the discharge. The intensive electron streamers, as shown schematically in Figure 2, are clearly presented in the paper by Nikiforov et al. The measurements allowed for estimation of the real discharge power absorbed by gaseous plasma versus the adjustable voltage of the AC power supply, which operated at the frequency of 70 kHz. At a given voltage, the maximum power was absorbed by plasma at the lowest concentration of the water vapor. The maximum emission arising from OH radicals was found at a water vapor concentration of 350 ppm. Although the content of H2O was varied in a broad range up to several 1000 ppm, the maximum effect of polymer sample surface modification was observed at the water admixture in the range between 200 and 500 ppm. Based on this observation, Nikiforov et al. concluded that the yield of OH radicals was the highest at such a low water admixture.
Weltmann et al. elaborated the evolution of optical spectra along the APPJ operating in the semi-continuous mode [31]. They used an RF supply operating at a frequency of 1.1 MHz. They observed gradual decay of the OH and N2 spectral features with the distance from the powered electrode. The OH radiation reached the peak value 2 mm away from the electrode, while nitrogen about 10 mm. The observations are, therefore, similar to those presented in Figure 3, Figure 5 and Figure 6. They also managed to measure the axial and radial temperature profiles using a glass fiber temperature probe. As expected, the highest gas temperature was observed where the luminosity was the highest, but the plasma tip temperature at the axis was about 48 °C. Rather strong radial gradients were observed, and the gas remained at room temperature a few mm from the visible plasma jet. These results indicate that the rotational temperatures, as reported by the above-cited authors, may not be representative for the estimation of the neutral gas kinetic temperature.
Production of OH radicals in the bullet-like APPJ was recently elaborated also by Gott and Xu [42]. The APPJ was sustained in He gas of purity 99.9999% with a pulsed discharge powered with a 10 kV supply. The voltage rise-time of 60 ns only assured for almost perfectly-shaped bullets propagating from a tungsten electrode which was placed into a quartz glass tube, similar to Figure 1. The emission from OH radicals was much larger inside than outside the tube, confirming that the water vapor originated from the walls inside the discharge tube. The authors explained the extensive radiation from OH radicals by electron-impact dissociation and subsequent excitation rather than the influence of He metastables.
The formation of the bullet-like discharge was further elaborated by Cordaro et al. [43]. They performed a detailed characterization of a plasma jet useful for blood coagulation. Plasma was sustained in He or Ne using a low-frequency discharge, which provided current pulses of a duration of approximately 1 µs. No additional gas was added intentionally, but the OES spectra revealed nitrogen bands even within the dielectric tube despite the rather large gas flow of 2 slm. At a distance of 5 mm from the exhaust, the spectral features corresponding to N2 and O transitions prevailed over the radiation from He atoms. Unfortunately, the spectrometer used by Cordaro et al. [43] did not allow for measuring the OH line at 309 nm to compare the intensities like in Figure 3. In another paper, the same group reported the thermal effects caused by the treatment of biological matter with such an APPJ [44]. They found experiments with biological materials unfeasible because of the unknown thermal properties, so they used metallic samples and found significant differences for grounded or floating objects. The heating rate depended on the distance from the electrode, indicating the loss of the discharge power along the APPJ.
Chauvet et al. [35] performed an investigation of the spatial distribution of excited and ionized species along the bullet-like APPJ sustained in He at different flow rates. The emission of H, O, and OH strongly decreased with the distance from the APPJ exit, whereas N2+ and N2 * reached a maximum at few mm from the tube exit.
Gerling et al. [45] investigated the production of reactive oxygen species (ROS) such as OH and O and reactive nitrogen species (RN) such as N2 and N2+ in He plasma with various oxygen admixtures up to 0.33%. They found a strong dependence of ROS and RN species versus O2 admixture. The different behavior of the emission intensity of ROS and RN radicals versus O2 concentration was observed. In the case of RN radicals, N2+ emission exhibited a maximum at 0.05%, whereas N2 at 0.1% of O2 addition. For ROS radicals, the emission intensity of O was first increasing with the O2 addition and reached a saturation when 0.15% of O2 was added to He. For OH radicals, the opposite behavior was observed. After the initial saturation, it decreased if the addition of O2 was more than 0.1%. Similar work was also performed by Pipa et al. [46]. The authors investigated the production of NO versus air admixture in Ar plasma and found a maximum in the NO emission intensity at 0.1–0.2% of the air in Ar.
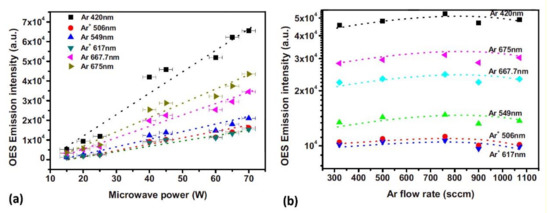
Jia et al. [47] used OES to investigate the influence of microwave power and gas flow on the emission intensity of specific species (Figure 9). The authors used the APPJ created in Ar, He, or Ar + He mixture. The intensity of the emission was monotonously increasing with power. The increase was explained by the increase in the electron density and electron temperature. The variation of the emission intensity with the flow was less dramatic. After a slight initial increase, it slightly decreased at higher flow rates.
A simple optical spectrometer usually operates in the spectral range between approximately 200 and 1000 nm. The optical transitions in this range occur from the excited to the ground level only for the case of OH radicals and any metallic impurities, but most other transitions arise from the relaxation from one (higher) to another (lower) excited state. For example, atomic Ar lines shown in Figure 3 appear at transitions to the level at the excitation energy as high as about 12 eV. Apart from these transitions, there are also transitions that appear to the ground state. These transitions are in the far UV range of the spectrum, below the detection limit of a simple spectrometer, which is usually approximately 200 nm [27]. Such short wavelength radiation is quickly absorbed in the air, as well as in the optical fiber and even lenses, so special types of spectrometers should be used to detect transitions of many gaseous species to the ground state. Among such transitions, there is H-atom Lyman series with the predominant line at 121 nm (transition from the first excited state to the ground state), O-atom transitions with the predominant line at 130 nm, Ar-atom transitions with the most intensive line at 107 nm, and N-atom transition at 149 nm. These transitions may be dominant in the spectra of atmospheric-pressure plasma jets.
Schulz-von der Gathen et al. [48] measured OES of He discharge with various oxygen admixtures in UV and VUV regions. For low or zero oxygen admixture, NO and OH emissions were very strong. In addition, the atomic oxygen line was dominant at low oxygen admixture (0.06%).
An excellent comparison of radiation intensity in the far and near UV range was provided by Golda et al. [27]. They measured the spectra of the APPJ sustained by a sinusoidal RF voltage at the frequency of 13.56 MHz. The VUV spectrometer was mounted onto a special aerodynamic window and placed in a high-vacuum chamber. For He discharge, they found the intensity of OH at about 282 nm marginal as compared to radiation in the range between 60 and 100 nm. A similar result was also observed for Ar, except for this case, the major far UV radiation occurred between 110 and 130 nm. The OH peak at 282 nm is a consequence of the radiative transition from the first vibrational excited state of the OH (A) electronic state to the ground state. This transition is normally 10-times less intense than the major transition at 309 nm, but the latter could not be probed by the spectrometer used by Golda. In any case, the major radiation from the pure argon APPJ aroused from Ar2 continuum. Even small impurities of water vapor in the monochromator caused decreasing of this radiation to half of the original value. The absorption cross-section for H2O molecules was also provided by Golda et al. and may be as high as 10−17 cm2. For He plasma, the intensive radiation within 60 and 100 nm was suppressed even by a very small addition of a reactive gas. For example, the addition of 0.01% O2 caused suppression of the He radiation by a factor of two. Unfortunately, no data for water vapor were provided by Golda et al. Based on the discussion above, it is possible to conclude that a simple plasma jet operating in the configuration of Figure 1, may be a source of radiation in the far UV range, but this cannot be probed with the simple spectrometer. The experimental configuration with a VUV spectrometer, as adopted by Golda et al., is highly recommended, but difficult to realize.
According to this literature review and our results, we can conclude that OH radicals are the most important reactive species in the APPJ. As OES is a qualitative technique, it enables investigation of the relative variation of the density of plasma species along the axis. However, for quantitative determination of the densities, other techniques must be applied. The OH density profile along the plasma jet is usually measured by laser-induced fluorescence (LIF) [49][50][51][52] or two-photon absorption LIF (TALIF) [53][54][55]. Other methods, such as cavity ringdown spectroscopy (CRDS) [37][56][57][58] and absorption spectroscopy [53][59] can be used as well. Schröter et al. measured the concentration of the OH radicals in the humidified He discharge sustained in an RF driven APPJ by using vacuum ultra-violet high-resolution Fourier-transform absorption spectroscopy and ultra-violet broad-band absorption spectroscopy [53]. They found an extensive dissociation of H2O molecules upon plasma conditions. The density of OH radicals was approximately 3 × 10²⁰ m−3. Such a large density expanded several cm along the discharge channel. An order of magnitude lower OH density was observed by Fuh et al. [58] in a pulsed He discharge with CRDS method. Whereas Yonemori et al. [52] obtained even lower densities of approximately 1 × 10¹⁸ m−3 with LIF. In another paper, Yonemori et al. [51] measured the OH density in the humidified He pulsed discharge. The H2O content in He gas was varied between 0 and 800 ppm. A maximum in the OH density peaking at 6 × 10¹⁸ m−3 was found at the H2O content of 200 ppm. Additionally, Srivastava et al. measured the variation of the OH density along the axis of the APPJ [37][56] by using CRDS method. Srivastava et al. [56] measured the OH density in Ar, Ar/N2, and Ar/O2 APPJ discharge at various powers and flow rates. The OH density was decreasing along the jet. The OH density also strongly depended on the power and it was increasing with the increasing power. For Ar plasma, the OH density ranged from 1.3 × 10¹⁸ to 1.1 × 10²² m−3, depending on particular conditions. For Ar/N2 it was in the range between 4.1 × 10¹⁹ to 3.9 × 10²¹ m−3, whereas for Ar/O2 it was between 7.0 × 10¹⁸ to 4.6 × 10²² m−3 [56].
References
- Vesel, A.; Mozetic, M. New developments in surface functionalization of polymers using controlled plasma treatments. J. Phys. D Appl. Phys. 2017, 50, 293001.
- Reuter, S.; von Woedtke, T.; Weltmann, K.-D. The kINPen—A review on physics and chemistry of the atmospheric pressure plasma jet and its applications. J. Phys. D Appl. Phys. 2018, 51, 233001.
- Vesel, A.; Zaplotnik, R.; Primc, G.; Mozetič, M. Evolution of the surface wettability of PET polymer upon treatment with an atmospheric-pressure plasma jet. Polymers 2020, 12, 87.
- Zaplotnik, R.; Vesel, A. Effect of VUV radiation on surface modification of polystyrene exposed to atmospheric pressure plasma jet. Polymers 2020, 12, 1136.
- Nishime, T.M.C.; Wagner, R.; Kostov, G.K. Study of modified area of polymer samples exposed to a He atmospheric pressure plasma jet using different treatment conditions. Polymers 2020, 12, 1028.
- Darmawati, S.; Rohmani, A.; Nurani, L.H.; Prastiyanto, M.E.; Dewi, S.S.; Salsabila, N.; Wahyuningtyas, E.S.; Murdiya, F.; Sikumbang, I.M.; Rohmah, R.N.; et al. When plasma jet is effective for chronic wound bacteria inactivation, is it also effective for wound healing? Clin. Plasma Med. 2019, 14, 100085.
- Xu, G.M.; Shi, X.M.; Cai, J.F.; Chen, S.L.; Li, P.; Yao, C.W.; Chang, Z.S.; Zhang, G.J. Dual effects of atmospheric pressure plasma jet on skin wound healing of mice. Wound Repair Regen. 2015, 23, 878–884.
- Keidar, M. Plasma for cancer treatment. Plasma Sources Sci. Technol. 2015, 24, 033001.
- Xu, G.; Liu, J.; Yao, C.; Chen, S.; Lin, F.; Li, P.; Shi, X.; Zhang, G.J. Effects of atmospheric pressure plasma jet with floating electrode on murine melanoma and fibroblast cells. Phys. Plasmas 2017, 24, 083504.
- Sarani, A.; Nicula, C.; Gonzales, X.F.; Thiyagarajan, M. Characterization of kilohertz-ignited nonthermal He and He/O2 plasma pencil for biomedical applications. IEEE Trans. Plasma Sci. 2014, 42, 3148–3160.
- Schneider, S.; Lackmann, J.-W.; Ellerweg, D.; Denis, B.; Narberhaus, F.; Bandow, J.E.; Benedikt, J. The role of VUV radiation in the inactivation of bacteria with an atmospheric pressure plasma jet. Plasma Process. Polym. 2012, 9, 561–568.
- Reyes, P.G.; Gomez, A.; Martinez, H.; Flores, O.; Torres, C.; Vergara, J. Characterization of ethanol plasma glow discharge, decomposition in several species and solid film formation. IEEE Trans. Plasma Sci. 2016, 44, 2995–3000.
- Barletta, F.; Leys, C.; Colombo, V.; Gherardi, M.; Britun, N.; Snyders, R.; Nikiforov, A. Insights into plasma-assisted polymerization at atmospheric pressure by spectroscopic diagnostics. Plasma Process. Polym. 2020, 17, 1900174.
- Penkov, O.V.; Lee, D.-H.; Kim, H.; Kim, D.-E. Frictional behavior of atmospheric plasma jet deposited carbon–ZnO composite coatings. Compos. Sci. Technol. 2013, 77, 60–66.
- Penkov, O.V.; Lee, D.H.; Kim, D.E. Wear resistant coatings for polymeric substrates deposited by atmospheric pressure plasma jet. Sci. Adv. Mater. 2015, 7, 113–119.
- Chang, K.-M.; Huang, S.-H.; Wu, C.-J.; Lin, W.-L.; Chen, W.-C.; Chi, C.-W.; Lin, J.-W.; Chang, C.-C. Transparent conductive indium-doped zinc oxide films prepared by atmospheric pressure plasma jet. Thin Solid Films 2011, 519, 5114–5117.
- Penkov, O.V.; Khadem, M.; Lim, W.-S.; Kim, D.-E. A review of recent applications of atmospheric pressure plasma jets for materials processing. J. Coat. Technol. Res. 2015, 12, 225–235.
- Reuter, S.; Sousa, J.S.; Stancu, G.D.; Hubertus van Helden, J.-P. Review on VUV to MIR absorption spectroscopy of atmospheric pressure plasma jets. Plasma Sources Sci. Technol. 2015, 24, 054001.
- Zaplotnik, R.; Bišćan, M.; Krstulović, N.; Popović, D.; Milošević, S. Cavity ring-down spectroscopy for atmospheric pressure plasma jet analysis. Plasma Sources Sci. Technol. 2015, 24, 054004.
- Mozetič, M.; Ricard, A.; Babič, D.; Poberaj, I.; Levaton, J.; Monna, V.; Cvelbar, U. Comparison of NO titration and fiber optics catalytic probes for determination of neutral oxygen atom concentration in plasmas and postglows. J. Vac. Sci. Technol. A 2003, 21, 369–374.
- Lu, X.P.; Wu, S.Q. On the active species concentrations of atmospheric pressure nonequilibrium plasma jets. IEEE Trans. Plasma Sci. 2013, 41, 2313–2326.
- Winter, J.; Brandenburg, R.; Weltmann, K.D. Atmospheric pressure plasma jets: An overview of devices and new directions. Plasma Sources Sci. Technol. 2015, 24, 064001.
- Lu, X.; Laroussi, M.; Puech, V. On atmospheric-pressure non-equilibrium plasma jets and plasma bullets. Plasma Sources Sci. Technol. 2012, 21, 034005.
- Niemi, K.; Reuter, S.; Graham, L.M.; Waskoenig, J.; Gans, T. Diagnostic based modeling for determining absolute atomic oxygen densities in atmospheric pressure helium-oxygen plasmas. Appl. Phys. Lett. 2009, 95, 151504.
- Zhang, Q.Y.; Shi, D.Q.; Xu, W.; Miao, C.Y.; Ma, C.Y.; Ren, C.S.; Zhang, C.; Yi, Z. Determination of vibrational and rotational temperatures in highly constricted nitrogen plasmas by fitting the second positive system of N2 molecules. AIP Adv. 2015, 5, 057158.
- Zhao, T.-L.; Xu, Y.; Song, Y.-H.; Li, X.-S.; Liu, J.-L.; Liu, J.-B.; Zhu, A.-M. Determination of vibrational and rotational temperatures in a gliding arc discharge by using overlapped molecular emission spectra. J. Phys. D Appl. Phys. 2013, 46, 345201.
- Golda, J.; Biskup, B.; Layes, V.; Winzer, T.; Benedikt, J. Vacuum ultraviolet spectroscopy of cold atmospheric pressure plasma jets. Plasma Process. Polym. 2020, 17.
- Park, H.S.; Kim, S.J.; Joh, H.M.; Chung, T.H.; Bae, S.H.; Leem, S.H. Optical and electrical characterization of an atmospheric pressure microplasma jet with a capillary electrode. Phys. Plasmas 2010, 17, 033502.
- Sarani, A.; De Geyter, N.; Nikiforov, A.Y.; Morent, R.; Leys, C.; Hubert, J.; Reniers, F. Surface modification of PTFE using an atmospheric pressure plasma jet in argon and argon+CO2. Surf. Coat. Technol. 2012, 206, 2226–2232.
- Seo, K.S.; Cha, J.H.; Han, M.K.; Ha, C.S.; Kim, D.H.; Lee, H.J.; Lee, H.J. Surface treatment of glass and poly(dimethylsiloxane) using atmospheric-pressure plasma jet and analysis of discharge characteristics. Jap. J. Appl. Phys. 2015, 54.
- Weltmann, K.-D.; Kindel, E.; Brandenburg, R.; Meyer, C.; Bussiahn, R.; Wilke, C.; von Woedtke, T. Atmospheric pressure plasma jet for medical therapy: Plasma parameters and risk estimation. Contrib. Plasma Phys. 2009, 49, 631–640.
- Herron, J.T.; Green, D.S. Chemical kinetics database and predictive schemes for nonthermal humid air plasma chemistry. Part II. Neutral species reactions. Plasma Chem. Plasma Process. 2001, 21, 459–481.
- Kim, S.J.; Chung, T.H.; Bae, S.H.; Leem, S.H. Characterization of atmospheric pressure microplasma jet source and its application to bacterial inactivation. Plasma Process. Polym. 2009, 6, 676–685.
- Roy, N.C.; Talukder, M.R.; Chowdhury, A.N. OH and O radicals production in atmospheric pressure air/Ar/H2O gliding arc discharge plasma jet. Plasma Sci. Technol. 2017, 19.
- Chauvet, L.; Therese, L.; Caillier, B.; Guillot, P. Characterization of an asymmetric DBD plasma jet source at atmospheric pressure. J. Anal. At. Spectrom. 2014, 29, 2050–2057.
- Resnik, M. Plasma-Induced Modifications of Polypropylene Tubes for Biomedical Applications. Ph.D. Thesis, Jozef Stefan International Postgraduate School, Ljubljana, Slovenija, 2018.
- Srivastava, N.; Wang, C.J. Effects of water addition on OH radical generation and plasma properties in an atmospheric argon microwave plasma jet. J. Appl. Phys. 2011, 110, 053304.
- Nikiforov, A.Y.; Sarani, A.; Leys, C. The influence of water vapor content on electrical and spectral properties of an atmospheric pressure plasma jet. Plasma Sources Sci. Technol. 2011, 20, 015014.
- Sarani, A.; Nikiforov, A.Y.; Leys, C. Atmospheric pressure plasma jet in Ar and Ar/H2O mixtures: Optical emission spectroscopy and temperature measurements. Phys. Plasmas 2010, 17, 063504.
- Yanguas-Gil, A.; Focke, K.; Benedikt, J.; von Keudell, A. Optical and electrical characterization of an atmospheric pressure microplasma jet for Ar/CH4 and Ar/C2H2 mixtures. J. Appl. Phys. 2007, 101, 103307.
- Ilik, E.; Durmus, C.; Akan, T. Adding water droplets into atmospheric pressure plasma jet of helium. IEEE Trans. Plasma Sci. 2019, 47, 5000–5005.
- Gott, R.P.; Xu, K.G. OH production and jet length of an atmospheric-pressure plasma jet for soft and biomaterial treatment. IEEE Trans. Plasma Sci. 2019, 47, 4988–4999.
- Cordaro, L.; De Masi, G.; Fassina, A.; Mancini, D.; Cavazzana, R.; Desideri, D.; Sonato, P.; Zuin, M.; Zaniol, B.; Martines, E. On the electrical and optical features of the plasma coagulation controller low temperature atmospheric plasma jet. Plasma 2019, 2, 12.
- Cordaro, L.; De Masi, G.; Fassina, A.; Gareri, C.; Pimazzoni, A.; Desideri, D.; Indolfi, C.; Martines, E. The role of thermal effects in plasma medical applications: Biological and calorimetric analysis. Appl. Sci. 2019, 9, 5560.
- Gerling, T.; Nastuta, A.V.; Bussiahn, R.; Kindel, E.; Weltmann, K.D. Back and forth directed plasma bullets in a helium atmospheric pressure needle-to-plane discharge with oxygen admixtures. Plasma Sources Sci. Technol. 2012, 21, 034012.
- Pipa, A.V.; Reuter, S.; Foest, R.; Weltmann, K.D. Controlling the NO production of an atmospheric pressure plasma jet. J. Phys. D Appl. Phys. 2012, 45, 085201.
- Jia, H.; Fujiwara, H.; Kondo, M.; Kuraseko, H. Optical emission spectroscopy of atmospheric pressure microwave plasmas. J. Appl. Phys. 2008, 104, 054908.
- Schulz-von der Gathen, V.; Schaper, L.; Knake, N.; Reuter, S.; Niemi, K.; Gans, T.; Winter, J. Spatially resolved diagnostics on a microscale atmospheric pressure plasma jet. J. Phys. D Appl. Phys. 2008, 41, 194004.
- Yang, Y.; Zhang, Y.Z.; Liao, Z.L.; Pei, X.K.; Wu, S.Q. OH radicals distribution and discharge dynamics of an atmospheric pressure plasma jet above water surface. IEEE Trans. Radiat. Plasma Med. Sci. 2018, 2, 223–228.
- Voráč, J.; Dvořák, P.; Procházka, V.; Ehlbeck, J.; Reuter, S. Measurement of hydroxyl radical (OH) concentration in an argon RF plasma jet by laser-induced fluorescence. Plasma Sources Sci. Technol. 2013, 22, 025016.
- Yonemori, S.; Nakagawa, Y.; Ono, R.; Oda, T. Measurement of OH density and air–helium mixture ratio in an atmospheric-pressure helium plasma jet. J. Phys. D Appl. Phys. 2012, 45, 225202.
- Yonemori, S.; Ono, R. Flux of OH and O radicals onto a surface by an atmospheric-pressure helium plasma jet measured by laser-induced fluorescence. J. Phys. D Appl. Phys. 2014, 47, 125401.
- Schröter, S.; Wijaikhum, A.; Gibson, A.R.; West, A.; Davies, H.L.; Minesi, N.; Dedrick, J.; Wagenaars, E.; de Oliveira, N.; Nahon, L.; et al. Chemical kinetics in an atmospheric pressure helium plasma containing humidity. Phys. Chem. Chem. Phys. 2018, 20, 24263–24286.
- Van Gessel, A.F.H.; van Grootel, S.C.; Bruggeman, P.J. Atomic oxygen TALIF measurements in an atmospheric-pressure microwave plasma jet within situxenon calibration. Plasma Sources Sci. Technol. 2013, 22, 055010.
- Reuter, S.; Niemi, K.; Schulz-von der Gathen, V.; Döbele, H.F. Generation of atomic oxygen in the effluent of an atmospheric pressure plasma jet. Plasma Sources Sci. Technol. 2008, 18, 015006.
- Wang, C.; Srivastava, N. OH number densities and plasma jet behavior in atmospheric microwave plasma jets operating with different plasma gases (Ar, Ar/N2, and Ar/O2). Eur. Phys. J. D 2010, 60, 465–477.
- Srivastava, N.; Wang, C.J. Determination of OH radicals in an atmospheric pressure helium microwave plasma jet. IEEE Trans. Plasma Sci. 2011, 39, 918–924.
- Fuh, C.A.; Clark, S.M.; Wu, W.; Wang, C. Electronic ground state OH(X) radical in a low-temperature atmospheric pressure plasma jet. J. Appl. Phys. 2016, 120, 163303.
- Hibert, C.; Gaurand, I.; Motret, O.; Pouvesle, J.M. OH(X) measurements by resonant absorption spectroscopy in a pulsed dielectric barrier discharge. J. Appl. Phys. 1999, 85, 7070–7075.

