 +1 credit
| Version | Summary | Created by | Modification | Content Size | Created at | Operation |
|---|---|---|---|---|---|---|
| 1 | Thyago Celso Cavalcante Nepomuceno | + 478 word(s) | 478 | 2021-03-06 23:45:09 |
Video Upload Options
The first Data Envelopment Analysis (DEA) model developed by Charnes, Cooper and Rhodes (1978) under the assumption of a Constant Returns to Scale production technology, i.e., when an increase in the production resources results in a proportional increase in the output.
The Model Explained [1]
Considering j = 1, 2, 3, . m Decision Making Units (DMUs) using 


In Charnes et al. (1978) [1] DEA methodology the multipliers, and a measure for the technical efficiency for a specific DMU can be estimated by solving the fractional programming problem [2]:

For all j, r and i, and strict positive

Similarly, the model adapted for the definition of input and output slacks:

For all j, r and i. As a result, we have an efficiency score θ which varies from 0 to 1 designating the efficiency for each decision making unit. We can obtain the marginal contribution of each input and output in the multiplier model of (3), the peers of efficiency and respective weights in the primal (or envelopment) form of (4), and also the potential for improvements and slacks.
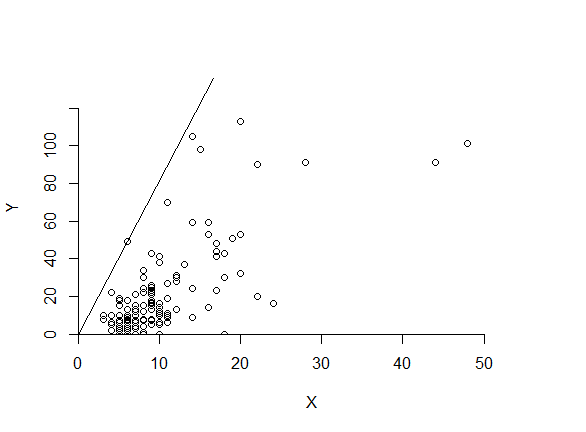
Figure 1. Efficiency Frontier under Constant Returns to Scale (CCR Model)
Data from Nepomuceno et al. (2020)[5]
Implementation in R
The following routine is a very simple example of how to implement the model using the Benchmarking library in R [4]. The data comes from Nepomuceno et al. (2020) [5] application on police efficiency.
Data <- read.csv2("./Police_Data.csv")
View(Data)
X <- Data$Efetivo # Defining the number of sworn officers and administrative staff as the input
Y1 <- Data$Res_CVLI # Defining the clear-ups for Violent Crime as the first police output
Y2 <- Data$Res_Trans # Defining the clear-ups for Street Robbery as the second police output
Y3 <- Data$Res_Veic # Defining the clear-ups for Vehicle Robbery as the third police output
Y <- matrix(c(Y1, Y2, Y3), ncol=3) # Matrix combining the 3 outputs
View(data.frame(X, Y))
library(Benchmarking)
E <- dea(X, Y, RTS = "crs", ORIENTATION = "in", SLACK = TRUE, DUAL = TRUE)
results <- data.frame(Data$DMU, E$eff, peers(E), E$sx, E$sy, lambda(E))
dea.plot.frontier(X, Y, RTS = "crs")
write.csv2(results, file = "./results.csv")
eff(e) # Efficiency Scores
peers(e) # Peers for Benchmarking of Best Practices
dea.plot(X, Y, RTS = "crs") # Efficient Frontier Plot
lambda(e) # Weights of Peers
e$ux # Marginal Contribution of each input
e$vy # Marginal Contribution of the output
e$sx # Input Slacks (resource to be reduced)
e$sy # Output Slacks (product to be expanded)
summary(e) # A nice summary of results
References
- A. Charnes; W. W. Cooper; E. Rhodes; Measuring the efficiency of decision making units. European Journal of Operational Research 1978, 2, 429-444, 10.1016/0377-2217(78)90138-8.
- Wade D. Cook; Larry M. Seiford; Data envelopment analysis (DEA) – Thirty years on. European Journal of Operational Research 2008, 192, 1-17, 10.1016/j.ejor.2008.01.032.
- Sherman, H. D., & Zhu, J.; Data Envelopment Analysis Explained. Service Productivity Management 2006, xxx, 49-89, 10.1007/0-387-33231-6_2.
- Peter Bogetoft and Lars Otto. Benchmarking with DEA, SFA, and R; , Eds.; Springer-Verlag: New York, 2011; pp. xxx.
- Thyago Celso Cavalcante Nepomuceno; Katarina Tatiana Marques Santiago; Cinzia Daraio; Ana Paula Cabral Seixas Costa; Exogenous crimes and the assessment of public safety efficiency and effectiveness. Annals of Operations Research 2020, xxx, 1-34, 10.1007/s10479-020-03767-6.


