 +1 credit
| Version | Summary | Created by | Modification | Content Size | Created at | Operation |
|---|---|---|---|---|---|---|
| 1 | Pavlos Lazaridis | + 3727 word(s) | 3727 | 2021-02-22 06:35:52 | | | |
| 2 | Camila Xu | Meta information modification | 3727 | 2021-02-25 09:11:39 | | |
Video Upload Options
Partial Discharge (PD) is an electrical fault that occurs within the insulating material of high voltage plant equipment, such as transformers, switch gear and transmission lines.
1. Introduction
A widely used and very effective metric for assessing the condition of high voltage (HV) plants is partial discharge (PD). PD is an electrical fault that occurs within the insulating material of high voltage plant equipment, such as transformers, switch gear and transmission lines [1][2]. PD is caused due to several reasons, such as defects in manufacturing, defects during installation, ageing and deterioration, over-stressing in service, corona discharge, surface discharge, and cavities. One frequent causes of PD is by a decrease in permittivity, and therefore an increase in electric field strength, due to the presence of a void or defect within the dielectric, resulting in a discharge across the void that does not breach the conductors [3][4], but can worsen over time due to prolonged electrical stresses increasing the physical size of the void. PD is defined by the IEC60270 standard as: “a localized electrical discharge that only partially bridges the insulation between conductors and which can or cannot occur adjacent to a conductor. Partial discharges are in general a consequence of local electrical stress concentrations in the insulation or on the surface of the insulation. Generally, such discharges appear as pulses having a duration of much less than 1 microsecond”[5].
These discharges may increase over time if the defect becomes physically larger, due to damage such as treeing (cracking of the insulation surrounding the void) caused by prolonged arcing across the void, eventually leading to catastrophic failure when the void is so large that the potential is able to breach the inner and outer conductors (referred to as flashover) [6]. PD faults are more likely to occur in aged HV plants, where long-term exposure to constant changes in environmental conditions may accelerate deterioration of the insulating material, such as thermal expansion and retraction.
An example of a typical PD fault is a gas-filled void within the insulation of a HV transmission line, represented by the Gemant and Phillippoff model [7] shown in Figure 1.

Figure 1. Gemant and Phillippoff gas-filled void partial discharge (PD) model [7].
Cd is the capacitance of the insulation, Cv is the capacitance of the gas-filled void, and Ca and Cb, are the dielectric capacitances in series with the void. As stated earlier, the permittivity of the void is lower than that of the surrounding insulation since the void tends towards the permittivity of air which is lower than that of the insulation; therefore, the electric-field strength within the void is increased and arcing may occur as the AC potential is increased across the conductors. The resulting arcing can weaken the surrounding insulation causing treeing, eventually leading to an increase in the size of the void and a greater risk of catastrophic failure. Figure 2 shows an example of a PD current pulse discharged across an insulation void as a result of the increased field strength within the void [8], where the strength of the PD is quantified by the total charge within it. Typically, the current pulse lasts between 1 and 1000 ns [8][9].
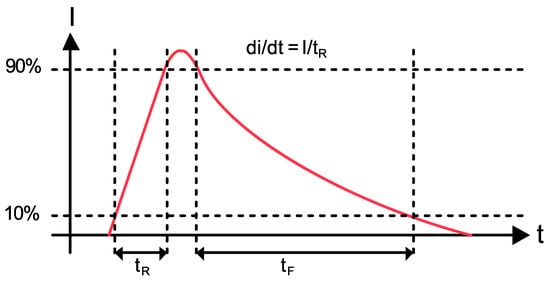
Figure 2. A PD current pulse across an HV insulation void.
Detecting and monitoring PD can give an indication of the current condition of the fault and allows for any changes in the condition to be critically assessed over time. Indication that a fault is worsening allows for action to be taken before total failure occurs. Traditional techniques for detecting partial discharge, which include galvanic contact devices, high-frequency current transformers (HFCTs) and transient earth voltage (TEV) sensors [10][11], provide highly accurate and detailed information on any PD activity within the equipment under observation, due to the close coupling of the sensor to the piece of the plant, such as a transformer or switchgear. This information includes apparent charge and spectra, giving an indication of the type of PD fault, as well as any fault progression over time.
Due to the requirement of close coupling to each piece of the plant to be observed, however, each sensor is only capable of monitoring the equipment it is coupled to, requiring separate sensors for each item of the plant to be monitored. Therefore, extensive monitoring of HV equipment within a large-scale substation would be difficult using these techniques, due to the extensive wiring harnessing required, along with the complexity of the data acquisition system needed. In addition, reconfiguration of the system, if required, would be difficult, and likely costly, due to the amount of manual labor required to physically reconnect sensors, along with the design and cost of a replacement wiring harness. However, wired techniques are used in several industries because direct coupling to devices is preferred in several applications where monitoring of a selective single component is required. Futhermore, in many applications, direct coupling is preferred just because of being more sensitive and noise/interference immune. Even this way, it may still be complicated to have sufficient sensitivity to detect and locate the fault within a component. For example, in the case of transformers with metallic enclosures, having to recognize and locate PD sources within the transformer requires that the sensors be placed inside the enclosure, as hardly any signal can propagate through the bushings.
Various alternative techniques have been suggested and developed for PD detection, monitoring, and measurement; these include optical measurement [12], acoustic techniques [13], and radiometric techniques that utilize the far-field electromagnetic wave propagated from the PD source due to the current discharged over the void. Optical PD measurement involves using fiber optic sensors and probes to detect ionization in oil and gas dielectrics [14] by detecting the light emitted during the ionization process. The benefits of optical PD measurement techniques include immunity to electromagnetic interference, as well as isolation from the HV equipment, due to the use of light coupling. However, a disadvantage is the requirement that each sensor has to be physically connected to the plant under test.
Acoustic techniques involve capturing localized acoustic emissions from the source of PD via audio sensors [15]. Captured acoustic emissions can be cross correlated with known PD transient acoustic patterns in order to assess if the acquired signal is of PD origin [16]. As with optical detection, acoustic techniques have the advantage of immunity to electromagnetic radiation. A difficulty with this type of measurement is susceptibility to local ambient noise. Additionally, acoustic measurements suffer due to the unpredictability of propagation paths and attenuation, limiting the maximum dielectric thickness that can be measured [17].
Radiometric PD measurement utilizes the electromagnetic signal that is propagated from a source of PD due to the current across the void. This radiometric signal is measured using a radio-receiver placed at a certain distance from the PD source. Figure 3 shows the process of receiving a radiometric signal from a source of PD.
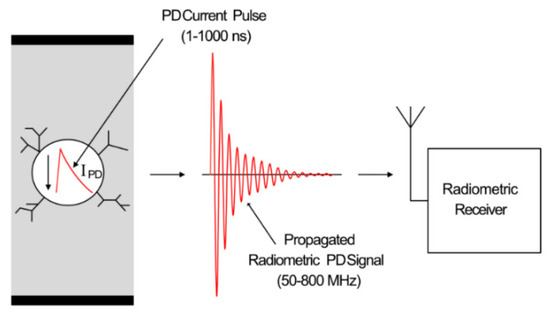
Figure 3. Radiometric PD propagation and reception using a radio receiver.
The 1–1000 ns current pulse discharged across the void transmits an electromagnetic wave, which has a frequency range of approximately 50–3000 MHz, depending on the type of defect and structure of the void [18]. However, due to the low-pass effect of the band-limiting propagation environment [19], the frequency range is limited to a range of approximately 50–800 MHz [20]. This radiometric signal is then received and measured via a radio receiver. Radiometric PD detection has various advantages, such as ease of installation, comparatively low cost, and potential scale-ability. Various disadvantages include susceptibility to electromagnetic interference, including locally transmitted radio signals, and limited range due to sensor sensitivity and the propagation environment.
2. Techniques for Radiometric Partial Discharge Measurement
Radiometric PD measurement has seen many developments over the past 20 years, due to the ease of installation and reconfiguration over other PD measurement techniques. Radiometric PD detection utilizes broadband radio receivers to detect and measure the electromagnetically radiated UHF signal propagated from a PD source [21][22][23]. Generally, multiple radiometric sensors, separated by a spacing of at least several meters, can be used to detect and locate a source of PD [24]. Radiometric PD detection allows for easy, non-intrusive installation, and is simple to reconfigure if required [22]. It provides an alternative that has several advantages over traditional PD measurement techniques since it does not require galvanic or physical contact with the item under observation; therefore, a single radiometric sensor is capable of monitoring multiple items of HV equipment simultaneously. Some wireless approaches for locating and monitoring PD utilize the received signal strength (RSS) of the electromagnetic energy propagated from a PD source, whilst more advanced techniques locate PD using the received time differences for a set of measurement sensors, such as time of arrival (TOA) and time difference of arrival (TDOA). Each technique has advantages and limitations, in relation to cost, complexity, accuracy, and efficiency.
2.1. Characteristics of Radiometric PD
As previously stated, the charge displaced in an insulation fault results in an electromagnetic signal propagated away from the discharge source. Whilst the actual current discharged in the fault is a pulse with a fall time in the order of 1 to 1000 ns, the resulting radiometric signal bears similarities to a classical decaying oscillation [25], with a frequency range in the order of 50–3000 MHz [26]. The frequency of the radiometric signal is dependent on the resonant structure of the insulation defect, resulting in a narrow-band band-pass response [27]. The propagation environment effectively low-pass filters this frequency range to 50–800 MHz, with the majority of the frequency content residing below 300 MHz.
A variety of radio receivers are capable of detecting and measuring the transmitted PD signal; however, a difficulty of radiometric PD monitoring is susceptibility to any electromagnetic interference. This includes locally transmitted signals within the VHF and UHF bands, such as FM, private mobile radio, digital audio broadcasting (DAB) and digital TV. Figure 4 shows the typical spectrum of broadcast frequencies within the VHF and UHF bands.
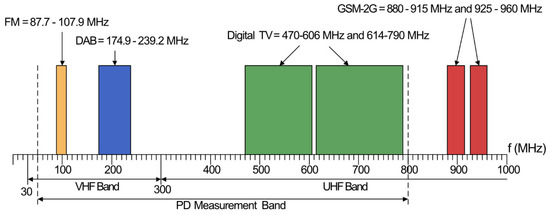
Figure 4. VHF/UHF electromagnetic spectrum with typical wide range transmission signals.
FM occupies the 87.7–107.9 MHz band, whilst DAB is typically broadcast within 174–239.2 MHz. Digital TV is broadcast at from 470 to 606 MHz and 614 to 790 MHz. 2G GSM is broadcast at 880–915 MHz and 925–960 MHz; however, this is outside of the band of interest. There are also sources of interference transmitted locally, such as fluorescent lamp ignition [28], unlicensed portable radios, such as PMR446, and licensed portable and amateur radio. Fluorescent lamp ignitions should only be a possible issue in indoor environments, in which additional filtering may have to be employed to remove the interference if it is problematic.
Amateur radio, which is transmitted within bands of 50–52 MHz, 70–70.5 MHz, 144–146 MHz, and 430–440 MHz [29], requires a license for broadcasting. Radios are also restricted to a maximum transmission power of 10, 17, and 26 dBW for foundation, intermediate and full license types [30], corresponding to theoretical distances of 10, 22, and 63 km, respectively, for a receiver sensitivity down to −40 dBm. However, in reality, these distances would be reduced due to the complexity of the propagation path, and it is unlikely that most radio amateurs would transmit at the maximum power allowed. The radiation pattern of the antenna used will also decrease the likelihood of amateur transmission, causing interference to radiometric PD detection.
License-free PMR446 radio is broadcast in a narrow-band of 446.0–446.2 MHz, and has a maximum transmission power limit of −3 dBW [31], corresponding to a distance of approximately 2 km. Whilst it is unlikely that these transmissions outside of a radiometric PD monitoring area would be received, there is a possibility that personnel within, or visiting, a HV site may operate personal radios operating in this band. Such transmissions would not be a significant issue, since these types of transmissions would only be temporary, and could be easily discriminated from a source of PD. Interference of this type from outside of the monitoring area would also be easily discriminated when localization was applied, positioning it outside of the HV area.
Ensuring that these locally transmitted signals do not interfere with the radiometric PD measurement requires some knowledge of the typical frequency content of various types of radiometric PD signals, such as those that propagate from insulation faults within transformers, switchgear, and transmission lines. Measured spectra for a variety of simulated defects have been presented in publications for purposes including propagation effects on UHF PD, antenna comparisons for reception, and similarities between galvanic and radiometric PD signals.
The data presented in [32] measure the frequency response of radiometric PD within gas-insulated switchgear (GIS) using sulphur-hexaflouride (SF6). The measurements were made using a biconical antenna and a log-periodic antenna, with bandwidths of 30–300 MHz and 80–1000 MHz respectively, at a distance of 2 m from the source of PD. The reported spectra were between 30 and 820 MHz, with the majority of the energy from 30 to 75 MHz. In [33], radiometric PD spectra were measured for an air-blast circuit breaker, with a focus on the change in spectra due to the propagation environment. Three sensor positions were used, two of which were fixed at a distance of 12 m from the PD source, and one which was varied between 12 and 18 m. The mean spectra measured at each position fluctuated by over 50 MHz between the three sensor positions; however, the majority of the frequency content was still between 50 and 400 MHz at each position.
In [34] and [35], a PD fault was emulated using a sandwich of transformer paper submerged in transformer oil. Five sheets were used in [34] in between two electrodes paper, whilst eleven sheets were used in [35], with the five inner most sheets pierced with a 1 mm hole to produce an air-filled void. The radiometric PD signal produced was then measured using four different antennas, a 5 and 10 cm monopole, a log-periodic and a zig-zag antenna. The cumulative power was measured with and without the PD source in bands of 0–300 MHz and 1300 to 1900 MHz, with the ratio of the two cumulative quantities provided, therefore allowing for the difference in received power to be determined between background broadcast interference and PD within these bands, along with the power level in each band.
The results reported in [34] show that the majority of the received power is within the 0–300 MHz band, with the exception of the 5 cm monopole antenna, where the majority of received power was in the 1300–1900 MHz band. However, the reason for this is that the lower bandwidth of such an antenna is restricted due to its physical size, since a monopole antenna should be half the wavelength of the received signal frequency [36].
The results shown in [35] divide the measured spectrum into 250 MHz bands for each antenna, from DC to 2.5 GHz, with the log-periodic taken as the absolute measurement due to its flat frequency response across the specified range. The antennas were placed at a distance of 45 cm from the PD source, with the exception of the log-periodic antenna, which was placed at a distance of 90 cm to ensure the antenna was in the far field. Approximately 75% of the received power was measured in the 0–250 MHz band, along with 17% in the 250–500 MHz band. The remaining energy was between 1.4% and 0.26% in each consecutive frequency band.
The spectra of three simulated PD faults within a HV transformer were measured in [37]—an internal void PD fault, a surface PD fault and a insulator bushing PD fault. The internal PD fault was simulated with a dielectric oil-filled glass vessel placed inside a transformer tank which contained eleven layers of insulation, with a 1 mm hole perforated through the three inner most layers to produce an air-filled void. Two electrodes are connected to each side of the vessel to attach a HV source, the air was removed using a vacuum in order to ensure a lower permittivity withing the void than in the insulating layers.
The surface PD fault was created using a twisted-pair of HV, resin polyamide-imide insulation, enameled wire placed within the tank, which has an additional layer of polyester tris hydroxyethyl isocyanurate over the insulation. Finally, the bushing fault was generated using a porcelain bushing insulator whose surface was covered with a saline solution, which was allowed to dry in order to obtain a salt polluted surface to generate PD. The emulated PD faults were measured using two 10 cm monopole antennas, one placed inside the tank and one outside at a distance of 30 cm from the fault under test. The spectra were measured within three bands—a lower band of 0–300 MHz, a middle band of 300–1200 MHz, and an upper band of 1200–2500 MHz.
The cumulative power within each band was measured, with and without the PD fault, to determine the contribution of locally transmitted interfering transmissions. For the internal PD fault, the percentages of power measured by the inner antenna were 0.3%, 94.3%, and 5.4% for the lower, middle, and upper bands, respectively, whilst the percentages were 61.9%, 35.8%, and 2.1% in the lower, middle, and upper bands for the outer antenna, respectively. For the surface PD fault, the measured powers in each band were 0.1%, 99.1%, and 0.8%, and 89.2%, 10.7%, and 0.1%, in the lower, middle, and upper bands for the inner and outer antennas, respectively.
The cumulative energies for the bushing PD fault in the lower, middle, and upper bands were 69.3%, 27.4%, and 3.3% for the inner antenna, and 40.3%, 58.1%, and 1.6% for the outer antenna. For the two internal fault types, the majority of the cumulative power measured by the internal antenna was in the middle band, whilst for the external antenna, the majority of power was in the lower band. The inverse of this is the case for the bushing fault, where the majority of the power was in the middle band. The reason for this was due to the transformer tank causing low-pass filtering to the radiometric signal. However, the higher frequency content of the measurements made where the tank was not an obstruction was closely related. A measurement made at a distance greater than 3 m would likely have incurred attenuation to the higher frequency content.
In [38], the spectra of an emulated HV floating electrode PD fault, which is a common fault in switchgear [39], was obtained and compared using both galvanic and radiometric measurements.
A floating electrode PD test cell was energized to 6.2 kV using a HV DC supply. The measured energy was divided into bands of 50–290, 290–470, and 470–800 MHz. For the contact and radiometric measurements, the percentages of energy in each band were 62.8% and 78.3% in the 50–290 MHz band, 0.76% and 4.33% in the 290–470 MHz band, and 0.56% and 1.59% in the 470–800 MHz band, respectively, and the remaining energy was below 50 MHz. In both cases, the majority of the measured energy was within the 50–290 MHz band.
In [20][40], spectra were taken for a further two emulated PD faults using galvanic and radiometric measurements. Both PD cells emulated defects within solid insulation. One consisted of an acrylic tube containing two electrodes at each end, between the electrodes a sandwich of three circular pieces of 1.5 mm thick FR4 insulation are placed, in which the middle piece has a 1 mm hole drilled in the center to create a higher electric field within it, and therefore, a discharge. The second consisted of a sandwich of three sheets of 2.4 mm-thick epoxy glass dielectric between two electrodes, with a 1 mm diameter hole, again, drilled in the center of the middle sheet.
The acrylic tube PD source was filled with transformer oil in order to suppress any discharges occurring at the edges of the electrodes. However, measurements were taken with and without the presence of oil. The acrylic tube emulator was energized to 20 kV AC, both with and without oil, to generate PD, whilst the epoxy glass dielectric emulator was energized to 18 kV AC. Even though the frequency response of the acrylic tube emulator was higher with the presence of oil, almost the entire energy is in the 50–800 MHz band for all three measurements of the two emulators, with the majority of the energy being below 300 MHz.
2.2. Time Difference of Arrival PD Measurement
TOA and TDOA techniques, traditionally used for radio positioning systems, use the times that signals are received at specific receivers to determine the distance, using the speed of light to convert time to distance, of a transmitting signal from each receiver, and therefore, the location of the transmitting source [41]. TOA relies on the time at which the transmitted signal was sent along with the reception time for each receiver, whereas TDOA only requires the latter, and is therefore more versatile [42]. Figure 5 shows an example of TDOA positioning.
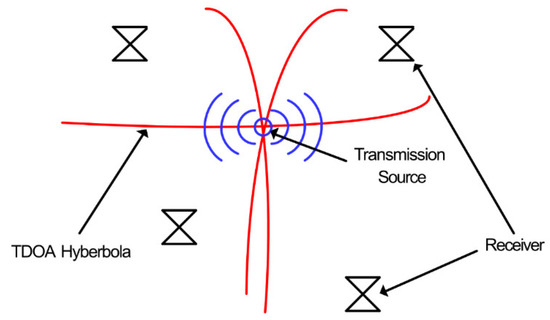
Figure 5. Time difference of arrival (TDOA) location of a wireless transmission with multilateration [42].
In this example, four receivers are positioned around a transmitting signal which is the target for location. The distance of the source from each receiver is calculated by determining the precise time difference of received signals between sensors. This is then converted to distance using the speed of light. The resulting distances are used to plot hyperbolic lines via non-linear regression, at which the intersecting point of the lines is the estimation for the transmission [43]. TDOA has been used in many schemes for PD location and can provide accuracy within 5 cm [44].
TDOA techniques have been employed for the detection of PD using multiple techniques, such as cross-correlation, cumulative energy, and the amplitude of the first received peak [45][46], that is, by comparing received PD patterns, or by using the integral of the received signal or the amplitude of the first received peak. TDOA location provides a high level of estimation accuracy and has been used to successfully detect and locate sources of PD in live HV environments [47][48][49][50][51].
Although TDOA techniques provide an accurate and non-invasive solution to PD detection and location, there are various constraints that impact the feasibility of large-scale deployment using this technology. The sample-rate required to discern the differences has to be as high as possible, since the time between samples equates to the resolution in distance [52]. Since the transmitted signal is a radiometric electromagnetic wave, the resolution in distance is proportional to the speed of light divided by the sample rate. For example, a sample rate of 1 GSa/s has a resolution distance of 30 cm, whereas a sample rate of 5 GSa/s has a distance resolution of 6 cm [53]. Whilst techniques such as interpolation can be used to increase the distance resolution at reduced sample rates [54][55], rates in excess of 1 GSa/s are still necessary.
The requirement for high sample rates makes this technology less attractive for a flexible large-scale battery powered wireless sensor network (WSN), since the power requirements of such a high-speed data processing system would not be capable of sustained operation from a single battery source over a reasonable period of time and would also have considerable costs. Furthermore, the complexity of scaling a coherent TDOA system on a large scale would be difficult, due to requirement for synchronization between nodes to accurately determine the time difference of signal reception.
References
- Ryan, M.H. High Voltage Engineering and Testing, 2nd ed.; IEE: Herts, UK, 2001.
- Lemke, E.; Berlijn, S.; Gulski, E.; Muhr, H.M.; Pultrum, E.; Strehl, T.; Hauschild, W.; Rickmann, J.; Rizzi, G. Guide for Electri-cal Partial Discharge Measurements in compliance to IEC 60270. Electra 2008, 241, 60–68
- Bartnikas, R.; McMahon, E.J. Engineering Dielectrics, 1st ed.; American Society for Testing and Materials: Baltimore: West Conshohocken, PA, USA, 1979.
- Y. Z.; Arief, W.A.; Izzati, Z.A. Modeling of Partial Discharge Mechanisms in Solid Dielectric Material. Int. J. Eng. Innov. Tech-nol. 2012, 1, 315–320.
- 60270, I.I.S. High Voltage Test Techniquies—Partial Discharge Measurements, 3rd ed.; International Electrotechnical Commission (IEC): Geneva, Switzerland, 2000.
- Short, A.T. Electric Power Distribution Handbook, 2nd ed.; CRC Press: Boca Raton, FL, USA, 2014.
- Gemant, A.; Philipoff, W. Die Funkenstrecke mit Vorkondensator. (German) [The spark gap with precondenser]. Zeitschift F. Techn. Phys. 1931, 9, 425–430.
- Okubo, H.; Hayakawa, N.; Matsushita, A. The Relationship Between Partial Discharge Current Pulse Waveforms and Phys-ical Mechanisms. IEEE Electr. Insul. Mag. 2002, 18, 38–45.
- Kind, D.; Feser, K. High Voltage Test Techniques, 2nd ed.; Newnes: Oxford, UK, 2001.
- Stone, G.C. Partial Discharge Diagnostics and Electrical Equipment Insulation Condition Assessment. IEEE Trans. Dielectr. Electr. Insul. 2005, 12, 891–903.
- Jennings, E.; Collinson, A. A Partial Discharge Monitor for the Measurement of Partial Discharges in a High Voltage Plant by the Transient Earth Voltage Technique. In Proceedings of the IET International Conference on Partial Discharge, Canterbury, UK, 28–30 September 1993; pp. 90–91.
- Schwarz, R.; Muhr, M. Modern Technologies in Optical Partial Discharge Detection. In Proceedings of the Electrical Insula-tion and Dielectric Phenomena (CEIDP), Vancouver, BC, Canada, 14–17 October 2007; pp. 163–166.
- Markalous, S.M.; Tenbohlen, S.; Feser, K. Detection and Location of Partial Discharges in Power Transformers using Acoustic and Electromagnetic Signals. IEEE Trans. Dielectr. Electr. Insul. 2008, 15, 1576–1583.
- Czichos, H. Handbook of Technical Diagnostics—Fundamentals and Application to Structures and Systems, 1st ed.; Spring-er-Verlag: Berlin, Germany, 2013.
- Ao, S.L.; Gelman, L. Electrical Engineering and Applied Computing, 1st ed.; Springer: New York, NY, USA, 2011.
- Swedan, A.; El-Hag, A.H.; Assaleh, K. Enhancement of Acoustic based Partial Discharge Detection using Pattern Recognition Techniques. In Proceedings of the International Conference on Electric Power and Energy Conversion Systems (EPECS), Sharjah, United Arab Emirates, 15–17 November 2011; pp. 1–4.
- Cselko, R.; Tamus, Z.A.; Szabo, A.; Berta, I. Comparison of Acoustic and Electrical Partial Discharge Measurements on Cable Terminations. In Proceedings of the IEEE International Symposium on Electrical Insulation, San Diego, CA, USA, 6–9 June 2010; pp. 1–4.
- Chen, Q.; Gong, X.; Gao, W.; Li, F.; Tan, K. The UHF Method for Measurement of Partial Discharge in Oil-Impregnated Insu-lation. In Proceedings of the 7th International Conference on Properties and Applications of Dielectric Materials, Nagoya, Japan, 1–5 June 2003; pp. 451–454.
- Franceschetti, M. Wave Theory of Information, 1st ed.; Cambridge University Press: Cambridge, UK, 2018.
- Jaber, A.A.; Lazaridis, P.I.; Moradzadeh, M.; Glover, I.A.; Zaharis, Z.D.; Vieira, M.F.Q.; Judd, M.D.; Atkinson, R.C. Calibra-tion of Free-Space Radiometric Partial Discharge Measurements. IEEE Trans. Dielectr. Electr. Insul. 2017, 24, 3004–3014.
- Candela, R.; Stefano, A.D.; Fiscelli, G.; Bononi, S.F.; Rai, L.D. A novel partial discharge detection system based on wireless technology. In Proceedings of the AEIT Annual Conference, Mondello, Italy, 3–5 October 2013; pp. 1–6.
- Moore, P.J.; Portugues, I.; Glover, I.A. A non-intrusive partial discharge measurement system based on RF technology. In Proceedings of the IEEE Power Engineering Society General Meeting, Toronto, Canada, 13–17 July 2003; Volume 4, pp. 628–633.
- Meijer, S.; Agoris, P.D.; Gulski, E.; Seitz, P.P.; Hermans, T.J.W.H. Condition assessment of power cable accessories using advanced VHF/UHF PD radio-frequency techniques. In Proceedings of the IEEE International Symposium on Electrical Insu-lation, Toronto, Canada, 11–14 June 2006; pp. 482–485.
- Kakeeto, P.; Judd, M.; Pearson, J.; Templeton, D. Experimental investigation of positional accuracy for UHF partial discharge location. In Proceedings of the International Conference on Condition Monitoring and Diagnosis (CMD 2008), Beijing, China, 21–24 April 2008; pp. 1070–1073.
- Liu, Y.; Zhou, W.; Li, P.; Yang, S.; Tian, Y. An Ultrahigh Frequency Partial Discharge Signal De-Noising Method Based on a Generalized S-Transform and Module Time-Frequency Matrix. Sensors 2016, 16, 1–19.
- Tenbohlen, S.; Denissov, D.; Hoek, S.M.; Markalous, S.M. Partial Discharge Measurement in the Ultra High Frequency (UHF) Range. IEEE Trans. Dielectr. Electr. Insul. 2008, 15, 1544–1552.
- Siegel, M.; Tenbohlen, S. Comparison between Electrical and UHF PD Measurement concerning Calibration and Sensitivity for Power Transformers. In Proceedings of the International Conference on Condition Monitoring and Diagnosis (CMD), Jeju, Korea, 22 September 2014; pp. 5–8.
- Albarracin, R.; Ardila-Rey, J.A.; Mas’ud, A.A. Separation of Sources in Radiofrequency Measurements of Partial DIscharges using Time-Power Ratio Maps. Isa Trans. 2015, 58, 389–397.
- Ofcom. United Kingdom Frequency Allocation Table; Issue No. 18v1.1.; Ofcom: London, UK, 2017.
- Ofcom. UK Interface Requirement 2028; 2015/1535/EU Notification Number: 2006/511/UK; Ofcom: London, UK, 2018.
- Ofcom. Analogue and Digital PMR446 Information Sheet; Ofcom: London, UK, 2018.
- Hoshino, T.; Kato, K.; Hayakawa, N.; Okubo, H. A Novel Technique for Detecting Electromagnetic Wave Caused by Partial Discharge in GIS. IEEE Trans. Power Deliv. 2001, 16, 545–551.
- Portugues, I.E.; Moore, P.J. Study of Propagation Effects of Wideband Radiated RF Signals from PD Activity. In Proceedings of the IEEE International Instrumentation and Measurement Technology Conference (I2MTC), Montreal, Canada, 1 January 2006; pp. 1–6.
- Robles, G.; Martinez-Tarifa, J.M.; Rojas-Moerno, M.V.; Albarracin, R.; Ardila-Rey, J. Antenna selection and frequency re-sponse study for UHF detection of partial discharges. In Proceedings of the IEEE International Instrumentation and Meas-urement Technology Conference (I2MTC), Graz, Austria, 13–16 May 2012; pp. 1–4.
- Robles, G.; Sanchez-Fernandez, M.; Albarracin, R.; Rojas-Merno, M.V.; Rajo-Iglesias, E.; Martinez-Tarifa, J.M. Antenna Par-ametrization for the Detection of Partial Discharges. IEEE Trans. Instrum. Meas. 2013, 62, 932–941.
- Weiner, M.M. Monopole Antennas, 1st ed.; Marcel Dekker, Inc.: New York, NY, USA, 2003.
- Albarracin, R.; Ardila-Rey, J.A.; Mas’ud, A.A. On the Use of Monopole Antennas for Determining the Effect of the Enclosure of a Power Transformer Tank in Partial Discharges Electromagnetic Propagation Sensors 2016, 16, 1–18.
- Jaber, A.; Lazaridis, P.; Saeed, B.; Zhang, Y.; Khan, U.; Upton, D.; Ahmed, H.; Mather, P.; Vieira, M.F.Q.; Atkinson, R.; et al. Frequency Spectrum Analysis of Radiated Partial Discharge Signals. In Proceedings of the IET European Electromagnetics Symposium (EUROOEM), London, UK, 11–14 July 2016; pp. 1–2.
- Yao, R.; Zhang, Y.; Si, G.; Yuan, Y.; Xie, Q. Measurement and Analysis of Partial Discharge on Floating Electrode Defect in GIS. In Proceedings of the IEEE International Conference on High Voltage Engineering and Application (ICHVE), Chengdu, China, 19–22 September 2016; pp. 1–4.
- Jaber, A.; Lazaridis, P.; Saeed, B.; Mather, P.; Vieira, M.F.Q.; Atkinson, R.; Tachtatzis, C.; Iorkyase, E.; Judd, M.; Glover, I.A. Diagnostic Potential of Free-Space Radiometric Partial Discharge Measurements. In Proceedings of the URSI General Assem-bly and Scientific Symposium (GASS), Montreal, Canada, 19–26 August 2017; pp. 1–4.
- Bensky, A. Wireless Positioning Technologies and Applications, 2nd ed.; Artech House: Norwood, MA, USA, 2016.
- Yu, K.; Sharp, I.; Guo, Y.J. Ground-Based Wireless Positioning, 1st ed.; Wiley / IEEE: Chichester, UK, 2009.
- Nakashima, H.; Aghajan, H.; Augusto, J.C. Handbook of Ambient Intelligence and Smart Environments, 1st ed.; Springer: New York, NY, USA, 2010.
- Liu, Y.; Yang, Z.; Wang, X.; Jian, L. Location, Localization, and Localizability. J. Comput. Sci. Technol. 2010, 25, 274–297.
- Sinaga, H.H.; Phung, B.T.; Blackburn, T.R. Partial Discharge Localization in Transformers Using UHF Detection Method. Trans. Dielectr. Electr. Insul. 2012, 19, 1891–1900.
- Tian, Y.; Qi, B.; Zhuo, R.; M.; Fu, C.L. Locating partial discharge source occurring on transformer bushing by using the im-proved TDOA method. In Proceedings of the International Conference on Condition Monitoring and Diagnosis (CMD), Xi’ian, China, 25–28 September 2016; pp. 144–147.
- Judd, M.D. Radiometric Partial Discharge Detection. In Proceedings of the International Conference on Condition Monitoring and Diagnosis (CMD), Beijing, China, 21–24 April 2008; pp. 1–6.
- Portugues, I.E.; Moore, P.J.; Glover, I.A.; Johnstone, C.; McKosty, R.H.; Goff, M.B.; van der Zel, L. RF-Based Partial Discharge Early Warning System for Air-Insulated Substations. Trans. Dielectr. Electr. Insul. 2009, 24, 20–29.
- Zhu, M.X.; Wang, Y.B.; Li, Y.; Mu, H.B.; Deng, J.B.; Shao, X.J.; Zhang, G.J. Detection and Localization of Partial Discharge in Air-Insulated Substations using UHF Antenna Array. In Proceedings of the IEEE Conference on Power Engineering and Re-newable Energy (ICPERE), Yogyakarta, Indonesia, 29–30 November 2016; pp. 221–224.
- Zhu, M.X.; Wang, Y.B.; Liu, Q.; Zhang, J.N.; Deng, J.B.; Zhang, G.J.; Shao, X.J.; He, W.L. Localization of Multiple Partial Discharge Sources in Air-Insulated Substation using Probability-Based Algorithm. IEEE Trans. Dielectr. Electr. Insul. 2017, 24, 157–166.
- Li, P.; Zhou, W.; Yang, S.; Liu, Y.; Tian, Y.; Wang, Y. Method for Partial Discharge Localization in Air-Insulated Substations. Iet Sci. Meas. Technol. 2017, 11, 331–338.
- Buchanan, W.J. The Handbook of Data Communications and Networks, 2nd ed.; Springer: Dordrecht, The Netherlands, 2004.
- Robles, G.; Fresno, J.M.; Sanchez-Fernandez, M.; Martinex-Tarifa, J.M. Antenna Deployment for the Localization of Partial Discharges in Open-Air Substations. Sensors 2016, 16, 1–11.
- Moore, P.J.; Portugues, I.E.; Glover, I.A. Radiometric Location of Partial Discharge Sources on Energized High-Voltage Plant. IEEE Trans. Power Deliv. 2005, 20, 2264–2272.
- Robles, G.; Fresno, J.M.; Martinex-Tarifa, J.M. Separation of Radio-Frequency Sources and Localization of Partial Discharges in Noisy Environments. Sensors 2015, 15, 9882–9898.

