 +1 credit
| Version | Summary | Created by | Modification | Content Size | Created at | Operation |
|---|---|---|---|---|---|---|
| 1 | Geoffrey Peitz | + 729 word(s) | 729 | 2021-02-22 09:15:13 | | | |
| 2 | Vicky Zhou | + 4 word(s) | 733 | 2021-02-23 05:54:08 | | |
Video Upload Options
Magnetoencephalography (MEG) is a functional brain imaging technique that measures magnetic flux on the surface of the head associated with underlying neuronal electrical dipoles.
1. Introduction
Magnetoencephalography (MEG) is a functional brain imaging technique with high temporal resolution compared with techniques that rely on metabolic coupling. MEG has an important role in epilepsy treatment and research in the form of magnetic source imaging (MSI) as well as research on traumatic brain injury (TBI) and psychiatric disorders such as post-traumatic stress disorder (PTSD) which are not necessarily visible on conventional anatomic brain imaging.
Most functional brain imaging techniques measure neuronal activity indirectly through neurovascular or metabolic coupling. That is, to provide energy for increased neuronal activity, local cerebral blood flow and glucose uptake increase. Neurovascular coupling is the basis for functional MRI (fMRI) with blood-oxygen-level-dependent (BOLD) imaging or arterial spin labeling (ASL) MRI. Neurovascular coupling is also the basis for single-photon emission computed tomography (SPECT), which measures gamma emissions from Technetium tc 99 m exametazime. Finally, neurovascular coupling is the basis for functional near infrared spectroscopy (fNIRS), which compares light absorbance in the wavelengths absorbed by oxyhemoglobin with the wavelengths absorbed by deoxyhemoglobin. Alternatively, metabolism coupling to neuronal activity is the basis for positron emission tomography (PET), which detects emissions from a radiotracer linked to a biologically active molecule such as fluorodeoxyglucose (FDG). Although these techniques, especially fMRI, provide good spatial resolution, there is a delay between neuronal activation and the associated increase in blood flow and energy supply. Diagnostic techniques that directly measure neuronal activity, including electroencephalography (EEG) and magnetoencephalography (MEG), have superior temporal resolution.
2. MEG Processing Steps
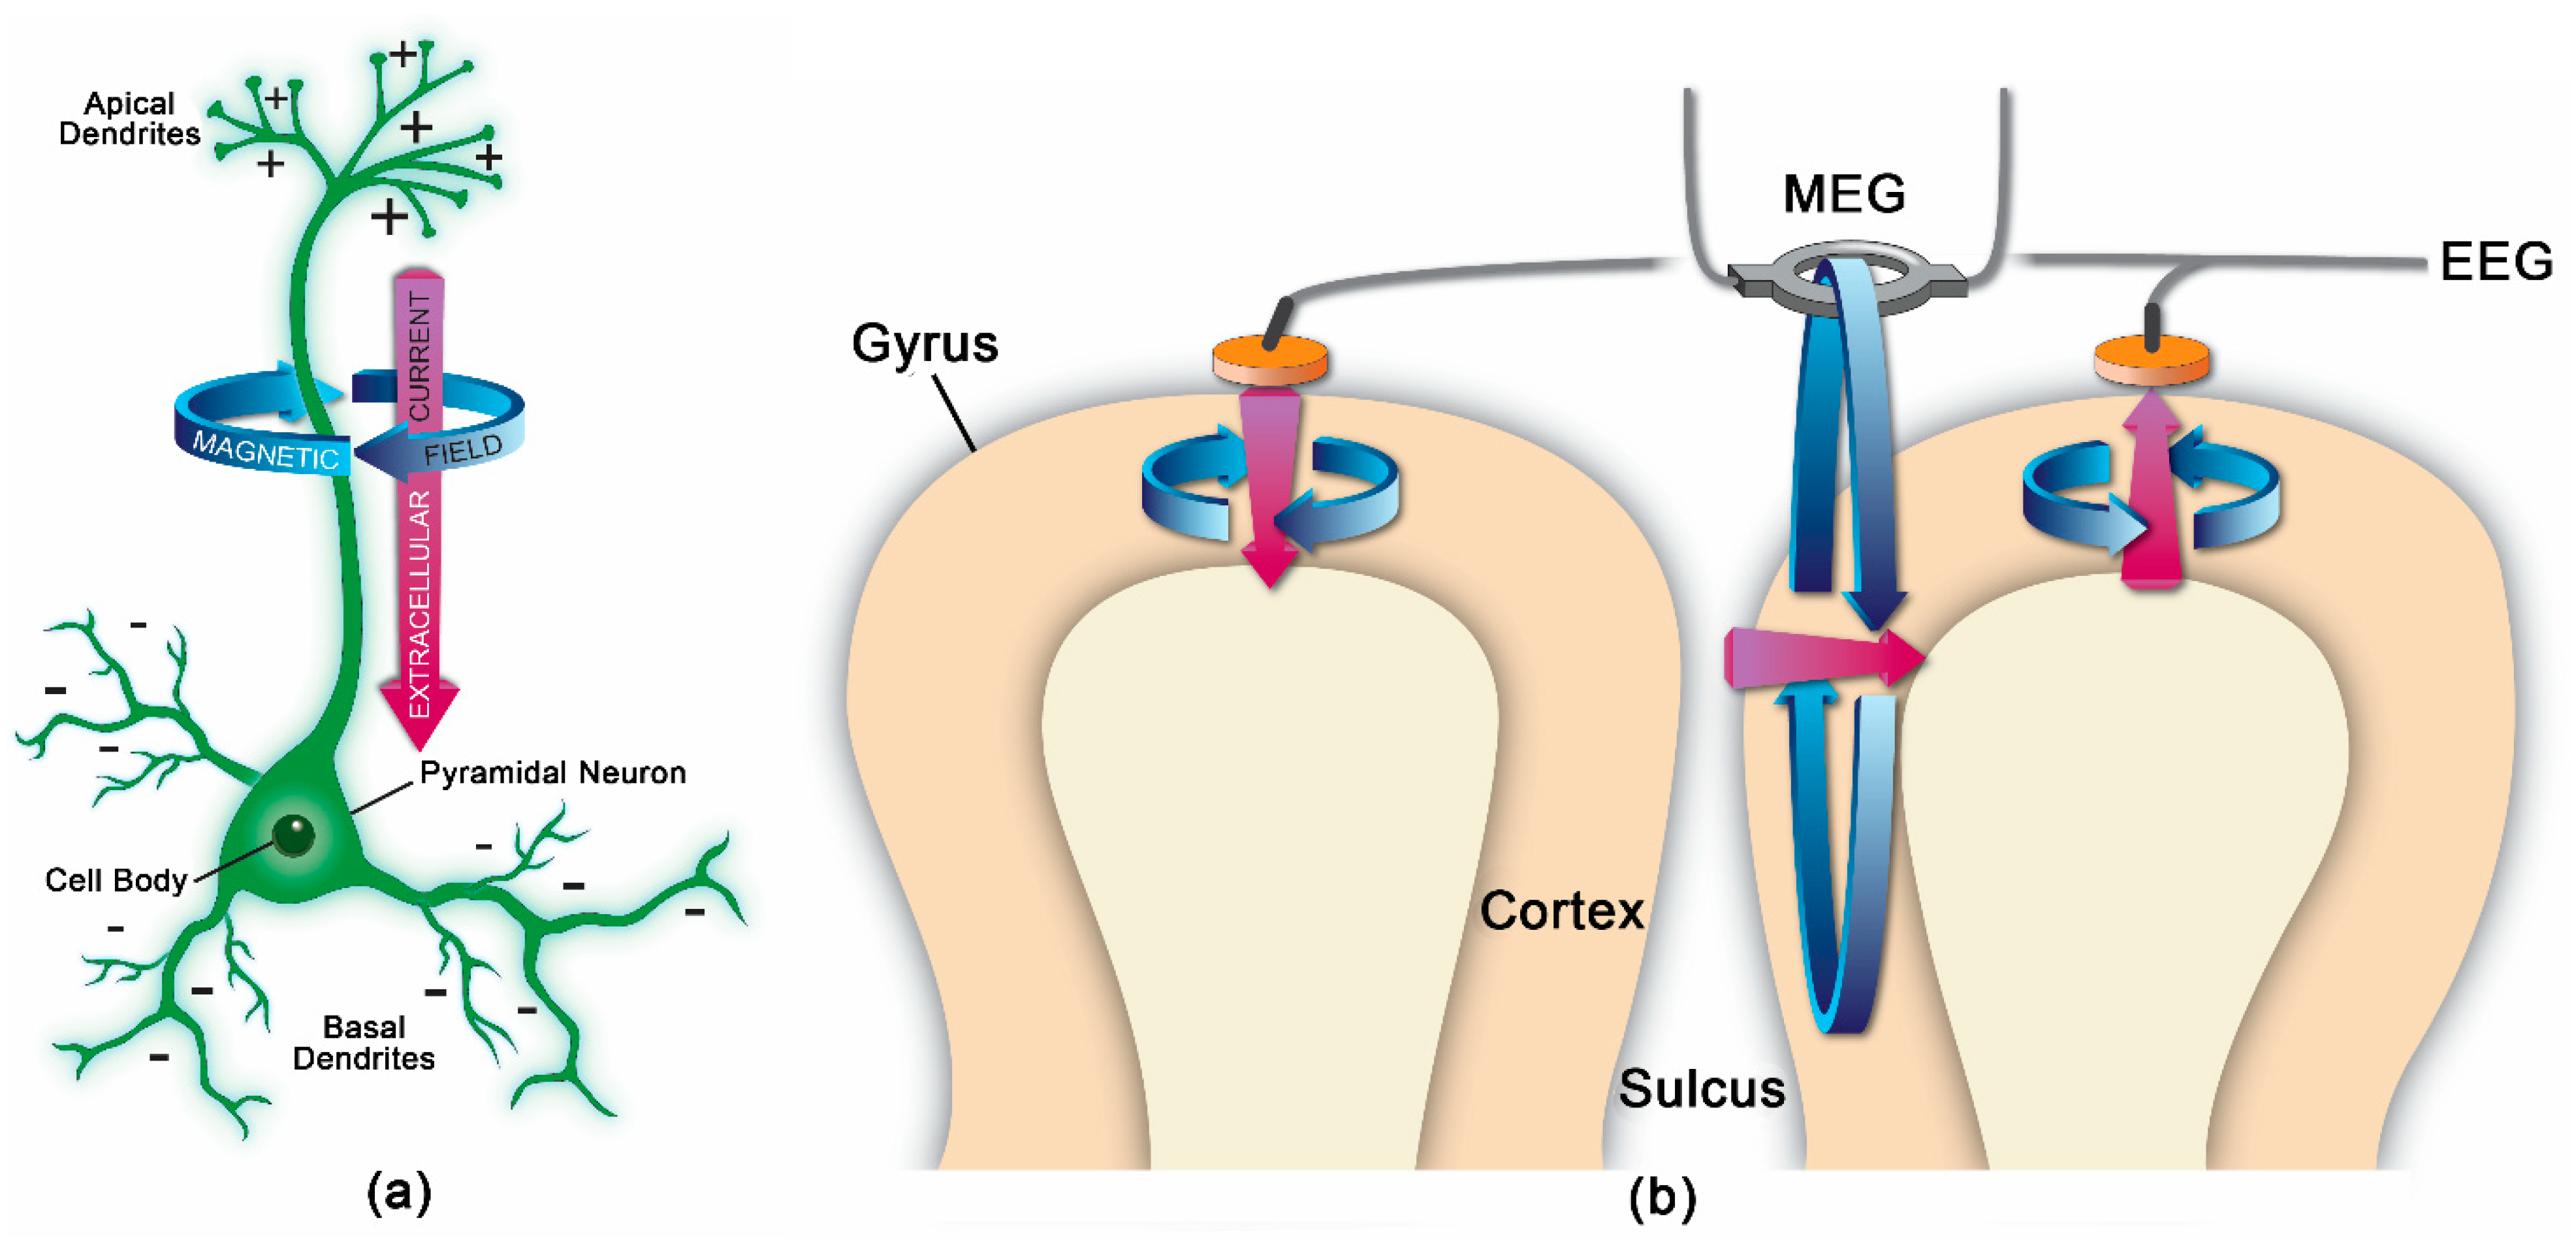
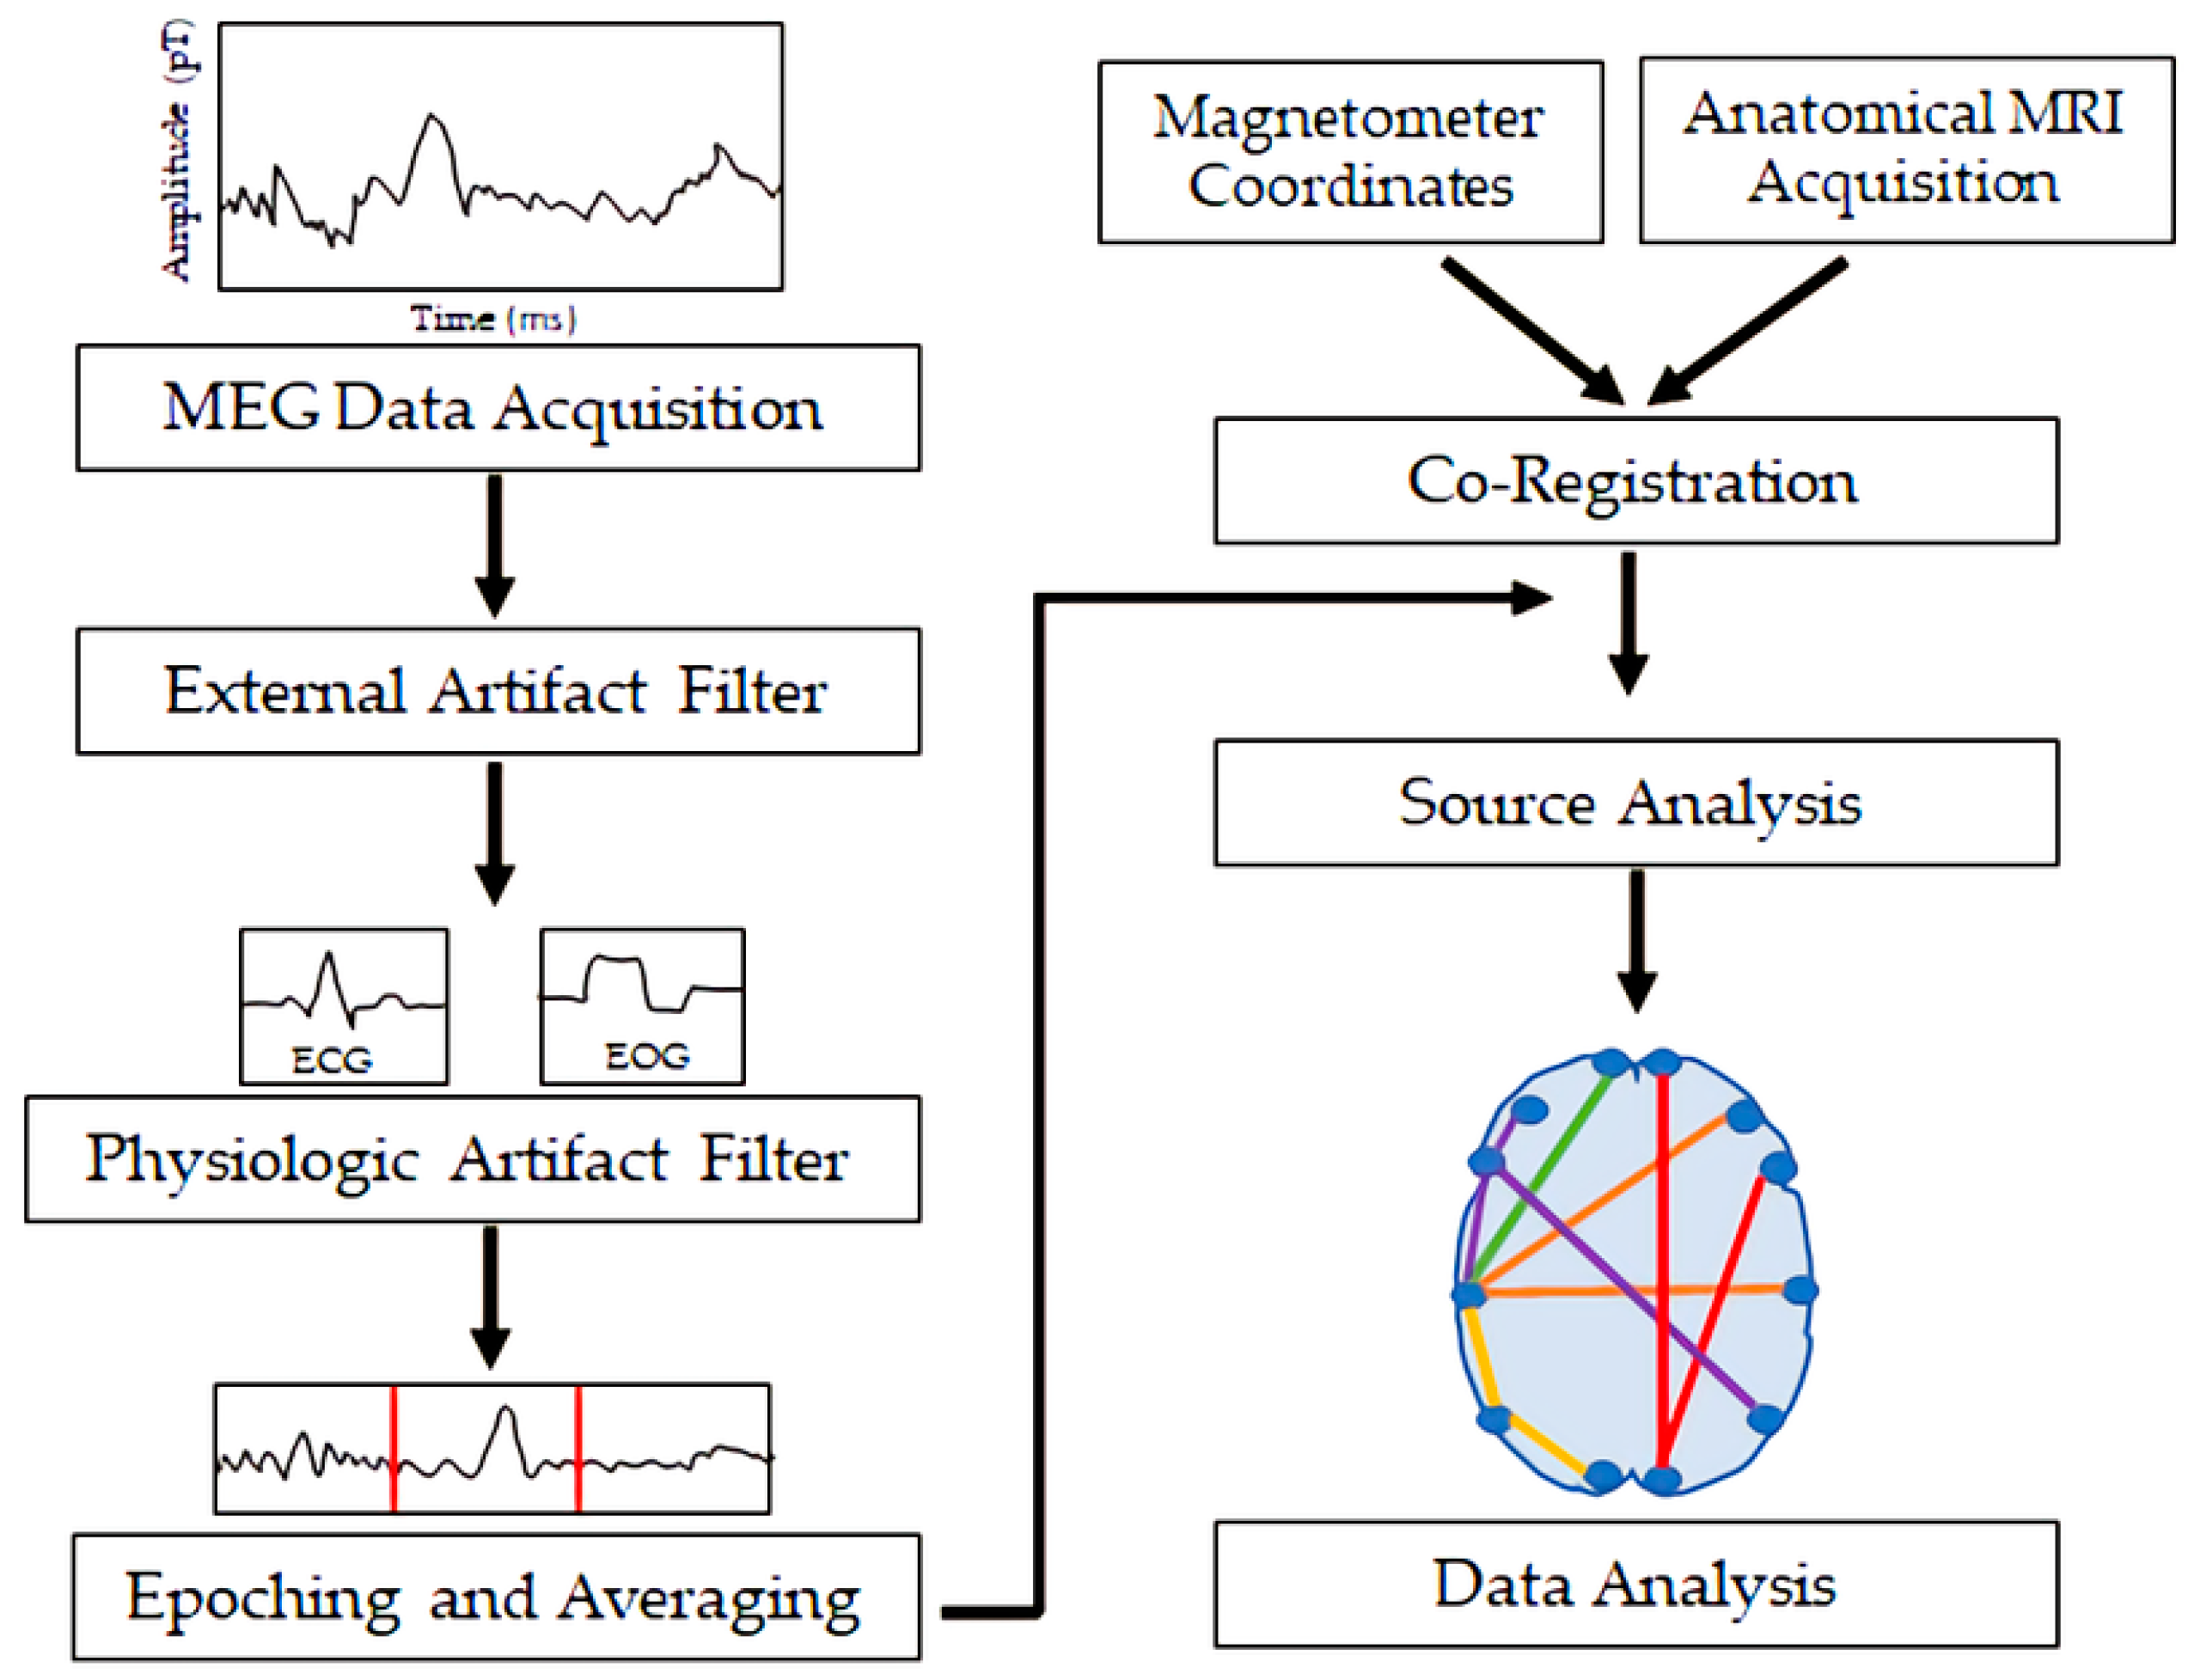
MEG measures magnetic flux on the surface of the head associated with underlying neuronal electrical currents. Magnetic signals from the brain were first recorded by the physicist David Cohen in 1968 [1]. Since then, MEG has developed into a sophisticated technique involving approximately 300 sensors on the scalp, along with appropriate shielding to minimize noise from background magnetic fields. Ion currents from post-synaptic potentials make the biggest contribution to the MEG signal; the currents include intracellular currents along the soma–dendritic axis and an opposite-direction extracellular return current [2]. To generate a magnetic field detectable by scalp sensors, simultaneous currents must occur in neurons with similar orientations. Therefore, the neocortical pyramidal neurons aligned perpendicular to the cortical surface generate the primary signals detected by MEG, but action potentials and fast sodium ion spikes may also contribute if synchronized [2]. Like EEG, MEG allows for analysis of neural oscillatory activity across a range of frequency bands (e.g., delta, <4 Hz; theta, 4–8 Hz; alpha, 8–12 Hz; beta, 12–30 Hz; gamma, >30 Hz). MEG has a similar temporal resolution to EEG, but MEG is less susceptible to distortion from variations in tissue conductivity than EEG [2]. EEG, however, can detect both radial and tangential currents, whereas MEG only detects the tangential component of currents. Therefore, MEG and EEG may be combined for optimal neuronal signal detection. Figure 1 demonstrates the orientation of electrical currents and magnetic fields in relation to MEG and EEG sensors. Figure 2 demonstrates an overview of the MEG processing steps, including filtering external and physiological artifacts, identifying epochs and averaging signal from like epochs, and coregistration of the MEG sensor coordinates with anatomical MRI for source analysis.
MEG has been used with sophisticated signal processing and data analysis techniques including machine learning and graph theory to analyze normal and pathological neural oscillatory activity and brain connectivity patterns in patients with a variety of conditions.
References
- James, S.L.; Theadom, A.; Ellenbogen, R.G.; Bannick, M.S.; Montjoy-Venning, W.; Lucchesi, L.R.; Abbasi, N.; Abdulkader, R.; Abraha, H.N.; Adsuar, J.C.; et al. Global, regional, and national burden of traumatic brain injury and spinal cord injury, 1990–2016: A systematic analysis for the Global Burden of Disease Study 2016. Lancet Neurol. 2019, 18, 56–87.
- Dewan, M.C.; Rattani, A.; Gupta, S.; Baticulon, R.E.; Hung, Y.-C.; Punchak, M.; Agrawal, A.; Adeleye, A.O.; Shrime, M.G.; Rubiano, A.M.; et al. Estimating the global incidence of traumatic brain injury. J. Neurosurg. 2018, 130, 1080–1097.

