 +1 credit
| Version | Summary | Created by | Modification | Content Size | Created at | Operation |
|---|---|---|---|---|---|---|
| 1 | Ki Tae Suk | + 4458 word(s) | 4458 | 2021-02-05 06:41:49 | | | |
| 2 | Bruce Ren | -19 word(s) | 4439 | 2021-02-19 04:47:31 | | | | |
| 3 | Bruce Ren | -19 word(s) | 4439 | 2021-02-19 05:00:25 | | |
Video Upload Options
Advances in high-throughput screening of metabolic stability in liver and gut microbiota are able to identify and quantify small-molecule metabolites (metabolome) in different cellular microenvi-ronments that are closest to their phenotypes. Metagenomics and metabolomics are largely recog-nized to be the “-omics” disciplines for clinical therapeutic screening. Here, metabolomics activity screening in liver disease (LD) and gut microbiomes has significantly delivered the integration of metabolomics data (i.e., a set of endogenous metabolites) with metabolic pathways in cellular en-vironments that can be tested for biological functions (i.e., phenotypes).
1. Introduction
In the nineteenth century, the term “metabolomics” was used for the first time and was defined as the quantitative and qualitative analysis of small molecules/metabolites (low molecular weight molecules, <1500 Da) and their patterns in cells. Among the ‘-omics’ sciences, metabolomics (also stated as metabolomics profiling and metabonomics) has been so technologically advanced that it acts as a division of systems biology [1][2]. The high-throughput global analysis of metabolomics profiling has placed it at final step in the -omics cascade. The metabolic profiling technologies can focus on metabolic stability, metabolites structure, target profiling, and associated metabolic pathways. Metabolomics profiling and chemical profiling are able to investigate the mechanical properties of metabolome (full set of metabolites within cells or tissue) in molecular networks and have been routinely applied as tools for clinical therapeutics [3][4].
Metabolomics methods involve a comprehensive analysis of small-molecule metabolites under a given set of conditions. Metabolites serve as direct signatures of metabolic reaction and biochemical activity. The metabolome is the full set of metabolites within a given cell type of tissue or cells. The metabolite concentration is directly connected with phenotypic expression, which acts as a functional endpoint of metabolisms and reflects genetic activity (gene expression) and protein activity (proteome) [5][6]. Representing every chemical reaction, metabolites play the important role of running the metabolic pathways. The applications of metabolomics have continually grown, which has led to refinement of methods for measurement, analysis, and understanding of complex data sets. The specific metabolic pathways can be discovered and can underlie key therapies for liver diseases, gut malfunctions, and avoidance of liver burden.
Metabolomics is a collection of measurements performed on biological samples for quantifying the several metabolites (metabolome) and evaluating fluctuations in metabolite levels [7]. Every single cell is transmitted over four different stages—genomics, transcriptomics, proteomics, and metabolomics (Figure 1). Among them, metabolomics has a particular advantage over other omics technologies. Metabolic target profiling and global metabolic profiling (untargeted metabolomics) have delivered molecular phenotypic variability that acts a therapeutic agent for specific diseases [7][8][9]. However, both targeted and untargeted metabolomics techniques in the metabolite pool play very important roles in heterogeneous cancer evolution. Moreover, both targeted and untargeted profiling can provide a better idea of the cellular conditions and molecular messages for the representation of cellular phenotypes. Additionally, they show wonderful applications in biomarker discovery [10][11].
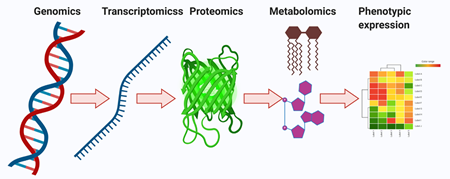
Figure 1. Overview of the central dogma, including fundamentals and design principles for multi-omics profiling in systems biology. The genomics, transcriptomics, proteomics, and metabolomics provide learning about DNA, mRNA, proteins, and metabolites, respectively. The multi-omics profiling in systems biology is influenced via epigenetics, age, diet, lifestyle, drugs, toxins, etc. Bilateral flow of cellular signals is detected between the genome, transcriptome, proteome, and metabolome.
Appropriate analytical tools that allow comprehensive and robust metabolic analysis of various chemical structures is key to understanding the impact of metabolic signatures. Nuclear magnetic resonance (NMR), gas chromatography (GC), liquid chromatography (LC), Fourier transform infrared spectroscopy (FTIR) coupled with mass spectrometry (MS: LC/GC-MS), and capillary electrophoresis (CE-MS) have frequently existed in metabolomics profiling for metabolic stability and structural characterization of metabolome from cells, tissues, plant extracts, gut microbiota, and bacterial samples [12][13]. Analytical applications of NMR, LC/GC-MS, CE-MS, and FTIR were compared to investigate and assess the quality of analysis of given biofluids (Table 1). The dynamic changes in metabolite profile behind NMR spectroscopy and LC/GC-MS analytical technologies are used to generate a spectral profile according to intensities and mass-to-charge (m/z) ratios, respectively, from which can be extracted information that pertains to physiology and latent disease. Each technology has individual applications. However, leading machines of NMR and LC/GC-MS methods provide good quality of metabolomics large datasets [12][14].
The gut microbial community consists of an eco-system with functions in host protection against pathogens, immune modulation, metabolic pathways, and enterohepatic circulation. As the liver is directly connected with the gut through the portal vein, gut-derived toxic factors including bacteria, damaged metabolites (damage-associated molecular patterns), or bacterial products (pathogen-associated molecular patterns) are metabolized in the liver [15]. Some gut microbiota produce ammonia, ethanol, and acetaldehyde, which are mostly metabolized in the liver and are associated with Kupffer cell activation and the inflammatory cytokine pathway [16]. Interest in metabolites is increasing as gut microbiome-related metabolites are a key pathophysiologic factor in liver disease (LD) progression.
Gut bacteria genera might be involved in the fermentation biology of polysaccharides, energy collection, bile acid (BA) synthesis, and choline metabolism in liver cells. Bacterial changes such as Enterobacteria, Bacteroides, Proteobactteria, Faecalibacterium, Ruminococcus, Lactobacillus, and Bifidobacterium have been mirrored in liver metabolites and their metabolic reaction network. Liver cirrhosis is related to bile secretion disorders and metabolic syndrome. Gut microbiota have been involved in the amelioration of liver diseases. In this review, the analysis technology, specific metabolites, and application fields of metabolomics in liver disease are described.
Table 1. Recent analytical research technologies applied to metabolite profiling. The major omics techniques, functionalities benefits, and ability to support to metabolomics/metagenomics analysis.
|
Methods |
Advantages |
Disadvantages |
Ref |
|
Sequencing |
High throughput, massively parallel, amplifying the lowest abundant structures |
Low molecular diversity: nucleic acids only |
|
|
NMR |
Nondestructive method, minimal sample preparation, quantitative analysis, tissue analysis |
Lower sensitivity, low molecular diversity |
[19] |
|
MS (LC/GC) |
Destructive method, capable of depicting volatile compounds, not fully quantitative, target analysis |
Partial molecular diversity, less reproducible |
[12] |
|
CE-MS |
Relatively lower cost than other methods |
- |
|
|
HPLC-MS |
Extensive molecular diversity, robust |
Low sensitivity |
|
|
Raman micro spectroscopy |
3D evidence, high throughput, structural information, nondestructive enabling |
Low sensitivity than MS and NMR |
|
|
Immunochemistry |
Low throughput, high specificity |
Targeted analysis |
NMR, nuclear magnetic resonance; MS, mass spectrometry; CE, capillary electrophoresis; GC, gas chromatography; HPLC: high pressure liquid chromatography; LC, liquid chromatography.
2. Defect Metabolomics and Molecular Phenomics of Liver Diseases
2.1. Overview
Metabolomic profiling and molecular analysis have attempted to characterize the transformation of the liver from a healthy to a diseased state (i.e., fatty liver diseases (FLD), non-alcoholic steatohepatitis (NASH), fibrosis, hepatic steatosis, and cirrhosis). In the liver cellular environment, metabolic transformations take place that may activate or deactivate the molecules. In most cases, liver metabolic changes produce several metabolites that will directly be usable by other organs. Figure 2 shows the frequency of articles published on metabolomics and liver diseases, respectively. This review covers only literature published between 2010 and 2020 (21 September 2020). A schematic diagram of metabolomics profiling (NMR, LC/GC-MS) and metabolic engineering pipeline is displayed in Figure 3.
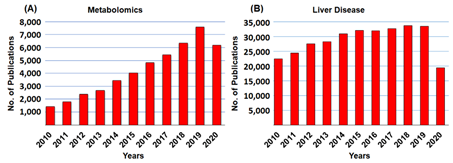
Figure 2. Historical development of publications in (A) metabolomics, and (B) liver diseases. Total sum of scientific publications between 2010 and 2020. The publications of metabolomics and liver diseases grew every year. All the data were accessed on PubMed on 21 September 2020.
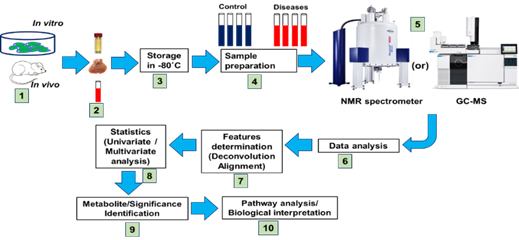
Figure 3. Proposed structure of symmetrical metabolomics experimental design for evaluating storage and quantitative metabolite analysis. Types of sample assessment: sample collections in tubes, data processing, statistics, and metabolic pathway analysis. The robotic high throughput metabolomics technique in liver and gut microbial/organic mixtures reveals their spectral complexity and their metabolic significance.
At the initial stage, over the 5% of fat deposition in liver is called fatty LD and is divided into two phases: alcoholic fatty LD (AFLD) and non-AFLD (NAFLD) [28]. Until now, FLD has not been a serious issue, although FLD is fundamental for NASH, cirrhosis, hepatocellular carcinoma [29][30]. LD covers a large field of diseases, from asymptomatic FLD to NASH and cirrhosis. Basically, fatty liver is formed when more high-fat food, alcohol, and high sugar diets are consumed. Here, every food has a different pathogenic cellular metabolism. In this review, we will focus on the major stages of FLD [31][32].
2.2. Alcoholic Fatty Liver Diseases and Metabolome Phenomics
There are three mainstream high-data content metabolic profiling platforms. Programmed high-throughput metabolomics platforms are used to identify the concentrations of metabolites, organic compounds, their associated spectral data, and their metabolic flexibility. From the recent updates, alcohol-induced fatty liver diseases and their molecular mechanisms are complex and could not be fully studied. According to alcohol dehydrogenase (ADH) level, alcohol metabolites are degraded and form acetaldehyde, which may be toxic to cells [33]. After this, it is metabolized to acetate by aldehyde dehydrogenase. The reduced level of ADH may influence alcohol consumption [34]. For bioactive fatty acid and cholesterol biosynthesis, acetate, acetyl-CoA and acetoacetyl-CoA can be involved, which may lead the fatty liver expansion [35].
A liquor may promote free radicals (i.e., superoxide, O2−; hydroxyl radicals, OH; nitric oxide, NHO; organic radicals, R•; peroxyl radicals, ROO; alkoxy radical, RO; and nitrogen dioxide, NO2) and non-radicals (i.e., hydrogen peroxide, H2O2; singlet oxide, O2; ozone, O3; and peroxynitrile, ONOH−) in liver cellular environments. The growth of reactive oxygen species (ROS) and reactive nitrogen species (RNS) generates oxidative stress. Those radicals of ROS and RNS may affect mitochondrial functions and reduce mitochondrial fat oxidation metabolism, which could give rise to obese fat gathering in liver [36]. The ROS and RNS have a major role in oxidative stress/damage to metabolic stability and biological disturbances that boost lipid toxicity and pro-inflammatory cytokines, pro-inflammatory tumor necrosis factor-a (TNF-a), interleukin (IL)-1, IL-1 beta, IL-6, and IL-8. The characterization and the expression of CXCR1 and CXCR2 receptors of cells act as leading candidate biomarkers in liver inflammations [37][38].
In lipid metabolism, sterol regulatory element-binding protein-1 (SREBP1) and fatty acid synthase (FAS) act as leading regulating factors. The inhibition of SREBP-1 and FAS has been shown to prevent AFLD [39][40]. The activation of peroxisomes proliferation-activated receptor-a (PPAR-a) is done by alcohol exposure and quickens synthesis of fatty acids, resulting in AFLD [41]. Finally, alcohol intake leads to the dysbiosis of the gut and increases intestinal permeability, which may promote lipopolysaccharides (LPS) to the liver. Kupffer cells activation plays an important role in liver inflammation [42]. Alcohol-treated urine and liver metabolites are targeted and quantified by 1H-NMR-based metabolomics examination (Figure 4).
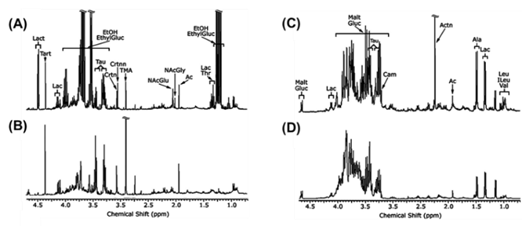
Figure 4. 1H NMR spectrum of (A) mice urine with alcohol treatment; (B) mice urine with control; (C) mice liver with alcohol treatment; (D) mice liver with control. Solution state NMR experiments (400 MHz). The metabolites assignment of 1H NMR spectra data in alcohol-treated mice are annotated. EthylGluc, ethylglucuronide; EtOH, alcohol; Lac, lactate; Ac, acetate; NAcGly, N-acetylglycine; NAcGlu, N-acetylglutamine; TMA, trimethylamine; Crtnn, creatinine; Crtn, creatine; Tau, taurine; Tart, tartrate; Lact, lactose; Malt, maltose; Carn, carnitine; Actn, acetone; Ala, alanine; Leu, Leucine; ILeu, isoleucine; Val, valine. Adapted from reference [43] Copyright at 2008 Elsevier Inc.
2.3. Metabolic Phenome of Non-Alcoholic Fatty Liver Disease
Worldwide, NAFLD is the most common chronic LD and is increasingly found around the world, especially in western nations. The advanced stages of chronic LD deliver hepatic inflammation and fibrosis that is named as NASH. NASH has led to cirrhosis, liver failure, and liver cancer [44][45]. With the help of a major inflammatory component, NASH acts in advanced stages of NAFLD. NAFLD arises when fat deposition builds up in the liver [46]. In the general population, NAFLD may lead to the growth of NASH. As a result, 80% of cases continue as isolated fatty liver with no slight development to advanced scarring (cirrhosis). Over 11% of NASH cases developed cirrhosis within 15 years. Similarly, 7% of hepatocellular carcinoma (HCC) was found after six years, whether via direct mechanisms or cirrhosis [47].
The hepatic inflammation of NASH plays a main role in visceral adipose, which another theory noticed that hepatitis also initiates [46]. High-fat diet applied mice studies have supported this theory [48]. Metabolomics analysis addressing metabolic profiling of NASH and NAFLD in serum/plasma samples has been examined. In NAFLD, several fatty acids and triacylglycerols were upregulated in plasma samples [49][50]. In serum, three phospholipids were significantly altered when a sample of NASH was compared with NAFLD [51].
The advanced metabolomic profiling and chemical profiling of NASH pathogenesis has come from recent investigations that jointly analyzed analytical and molecular targeted gene expression [52]. In current learning, NASH may develop in mice when treated with MCD (methionine and choline deficient diet). Metabolomic profiling analysis by ultra-performance liquid chromatography (UPLC; a combination of a 1.7 μm reverse-phase packing material and a chromatographic system)-ESI-TOFMS has been significantly resulted in a reduction of lysophosphatidylcholine (LPC: 16:0), LPC (18:0), and LPC (18:1) in serum, with significant growth in tauro-β-muricholate, taurocholate, and 12-HETE for MCD fed mice, compared to control diet.
Serum of both galactose-amine (GalN)- and saline-applied ob/ob steatotic mice with an MCD diet has shown the same variations in LPC and BAs. In healthy data, genetic activity modified ob/ob mice with GalN-exposure served as steatosis, which improved severe inflammation and hepatocyte injury. The hepatic mRNA’s coding for TNF-α and TNFβ1 increased their levels. The basic quantification of predefined major metabolome and organic acids in liver metabolisms and gut microbial metabolites are shown in Table 2.
Table 2. Metabolome, organic compounds, and gases in liver metabolisms and microbial fermentation.
|
Metabolome Generated |
Functional Roles |
Compounds |
|
Oligomers (disaccharides, oligosaccharides), organic acids (succinate, lactate), SCFAs (acetate, propionate, butyrate, valerate), BCFAs (iso-butyrate, iso-valerate) |
Sugars, starches, and fibers |
Carbohydrates |
|
SCFAs, BCFAs, biogenic amines, amino acids, phenols, p-Cresols, indoles |
Structure, function, and regulation |
Amino acids/proteins |
|
Gases (CO2, H2S, NH4 and CH4), methanol, ethanol |
Digestion |
Gases |
|
Conjugated fatty acids, acylglycerols, sphingomyelin, cholesterol, phosphatidylcholines, triglyceride, phosphoethanolamines |
Building blocks, structure, function of living cells |
Lipids/fats |
|
Cholate, hyocholate, deoxycholate, taurocholate, chenodeoxycholate, α-muricholate, β-muricholate, ω-muricholate, |
Hormonal actions, metabolic functions |
Bile acids |
|
Biotin, folate, thiamine, riboflavin, pyridoxine, vitamin K, vitamin B12 |
Organic molecule, micronutrient |
Vitamins |
|
Pyrocatechol, hydroxyphenyl-propionic acid, enterodiol etc. |
Micronutrients, plant-based foods |
Polyphenols |
|
N-acetyltryptophan, N-acetyl cysteine, N-acetyl glucosamine |
Antioxidant effects, reduce free radicals |
N-acetyl compounds |
|
Putrescine, cadaverine, spermidine |
Cell proliferation, growing tissue |
Polyamines |
SCFAs, short-chain fatty acids; BCFAs, branched-chain fatty acids; CO2, carbon dioxide; CH4, methane; H2S, hydrogen sulfide; NH4, ammonium.
So far, in serum, BAs and LPC play a role as the best candidate biomarkers for the inflammatory component of NASH, rather than the steatosis section. Collectively, these molecules explain how serum/plasma metabolites are involved in the inflammatory phenotype of NASH in mouse modal outcomes. Related, similar changes have been found in NASH patients, signifying that comparable molecular mechanisms might happen in humans. Lastly, clinical therapeutic biomarkers for NASH are limited, which may be essential in the metabolomics profiling highlighted in this sector.
2.4. Signatures of Liver Fibrosis, Cirrhosis, and Metabolic Phenomics
The summary of metabolomic profiling systems (e.g., NMR, LC/GC-MS, CE-MS, HPLC) from various biofluids and clinical applications of liver fibrosis and cirrhosis is summarized in Table 3. Liver fibrosis acts as a basic stage of liver scarring. It happens by the unnecessary deposition of extracellular matrix proteins, including collagen that arises in the many types of chronic liver diseases (e.g., cirrhosis). Oxidative stress provokes the inflammatory responses and apoptosis involved in cirrhosis [53]. It is very likely that NAFLD/NASH may be responsible for cirrhosis development, because the pathophysiological discovery of NASH in the cirrhotic liver has been inspiring to diagnosis and therapeutic screening [54].
Liver extracts were analyzed by NMR and discussed the enhancement of lactate level, [53] which may deliver an anaerobic metabolism in the fibrotic liver cellular microenvironment. Metabolic phenotype by 1H-NMR spectra at 600 MHz for the skeletal muscle, liver, and serum samples has been characterized from germ-free, pathogen-free, and conventionalized mice [55]. Hepatotoxins provoked fibrosis and cirrhosis and has been confirmed with three different studies in rats. Examining tissues and cellular lipid accumulations under histopathology has demonstrated that thioacetamide in drinking water has settled hepatic fibrosis and cirrhosis in rats.
Table 3. Metabolome and metabolomics profiling with hepatic fibrosis.
|
Platform |
Models |
Analysis |
Metabolome |
Related Pathways |
Ref |
|
|
UHPLC-MS GC-MS |
Plasma |
Box plots, Random forest importance plot |
Aspartate ↑, glutamate ↑, Phenylalanine ↑, tyrosine , 3- (4-hydroxyphenyl)- lactate, kynurenine, isoleucine ↑, leucine ↑, valine ↑, ornithine ↑, |
D-ornithine metabolism; Amino acid metabolism |
[49] |
|
|
HPLC LC-MS |
Plasma |
Heat map |
Linolenic acid ↓, palmitoleic acid ↑, oleic acid ↑ |
Fat digestion and absorption |
[50] |
|
|
UPLC-MS |
Serum |
PCA |
Cholic ↑, deoxycholic ↑, arachidonic acid↓, glutamic acid↓ |
Glycerophospholipid metabolism; choline metabolism |
[51] |
|
|
1H-NMR (1D) |
Liver |
PCA, Loading plots |
Lactate ↑, choline ↑, proline ↑, Glutamine ↑, glutamate ↑, TMA ↓, glycogen ↓, inosine ↓, fumarate ↓ |
Glutamatergic synapse; amino acid metabolism |
[53] |
|
|
GC-MS |
Urine |
PCA, PLS-DA |
Propionate ↓, benzoate ↓, leucine ↓, octanoate ↓, phenol ↓, glycine ↓, indole↓, oleic acid ↓, lysine ↓ |
Fatty acid metabolism; lysine degradation; lysine biosynthesis |
[56] |
|
|
UPLC/ESI-Q-TOF-MS |
Urine |
PCA |
Glycocholate ↑, 2-hydoxybutanoic acid ↓ |
Bile secretion; secondary bile acid biosynthesis |
[57] |
|
|
1H-HR-MAS-NMR (1D, 2D) |
Liver |
PLS-DA, Loading plots |
Phosphocholine ↑, Phosphoethanolamine ↑, glutamate ↑, |
Glycerophospholipid metabolism; |
[58] |
|
|
HPLC-LTQ-MS |
Serum |
OPLS-DA, column plot |
glycolchenodeoxycholic acid ↑, lysophosphatidylcholine ↑ |
- |
[59] |
|
|
1H-NMR (1D) |
Serum |
PCA, PLS-DA |
Acetate ↑, pyruvate ↑, Glutamine ↑, taurine ↑, 2-oxoglutarate, glycerol ↑, tyrosine ↑, phenylalanine ↑, 1-methylhistidine ↑ |
Phenylalanine metabolism, D-Glutamine and D-glutamate metabolism; citrate cycle (TCA cycle); tyrosine metabolism |
[60] |
|
|
1H-NMR (1D) |
Serum |
PCA, OPLS-DA, loading plots |
Isoleucine ↓, valine ↓, phenylalanine ↑, formate ↑, acetate ↑, lysine ↓ |
Valine, leucine, and isoleucine biosynthesis |
[61] |
|
|
GCxGC-TOF-MS |
Serum |
R2 values |
D-alanine ↓, D-proline ↓ |
Arginine and proline metabolism; amino acid metabolism |
[62] |
|
|
1H-NMR (1D) |
Serum |
PCA, loading plots, heat map |
Glucose ↓, lactate ↑, choline ↓, VLDL/LDL ↓, |
Polyunsaturated fatty acid metabolism |
[63] |
|
HPLC, ultra-performance liquid chromatographic; PCA, principal component analysis; NMR, nuclear magnetic resonance; MS, mass spectrometry; OPLS-DA, orthogonal PLS-DA; GC, gas chromatography; HPLC: high pressure liquid chromatography; LC, liquid chromatography; VLDL, very-low-density lipoprotein
Carbon tetrachloride (CCl4) induced fibrosis in treated rats [56][57], and the scientists examined protection by the Chinese medicine xia-yu-xue decoction [56] or scoparone, a drug isolated from medicinal plants [57]. After CCl4 exposure, several metabolite signals were labelled and urinary excretion of certain amino acids and gut flora metabolites (which were mostly reversed by xia-yu-xue decoction) were meaningly reduced [56]. Also, the urinary excretion of glycocholate was increased [58][59]
. Here, hepatic fibrosis provoked in a healthy, rather than fatty rat liver, was linked with slight variations in the urinary metabolome
.
In total, an eight metabolomics profiles and pattern recognition of hepatic cirrhosis was examined on human biofluids: one on feces [64], one on liver biopsies [58], and six on serum [65]. From those examinations, no clear images were found. From serum samples, amplified nonessential amino acids [60], certain D-amino acids [62] and lowered essential amino acids [61][62] strongly suggested that the cirrhotic liver metabolic process had weakened the metabolic capability of both D-amino acids and proteins. Another interesting observation is that downregulated LPCs in the serum of cirrhotic samples found that cirrhosis may happen due to alcohol or hepatitis-B [65]. The molecular mechanisms were projected by Gonzalez and coworkers.
2.5. Hepatocellular Carcinoma and Metabolic Phenotyping
Globally, primary liver cancer is a fatal disease that has affected more than millions of lives. Liver cancer have three main subtypes such as HCC, intrahepatic cholangiocarcinoma, and combined HCC-intrahepatic cholangiocarcinoma. Liver cancer acts as the major important cause of tumor-correlated losses. This may result from various risk factors, mainly viruses and alcohol consumption. In addition to that, NAFLD is the major risk factor that leads to the growth of HCC [66].
Metabolic stability discrimination of healthy control (HC) vs. LD and cirrhosis (CIR) vs. HCC has been performed to discover the variance between the clusters (Figure 5). Partial least squares discriminant analysis (PLS-DA) is a useful tool to extract the metabolic differences in samples. This scaling approach delivers more accuracy that inter- and intra-cluster discrepancies. The validity of the score plot has been evaluated by to cross-validation of results.
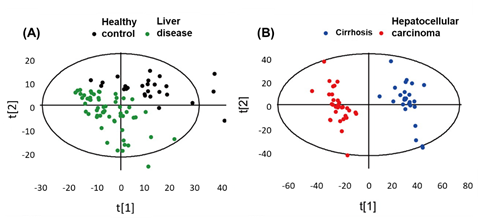
Figure 5. (A,B) Plot of cell metabolic discrimination by supervised PLS-DA analysis. Pattern recognition of healthy control (HC) group and liver disease (LD) groups, which included cirrhosis (CIR) and HCC samples. Adapted with permission from [67], Copyright 2014, American Chemical Society.
Biomarkers’ diverse metabolic features can be used to differentiate normal and anomalous molecular conditions requiring clinical therapeutic intervention via dissecting biomolecules (i.e., DNA, RNA, proteins, metabolites, etc.) [68]. Biomarker generation and disease diagnosis in HCC tumor models by metabolomic profiling is a promising technology [69]. The growth of tumor occurrence and chemical reactions are bonded with several metabolic implications.
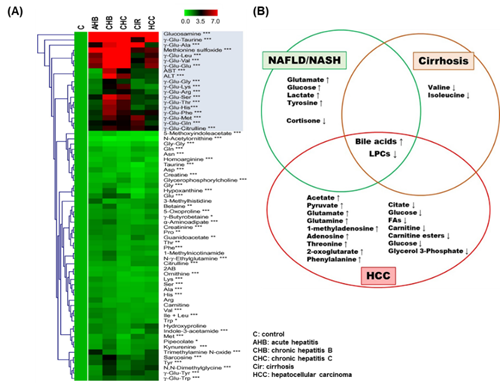
Figure 6. Significant metabolome in liver diseases. (A) 67 metabolites from various types of liver diseases. All rows and columns display the targeted metabolites regulations and liver diseases, respectively. ∗ p < 0.05, ∗∗ p < 0.01, ∗∗∗ p < 0.0001 was calculated. Adapted from references [70], Copyright 2011, European Association for the Study of the Liver. Published by Elsevier Ireland Ltd. (B) The regulation of up- and downregulated metabolites in HCC, cirrhosis, and non-alcoholic fatty liver disease (NAFLD)/non-alcoholic steatohepatitis (NASH) shown in Venn diagram. Adapted with permission from [71], Copyright 2013, European Association for the Study of the Liver. Published by Elsevier B.V.
According to evidence, metabolic modifications are a result of carcinogenesis in cancer cellular microenvironments that may need huge quantity of energy and substrate for lipid synthesis, protein transportation, and metabolic pathway transportation [72]. In HCC, it has been reported that glycolysis in tumor cells is a foundation of substrata for the pentose phosphate pathway for nucleotide synthesis, instead of delivering energy (i.e., adenosine triphosphate, ATP).
The study found that metabolic fluctuations of hypoxia-inducible factors may convert to oxygen poor situations, even in HCC tumor models. Chemical metabolomics profiling found that 4-hydroxyproline looked to be a regulating target in low oxygen survival of wild type cells, while fructose was a modifiable target in HIF (hypoxia inducible factor)- deficient cells [73]. Figure 6A shows the top 67 metabolites from various types of liver diseases and control samples. The most significant metabolites are marked in the red box.
Discovering new biomarker detection in HCC has still been complex because the inhomogeneity of cancer and pathophysiological changes resulting from potential pathogenic factors (i.e., cirrhosis, chronic inflammation, and FLD). HCC is triggered by hapatocytes involving the liver parenchyma; it happens from liver cirrhosis and chronic liver injury in 80% of clinical cases [74]. Increasingly, the root of HCC is chronic liver injury that has leads to hepatocyte regeneration and results in peripheral fibrosis and abnormal structural nodules [75].
Metabolomic profiling by GC-TOF-MS has investigated metabolic discrimination in hepatocellular carcinogenesis with random forest (RF) analysis. Metabolic dysregulation in hepatic tumorigenesis is linked with energy resources metabolisms’ macromolecular synthesis and saves tumor cells from oxidative stress [76]. Metabolic evolution from carbohydrate metabolisms to amino acid and lipid metabolism while the severity of inflammation in cirrhosis rises may happen from various metabolic pathways. Those metabolic reactions and metabolites were summarized. Targeting D-mannitol and D-glucose was found to significantly alter the HCC developmental stages [77]. Serum metabolic profiles from high-risk individuals in HCC revealed new clinical biomarkers with high sensitivity and specificity using multi-omics analysis [78].
As per a previous study, branched chain amino acid (BCAA) acts as a useful biomarker whose imbalances have been associated with the start of HCC. Significant metabolic variations in glutamic acid, citric acid, lactic acid, valine, isoleucine, leucine, alpha tocopherol, cholesterol, and sorbose levels have been reported more in HCC than liver cirrhosis [79]. Examining the metabolic changes with multi-omics platforms in HCC may resolve the pathological mechanisms. Increased levels of metabolites (i.e., 12 and 15-hydroxyeiosatetraenoic acid, xanthine, glycine, serine, aspartate, sphingosine, and acylcarnitines) have been discovered in serum samples of from healthy persons, and HCV patients by GC-MS and UPLC-MS/MS analysis. Furthermore, some of metabolites related to γ-glutamyl oxidative stress indicating anomalous cellular proliferation, neutralization responses, and pathways biosynthesis as well as eicosanoid pathways have been found to occur in the metabolisms of HCC patients [80]. According to NMR- and LC-MS-based techniques, combined with RF analysis, 32 potential biomarkers have been investigated in the serum of HCC patients, liver cirrhosis patients, and healthy volunteers. HCC can be completely detected in patients with a low 20 ng/mL of AFP values.
In Figure 6B, the Venn diagram shows the most discriminating metabolites that are associated with disease evolution (NAFLD/NASH, cirrhosis, HCC) in patients. Metabolite changes such as up- and downregulations in each disease, are marked. The metabolic activity of HCC as well as their use as targeted metabolites in various samples/platforms are detailed in Table 4. Metabolic conflicts raised in ketone biosynthesis, TCA cycle, phospholipid metabolism, sphingolipid metabolism, fatty acid oxidation, amino acid catabolism and BA metabolism in HCC are associated with various cellular molecular metabolisms [81]. An abnormal regulation of lipid metabolism may forecast disease pathology progression to HCC in metabolic syndrome patients .
Table 4. Metabolome and metabolomics profiling in hepatocellular carcinoma.
|
Platform |
Sample |
Analysis |
Metabolites |
Related Pathways |
Ref |
|
|
LC-MS |
Urine |
PLS-DA, Heat map, ROC curve |
Nucleosides, bile acids, citric acid, amino acids, cyclic adenosine monophosphate, glutamine, acylcarnitines |
Purine metabolism, energy metabolism, amino acid metabolism |
[67] |
|
|
GC-TOF-MS |
Serum |
PCA, OPLS-DA, heat map |
Phenylalanine, malic acid, 5-methoxytryptamine, palmitic acid, asparagine, b-glutamate |
Energy metabolism, macromolecular synthesis, oxidative stress |
[76] |
|
|
GC-MS |
Cells |
Heat map, loading plots |
D-mannitol, D-glucose |
Lipid and amino acid metabolism |
[77] |
|
|
LC-MS |
Serum |
PLS-DA, ROC curves |
Xanthine, uric acid, cholyglycine, D-leucic acid, 3-hydroxycapric acid, arachidonyl lysolecithin, dioleoyl phosphatidylcholine |
Purine catabolism lipid metabolism |
[78] |
|
|
GC-MS |
Plasma |
PLS-DA, OPLS-DA |
Glutamic acid, citric acid, lactic acid, valine, isoleucine, leucine, alpha tocopherol, cholesterol, sorbose |
Branched-chain amino acid metabolism |
[79] |
|
|
GC-MS, UPLC-MS-MS |
Serum |
|
12-HETE, 15-HETE, sphingosine, xanthine, amino acids serine, glycine, aspartate, acylcarnitines |
Cell regulation, amino acid biosynthesis, neutralization reaction, eicosanoid |
[80] |
|
|
1H-NMR (1D), LC-MS |
Serum |
PCA, random forests analysis |
Formate, tyrosine, ascorbate, oxaloacetate, carnitine, phenylalanine, C16 sphinganine, lysophosphatidylcholines, phosphatidylcholines |
Ketone biosynthesis, citric acid cycle, phospholipid, fatty acid oxidation, sphingolipid, amino acid/bile acid metabolism |
[81] |
|
|
GC-MS |
Serum Liver tissues |
Gene expression |
Triglycerides, cholesterol, fatty acids |
Lipid metabolism |
[82] |
|
|
LC-MS |
Urine |
PCA, heat map |
Epitestosterone, allotetrahydrocortisol |
Steroid hormonal system, steroid hormone pattern |
[83] |
|
|
LC-MS |
Serum |
Spearman correlation |
Phenylalanine, tyrosine, glutamate, kynurenine, tryptophan, biogenic amines |
Amino acid, biogenic amine metabolism |
[84] |
|
|
13C-NMR, LC-MS/MS |
Tissues |
PCA |
Alanine, succinate, lactate, glycerophosphoethanolamine, inorganic phosphate, leucine, isoleucine, valine |
Aspartate metabolism, tricarboxylic acid metabolism |
[85] |
|
|
LC-MS |
Liver |
Gene expression |
Lysine, phenylalanine, citrulline, creatine, creatinine, inosine, glycodeoxycholic acid, alpha-ketoglutarate, multiple acyl-lyso-phosphatidylcholine |
Krebs cycle, urea cycle, amino acid, purine metabolism |
[86] |
|
|
UHPLC-MS |
Serum |
PCA |
Acylcarnitines, fatty acids, phosphatidyl ethanolamine |
Fatty acid, b-oxidation, phosphatidylcholine, phosphatidyl ethanolamine metabolism |
[87] |
|
|
CE-TOF/MS |
Serum |
PCA, PLS-DA, correlation network |
Creatine, betaine, kynurenine, pipecolic acid |
Fundamental carbon metabolism, glycerolipid digestion, methylation reactions, oxidative stress |
[84] |
|
|
CE-TOF/MS |
Serum |
PLS-DA, ROC curves, V-plot |
Tryptophan, glutamine, and 2-hydroxybutyric acid |
Amino acid metabolism |
||
HPLC, ultra-performance liquid chromatographic; ROC, receiver operating characteristic; PCA, principal component analysis; NMR, nuclear magnetic resonance; MS, mass spectrometry; OPLS-DA, orthogonal PLS-DA; GC, gas chromatography; HPLC: high pressure liquid chromatography; LC, liquid chromatography; CE, capillary electrophoresis; v, volcano
The LC-MS method acts as an excellent diagnostic capability. Metabolomics analysis in steroid hormones, epitestosterone, and allotetrahydrocortisol were altered, which imbalanced the steroid hormone metabolic network and meaningly downregulated urinary steroid hormone levels. Phenylalanine, tyrosine, glutamate, and tryptophane, kynurenine, and biogenic amines were found specifically in amino acids, which may indicate HCC progression [86]. Human biopsy tissues extract examined by NMR and MS metabolomics profiling found that aspartate metabolism leads to vital and differentiable metabolic pathways of HCC [87]. Regulation of Wnt signaling transduction pathways and various disorderly metabolites, including acyl-lysophophatidylcholine connected to HCC, is important to revise the physiological process from NAFLD to HCC [88]. Tryptophane, glutamine, and 2-hydroxybutyric acid act as beneficial biomarkers to recognize the molecular mechanisms of HCC [89].
References
- Oliver, S.G.; Winson, M.K.; Kell, D.B.; Baganz, F. Systematic functional analysis of the yeast genome. Trends Biotechnol. 1998, 16, 373–378, doi:10.1016/s0167-7799(98)01214-1.
- Raja, G.; Jang, Y.K.; Suh, J.S.; Prabhakaran, V.S.; Kim, T.J. Advanced understanding of genetic risk and metabolite signatures in construction workers via cytogenetics and metabolomics analysis. Process Biochem. 2019, 86, 117–126, doi:10.1016/j.procbio.2019.07.016.
- Dunn, W.B.; Broadhurst, D.I.; Atherton, H.J.; Goodacre, R.; Griffin, J.L. Systems level studies of mammalian metabolomes: The roles of mass spectrometry and nuclear magnetic resonance spectroscopy. Chem. Soc. Rev. 2011, 40, 387–426, doi:10.1039/b906712b.
- Larive, C.K.; Barding, G.A., Jr.; Dinges, M.M. NMR spectroscopy for metabolomics and metabolic profiling. Anal. Chem. 2015, 87, 133–146, doi:10.1021/ac504075g.
- Cavill, R.; Keun, H.C.; Holmes, E.; Lindon, J.C.; Nicholson, J.K.; Ebbels, T.M. Genetic algorithms for simultaneous variable and sample selection in metabonomics. Bioinformatics 2009, 25, 112–118, doi:10.1093/bioinformatics/btn586.
- Nicholson, J.K.; Lindon, J.C. Systems biology: Metabonomics. Nature 2008, 455, 1054–1056, doi:10.1038/4551054a.
- Blow, N. Metabolomics: Biochemistry's new look. Nature 2008, 455, 697–700, doi:10.1038/455697a.
- Fessenden, M. Metabolomics: Small molecules, single cells. Nature 2016, 540, 153–155, doi:10.1038/540153a.
- Nordstrom, A.; Lewensohn, R. Metabolomics: Moving to the clinic. J. Neuroimmune Pharmacol. 2010, 5, 4–17, doi:10.1007/s11481-009-9156-4.
- Raja, G.; Jang, Y.K.; Suh, J.S.; Kim, H.S.; Ahn, S.H.; Kim, T.J. Microcellular Environmental Regulation of Silver Nanoparticles in Cancer Therapy: A Critical Review. Cancers (Basel) 2020, 12, 664, doi:10.3390/cancers12030664.
- Raja, G.; Cao, S.; Kim, D.H.; Kim, T.J. Mechanoregulation of titanium dioxide nanoparticles in cancer therapy. Mater. Sci. Eng. C Mater. Biol. Appl. 2020, 107, 110303, doi:10.1016/j.msec.2019.110303.
- Lourenco, C.; Kelly, D.; Cantillon, J.; Cauchi, M.; Yon, M.A.; Bentley, L.; Cox, R.D.; Turner, C. Monitoring type 2 diabetes from volatile faecal metabolome in Cushing's syndrome and single Afmid mouse models via a longitudinal study. Sci. Rep. 2019, 9, 1–13, doi:10.1038/s41598-019-55339-9.
- Robinson, J.I.; Weir, W.H.; Crowley, J.R.; Hink, T.; Reske, K.A.; Kwon, J.H.; Burnham, C.D.; Dubberke, E.R.; Mucha, P.J.; Henderson, J.P. Metabolomic networks connect host-microbiome processes to human Clostridioides difficile infections. J. Clin. Invest. 2019, 129, 3792–3806, doi:10.1172/JCI126905.
- Raja, G.; Kim, S.; Yoon, D.; Yoon, C.; Kim, S. H-1-NMR-based Metabolomics Studies of the Toxicity of Mesoporous Carbon Nanoparticles in Zebrafish (Danio rerio). Bull. Korean Chem. Soc. 2017, 38, 271–277, doi:10.1002/bkcs.11080.
- Miele, L.; Marrone, G.; Lauritano, C.; Cefalo, C.; Gasbarrini, A.; Day, C.; Grieco, A. Gut-liver axis and microbiota in NAFLD: Insight pathophysiology for novel therapeutic target. Curr. Pharm. Des. 2013, 19, 5314–5324.
- Nagata, K.; Suzuki, H.; Sakaguchi, S. Common pathogenic mechanism in development progression of liver injury caused by non-alcoholic or alcoholic steatohepatitis. J. Toxicol. Sci. 2007, 32, 453–468.
- Chen, M.; Guo, W.L.; Li, Q.Y.; Xu, J.X.; Cao, Y.J.; Liu, B.; Yu, X.D.; Rao, P.F.; Ni, L.; Lv, X.C. The protective mechanism of Lactobacillus plantarum FZU3013 against non-alcoholic fatty liver associated with hyperlipidemia in mice fed a high-fat diet. Food Funct. 2020, 11, 3316–3331, doi:10.1039/c9fo03003d.
- Guo, W.L.; Guo, J.B.; Liu, B.Y.; Lu, J.Q.; Chen, M.; Liu, B.; Bai, W.D.; Rao, P.F.; Ni, L.; Lv, X.C. Ganoderic acid A from Ganoderma lucidum ameliorates lipid metabolism and alters gut microbiota composition in hyperlipidemic mice fed a high-fat diet. Food Funct. 2020, 11, 6818–6833, doi:10.1039/d0fo00436g.
- Raja, G.; Kim, S.; Yoon, D.; Yoon, C.; Kim, S. H-1 NMR Based Metabolomics Studies of the Toxicity of Titanium Dioxide Nanoparticles in Zebrafish (Danio rerio). Bull. Korean Chem. Soc. 2018, 39, 33–39, doi:10.1002/bkcs.11336.
- Soga, T.; Ohashi, Y.; Ueno, Y.; Naraoka, H.; Tomita, M.; Nishioka, T. Quantitative metabolome analysis using capillary electrophoresis mass spectrometry. J. Proteome Res. 2003, 2, 488–494, doi:10.1021/pr034020m.
- Zeng, J.; Kuang, H.; Hu, C.; Shi, X.; Yan, M.; Xu, L.; Wang, L.; Xu, C.; Xu, G. Effect of bisphenol A on rat metabolic profiling studied by using capillary electrophoresis time-of-flight mass spectrometry. Environ. Sci Technol. 2013, 47, 7457–7465, doi:10.1021/es400490f.
- Liu, M.; Xie, H.; Ma, Y.; Li, H.; Li, C.; Chen, L.; Jiang, B.; Nian, B.; Guo, T.; Zhang, Z.; et al. High Performance Liquid Chromatography and Metabolomics Analysis of Tannase Metabolism of Gallic Acid and Gallates in Tea Leaves. J. Agric. Food Chem. 2020, 68, 4946–4954, doi:10.1021/acs.jafc.0c00513.
- Nordstrom, A.; O'Maille, G.; Qin, C.; Siuzdak, G. Nonlinear data alignment for UPLC-MS and HPLC-MS based metabolomics: Quantitative analysis of endogenous and exogenous metabolites in human serum. Anal. Chem. 2006, 78, 3289–3295, doi:10.1021/ac060245f.
- Baker, M.J.; Byrne, H.J.; Chalmers, J.; Gardner, P.; Goodacre, R.; Henderson, A.; Kazarian, S.G.; Martin, F.L.; Moger, J.; Stone, N.; et al. Clinical applications of infrared and Raman spectroscopy: State of play and future challenges. Analyst 2018, 143, 1735–1757, doi:10.1039/c7an01871a.
- Noothalapati, H.; Shigeto, S. Exploring metabolic pathways in vivo by a combined approach of mixed stable isotope-labeled Raman microspectroscopy and multivariate curve resolution analysis. Anal. Chem. 2014, 86, 7828–7834, doi:10.1021/ac501735c.
- Kim, M.; Qie, Y.; Park, J.; Kim, C.H. Gut Microbial Metabolites Fuel Host Antibody Responses. Cell Host Microbe 2016, 20, 202–214, doi:10.1016/j.chom.2016.07.001.
- Yano, J.M.; Yu, K.; Donaldson, G.P.; Shastri, G.G.; Ann, P.; Ma, L.; Nagler, C.R.; Ismagilov, R.F.; Mazmanian, S.K.; Hsiao, E.Y. Indigenous bacteria from the gut microbiota regulate host serotonin biosynthesis. Cell 2015, 161, 264–276, doi:10.1016/j.cell.2015.02.047.
- Liu, Q.; Bengmark, S.; Qu, S. The role of hepatic fat accumulation in pathogenesis of non-alcoholic fatty liver disease (NAFLD). Lipids Health Dis. 2010, 9, 1–9, doi:10.1186/1476-511X-9-42.
- Qian, Y.; Fan, J.G. Obesity, fatty liver and liver cancer. Hepatobiliary Pancreat. Dis. Int. 2005, 4, 173–177.
- Targher, G.; Day, C.P.; Bonora, E. Risk of cardiovascular disease in patients with nonalcoholic fatty liver disease. N. Engl. J. Med. 2010, 363, 1341–1350, doi:10.1056/NEJMra0912063.
- Altamirano, J.; Bataller, R. Alcoholic liver disease: Pathogenesis and new targets for therapy. Nat. Rev. Gastroenterol. Hepatol. 2011, 8, 491–501, doi:10.1038/nrgastro.2011.134.
- Hardy, T.; Oakley, F.; Anstee, Q.M.; Day, C.P. Nonalcoholic Fatty Liver Disease: Pathogenesis and Disease Spectrum. Annu. Rev. Pathol. 2016, 11, 451–496, doi:10.1146/annurev-pathol-012615-044224.
- Zakhari, S.; Li, T.K. Determinants of alcohol use and abuse: Impact of quantity and frequency patterns on liver disease. Hepatology 2007, 46, 2032–2039, doi:10.1002/hep.22010.
- Vidal, F.; Perez, J.; Morancho, J.; Pinto, B.; Richart, C. Hepatic alcohol dehydrogenase activity in alcoholic subjects with and without liver disease. Gut 1990, 31, 707–711, doi:10.1136/gut.31.6.707.
- Purohit, V.; Gao, B.; Song, B.J. Molecular mechanisms of alcoholic fatty liver. Alcohol. Clin. Exp. Res. 2009, 33, 191–205, doi:10.1111/j.1530-0277.2008.00827.x.
- Garcia-Ruiz, C.; Fernandez-Checa, J.C. Mitochondrial Oxidative Stress and Antioxidants Balance in Fatty Liver Disease. Hepatol. Commun. 2018, 2, 1425–1439, doi:10.1002/hep4.1271.
- Li, S.; Hong, M.; Tan, H.Y.; Wang, N.; Feng, Y. Insights into the Role and Interdependence of Oxidative Stress and Inflammation in Liver Diseases. Oxid. Med. Cell. Longev. 2016, 2016, doi:10.1155/2016/4234061.
- Szabo, G.; Bala, S. Alcoholic liver disease and the gut-liver axis. World J. Gastroenterol. 2010, 16, 1321–1329, doi:10.3748/wjg.v16.i11.1321.
- Donohue, T.M., Jr. Alcohol-induced steatosis in liver cells. World J. Gastroenterol. 2007, 13, 4974–4978, doi:10.3748/wjg.v13.i37.4974.
- Endo, M.; Masaki, T.; Seike, M.; Yoshimatsu, H. TNF-alpha induces hepatic steatosis in mice by enhancing gene expression of sterol regulatory element binding protein-1c (SREBP-1c). Exp. Biol. Med. (Maywood) 2007, 232, 614–621.
- Yu, S.; Rao, S.; Reddy, J.K. Peroxisome proliferator-activated receptors, fatty acid oxidation, steatohepatitis and hepatocarcinogenesis. Curr. Mol. Med. 2003, 3, 561–572, doi:10.2174/1566524033479537.
- Miller, A.M.; Horiguchi, N.; Jeong, W.I.; Radaeva, S.; Gao, B. Molecular mechanisms of alcoholic liver disease: Innate immunity and cytokines. Alcohol. Clin. Exp. Res. 2011, 35, 787–793, doi:10.1111/j.1530-0277.2010.01399.x.
- Bradford, B.U.; O'Connell, T.M.; Han, J.; Kosyk, O.; Shymonyak, S.; Ross, P.K.; Winnike, J.; Kono, H.; Rusyn, I. Metabolomic profiling of a modified alcohol liquid diet model for liver injury in the mouse uncovers new markers of disease. Toxicol. Appl. Pharmacol. 2008, 232, 236–243, doi:10.1016/j.taap.2008.06.022.
- Michelotti, G.A.; Machado, M.V.; Diehl, A.M. NAFLD, NASH and liver cancer. Nat. Rev. Gastroenterol. Hepatol. 2013, 10, 656–665, doi:10.1038/nrgastro.2013.183.
- Wree, A.; Broderick, L.; Canbay, A.; Hoffman, H.M.; Feldstein, A.E. From NAFLD to NASH to cirrhosis-new insights into disease mechanisms. Nat. Rev. Gastroenterol. Hepatol. 2013, 10, 627–636, doi:10.1038/nrgastro.2013.149.
- Farrell, G.C.; van Rooyen, D.; Gan, L.; Chitturi, S. NASH is an Inflammatory Disorder: Pathogenic, Prognostic and Therapeutic Implications. Gut Liver 2012, 6, 149–171, doi:10.5009/gnl.2012.6.2.149.
- Torres, D.M.; Williams, C.D.; Harrison, S.A. Features, diagnosis, and treatment of nonalcoholic fatty liver disease. Clin. Gastroenterol. Hepatol. 2012, 10, 837–858, doi:10.1016/j.cgh.2012.03.011.
- Stanton, M.C.; Chen, S.C.; Jackson, J.V.; Rojas-Triana, A.; Kinsley, D.; Cui, L.; Fine, J.S.; Greenfeder, S.; Bober, L.A.; Jenh, C.H. Inflammatory Signals shift from adipose to liver during high fat feeding and influence the development of steatohepatitis in mice. J. Inflamm. (Lond) 2011, 8, 8, doi:10.1186/1476-9255-8-8.
- Kalhan, S.C.; Guo, L.; Edmison, J.; Dasarathy, S.; McCullough, A.J.; Hanson, R.W.; Milburn, M. Plasma metabolomic profile in nonalcoholic fatty liver disease. Metabolism 2011, 60, 404–413, doi:10.1016/j.metabol.2010.03.006.
- Puri, P.; Wiest, M.M.; Cheung, O.; Mirshahi, F.; Sargeant, C.; Min, H.K.; Contos, M.J.; Sterling, R.K.; Fuchs, M.; Zhou, H.; et al. The plasma lipidomic signature of nonalcoholic steatohepatitis. Hepatology 2009, 50, 1827–1838, doi:10.1002/hep.23229.
- Barr, J.; Vazquez-Chantada, M.; Alonso, C.; Perez-Cormenzana, M.; Mayo, R.; Galan, A.; Caballeria, J.; Martin-Duce, A.; Tran, A.; Wagner, C.; et al. Liquid chromatography-mass spectrometry-based parallel metabolic profiling of human and mouse model serum reveals putative biomarkers associated with the progression of nonalcoholic fatty liver disease. J. Proteome Res. 2010, 9, 4501–4512, doi:10.1021/pr1002593.
- Tanaka, N.; Matsubara, T.; Krausz, K.W.; Patterson, A.D.; Gonzalez, F.J. Disruption of phospholipid and bile acid homeostasis in mice with nonalcoholic steatohepatitis. Hepatology 2012, 56, 118–129, doi:10.1002/hep.25630.
- Constantinou, M.A.; Theocharis, S.E.; Mikros, E. Application of metabonomics on an experimental model of fibrosis and cirrhosis induced by thioacetamide in rats. Toxicol. Appl. Pharmacol. 2007, 218, 11–19, doi:10.1016/j.taap.2006.10.007.
- Yeh, M.M.; Brunt, E.M. Pathology of nonalcoholic fatty liver disease. Am. J. Clin. Pathol. 2007, 128, 837–847, doi:10.1309/RTPM1PY6YGBL2G2R.
- Jiang, L.; Si, Z.H.; Li, M.H.; Zhao, H.; Fu, Y.H.; Xing, Y.X.; Hong, W.; Ruan, L.Y.; Li, P.M.; Wang, J.S. (1)H NMR-based metabolomics study of liver damage induced by ginkgolic acid (15:1) in mice. J. Pharm. Biomed. Anal. 2017, 136, 44–54, doi:10.1016/j.jpba.2016.12.033.
- Gou, X.; Tao, Q.; Feng, Q.; Peng, J.; Sun, S.; Cao, H.; Zheng, N.; Zhang, Y.; Hu, Y.; Liu, P. Urinary metabonomics characterization of liver fibrosis induced by CCl(4) in rats and intervention effects of Xia Yu Xue Decoction. J. Pharm. Biomed. Anal. 2013, 74, 62–65, doi:10.1016/j.jpba.2012.09.021.
- Zhang, A.; Sun, H.; Dou, S.; Sun, W.; Wu, X.; Wang, P.; Wang, X. Metabolomics study on the hepatoprotective effect of scoparone using ultra-performance liquid chromatography/electrospray ionization quadruple time-of-flight mass spectrometry. Analyst 2013, 138, 353–361, doi:10.1039/c2an36382h.
- Martinez-Granados, B.; Morales, J.M.; Rodrigo, J.M.; Del Olmo, J.; Serra, M.A.; Ferrandez, A.; Celda, B.; Monleon, D. Metabolic profile of chronic liver disease by NMR spectroscopy of human biopsies. Int. J. Mol. Med. 2011, 27, 111–117, doi:10.3892/ijmm.2010.563.
- Du, Z.; Zhang, L.; Liu, S. Application of liquid chromatography-mass spectrometry in the study of metabolic profiling of cirrhosis in different grades. Se Pu 2011, 29, 314–319, doi:10.3724/sp.j.1123.2011.00314.
- Gao, H.; Lu, Q.; Liu, X.; Cong, H.; Zhao, L.; Wang, H.; Lin, D. Application of 1H NMR-based metabonomics in the study of metabolic profiling of human hepatocellular carcinoma and liver cirrhosis. Cancer Sci. 2009, 100, 782–785, doi:10.1111/j.1349-7006.2009.01086.x.
- Qi, S.W.; Tu, Z.G.; Peng, W.J.; Wang, L.X.; Ou-Yang, X.; Cai, A.J.; Dai, Y. (1)H NMR-based serum metabolic profiling in compensated and decompensated cirrhosis. World J. Gastroenterol. 2012, 18, 285–290, doi:10.3748/wjg.v18.i3.285.
- Waldhier, M.C.; Almstetter, M.F.; Nurnberger, N.; Gruber, M.A.; Dettmer, K.; Oefner, P.J. Improved enantiomer resolution and quantification of free D-amino acids in serum and urine by comprehensive two-dimensional gas chromatography-time-of-flight mass spectrometry. J. Chromatogr. A 2011, 1218, 4537–4544, doi:10.1016/j.chroma.2011.05.039.
- Li, H.; Wang, L.; Yan, X.; Liu, Q.; Yu, C.; Wei, H.; Li, Y.; Zhang, X.; He, F.; Jiang, Y. A proton nuclear magnetic resonance metabonomics approach for biomarker discovery in nonalcoholic fatty liver disease. J. Proteome Res. 2011, 10, 2797–2806, doi:10.1021/pr200047c.
- Huang, H.J.; Zhang, A.Y.; Cao, H.C.; Lu, H.F.; Wang, B.H.; Xie, Q.; Xu, W.; Li, L.J. Metabolomic analyses of faeces reveals malabsorption in cirrhotic patients. Dig. Liver Dis. 2013, 45, 677–682, doi:10.1016/j.dld.2013.01.001.
- Lian, J.S.; Liu, W.; Hao, S.R.; Guo, Y.Z.; Huang, H.J.; Chen, D.Y.; Xie, Q.; Pan, X.P.; Xu, W.; Yuan, W.X.; et al. A serum metabonomic study on the difference between alcohol- and HBV-induced liver cirrhosis by ultraperformance liquid chromatography coupled to mass spectrometry plus quadrupole time-of-flight mass spectrometry. Chin. Med. J. (Engl.) 2011, 124, 1367–1373.
- El-Serag, H.B.; Tran, T.; Everhart, J.E. Diabetes increases the risk of chronic liver disease and hepatocellular carcinoma. Gastroenterology 2004, 126, 460–468, doi:10.1053/j.gastro.2003.10.065.
- Shao, Y.; Zhu, B.; Zheng, R.; Zhao, X.; Yin, P.; Lu, X.; Jiao, B.; Xu, G.; Yao, Z. Development of urinary pseudotargeted LC-MS-based metabolomics method and its application in hepatocellular carcinoma biomarker discovery. J. Proteome Res. 2015, 14, 906–916, doi:10.1021/pr500973d.
- Zhang, B.; Finn, R.S. Personalized Clinical Trials in Hepatocellular Carcinoma Based on Biomarker Selection. Liver Cancer 2016, 5, 221–232, doi:10.1159/000367763.
- Song, P.P.; Xia, J.F.; Inagaki, Y.; Hasegawa, K.; Sakamoto, Y.; Kokudo, N.; Tang, W. Controversies regarding and perspectives on clinical utility of biomarkers in hepatocellular carcinoma. World J. Gastroenterol. 2016, 22, 262–274, doi:10.3748/wjg.v22.i1.262.
- Soga, T.; Sugimoto, M.; Honma, M.; Mori, M.; Igarashi, K.; Kashikura, K.; Ikeda, S.; Hirayama, A.; Yamamoto, T.; Yoshida, H.; et al. Serum metabolomics reveals gamma-glutamyl dipeptides as biomarkers for discrimination among different forms of liver disease. J. Hepatol. 2011, 55, 896–905, doi:10.1016/j.jhep.2011.01.031.
- Beyoglu, D.; Idle, J.R. The metabolomic window into hepatobiliary disease. J. Hepatol. 2013, 59, 842–858, doi:10.1016/j.jhep.2013.05.030.
- Minton, D.R.; Fu, L.; Chen, Q.; Robinson, B.D.; Gross, S.S.; Nanus, D.M.; Gudas, L.J. Analyses of the transcriptome and metabolome demonstrate that HIF1alpha mediates altered tumor metabolism in clear cell renal cell carcinoma. PLoS ONE 2015, 10, e0120649, doi:10.1371/journal.pone.0120649.
- Armitage, E.G.; Kotze, H.L.; Allwood, J.W.; Dunn, W.B.; Goodacre, R.; Williams, K.J. Metabolic profiling reveals potential metabolic markers associated with Hypoxia Inducible Factor-mediated signalling in hypoxic cancer cells. Sci. Rep. 2015, 5, 15649, doi:10.1038/srep15649.
- Duseja, A. Staging of hepatocellular carcinoma. J. Clin. Exp. Hepatol. 2014, 4, S74–S79, doi:10.1016/j.jceh.2014.03.045.
- Nakayama, H.; Takayama, T. Management before hepatectomy for hepatocellular carcinoma with cirrhosis. World J. Hepatol. 2015, 7, 2292–2302, doi:10.4254/wjh.v7.i20.2292.
- Gao, R.; Cheng, J.; Fan, C.; Shi, X.; Cao, Y.; Sun, B.; Ding, H.; Hu, C.; Dong, F.; Yan, X. Serum Metabolomics to Identify the Liver Disease-Specific Biomarkers for the Progression of Hepatitis to Hepatocellular Carcinoma. Sci. Rep. 2015, 5, 18175, doi:10.1038/srep18175.
- Peng, B.; Liu, F.; Han, R.; Luo, G.; Cathopoulis, T.; Lu, K.; Li, X.; Yang, L.; Liu, G.Y.; Cai, J.C.; et al. Dynamic metabolic change is indicative of inflammation-induced transformation of hepatic cells. Int. J. Biochem. Cell Biol. 2015, 66, 45–58, doi:10.1016/j.biocel.2015.07.007.
- Bowers, J.; Hughes, E.; Skill, N.; Maluccio, M.; Raftery, D. Detection of hepatocellular carcinoma in hepatitis C patients: Biomarker discovery by LC-MS. J. Chromatogr. B Anal. Technol Biomed. Life Sci. 2014, 966, 154–162, doi:10.1016/j.jchromb.2014.02.043.
- Nezami Ranjbar, M.R.; Luo, Y.; Di Poto, C.; Varghese, R.S.; Ferrarini, A.; Zhang, C.; Sarhan, N.I.; Soliman, H.; Tadesse, M.G.; Ziada, D.H.; et al. GC-MS Based Plasma Metabolomics for Identification of Candidate Biomarkers for Hepatocellular Carcinoma in Egyptian Cohort. PLoS ONE 2015, 10, e0127299, doi:10.1371/journal.pone.0127299.
- Fitian, A.I.; Nelson, D.R.; Liu, C.; Xu, Y.; Ararat, M.; Cabrera, R. Integrated metabolomic profiling of hepatocellular carcinoma in hepatitis C cirrhosis through GC/MS and UPLC/MS-MS. Liver Int. 2014, 34, 1428–1444, doi:10.1111/liv.12541.
- Liu, Y.; Hong, Z.; Tan, G.; Dong, X.; Yang, G.; Zhao, L.; Chen, X.; Zhu, Z.; Lou, Z.; Qian, B.; et al. NMR and LC/MS-based global metabolomics to identify serum biomarkers differentiating hepatocellular carcinoma from liver cirrhosis. Int. J. Cancer 2014, 135, 658–668, doi:10.1002/ijc.28706.
- Teng, C.F.; Hsieh, W.C.; Yang, C.W.; Su, H.M.; Tsai, T.F.; Sung, W.C.; Huang, W.; Su, I.J. A biphasic response pattern of lipid metabolomics in the stage progression of hepatitis B virus X tumorigenesis. Mol. Carcinog. 2016, 55, 105–114, doi:10.1002/mc.22266.
- Dai, W.; Yin, P.; Chen, P.; Kong, H.; Luo, P.; Xu, Z.; Lu, X.; Xu, G. Study of urinary steroid hormone disorders: Difference between hepatocellular carcinoma in early stage and cirrhosis. Anal. Bioanal. Chem. 2014, 406, 4325–4335, doi:10.1007/s00216-014-7843-3.
- Lin, X.; Gao, J.; Zhou, L.; Yin, P.; Xu, G. A modified k-TSP algorithm and its application in LC-MS-based metabolomics study of hepatocellular carcinoma and chronic liver diseases. J. Chromatogr. B Anal. Technol. Biomed. Life Sci. 2014, 966, 100–108, doi:10.1016/j.jchromb.2014.05.044.
- Zeng, J.; Yin, P.; Tan, Y.; Dong, L.; Hu, C.; Huang, Q.; Lu, X.; Wang, H.; Xu, G. Metabolomics study of hepatocellular carcinoma: Discovery and validation of serum potential biomarkers by using capillary electrophoresis-mass spectrometry. J. Proteome Res. 2014, 13, 3420–3431, doi:10.1021/pr500390y.
- Stepien, M.; Duarte-Salles, T.; Fedirko, V.; Floegel, A.; Barupal, D.K.; Rinaldi, S.; Achaintre, D.; Assi, N.; Tjonneland, A.; Overvad, K.; et al. Alteration of amino acid and biogenic amine metabolism in hepatobiliary cancers: Findings from a prospective cohort study. Int. J. Cancer 2016, 138, 348–360, doi:10.1002/ijc.29718.
- Darpolor, M.M.; Basu, S.S.; Worth, A.; Nelson, D.S.; Clarke-Katzenberg, R.H.; Glickson, J.D.; Kaplan, D.E.; Blair, I.A. The aspartate metabolism pathway is differentiable in human hepatocellular carcinoma: Transcriptomics and (13) C-isotope based metabolomics. NMR Biomed. 2014, 27, 381–389, doi:10.1002/nbm.3072.
- Clarke, J.D.; Novak, P.; Lake, A.D.; Shipkova, P.; Aranibar, N.; Robertson, D.; Severson, P.L.; Reily, M.D.; Futscher, B.W.; Lehman-McKeeman, L.D.; et al. Characterization of hepatocellular carcinoma related genes and metabolites in human nonalcoholic fatty liver disease. Dig. Dis. Sci. 2014, 59, 365–374, doi:10.1007/s10620-013-2873-9.
- Zeng, J.; Huang, X.; Zhou, L.; Tan, Y.; Hu, C.; Wang, X.; Niu, J.; Wang, H.; Lin, X.; Yin, P. Metabolomics Identifies Biomarker Pattern for Early Diagnosis of Hepatocellular Carcinoma: From Diethylnitrosamine Treated Rats to Patients. Sci. Rep. 2015, 5, 16101, doi:10.1038/srep16101.

