| Version | Summary | Created by | Modification | Content Size | Created at | Operation |
|---|---|---|---|---|---|---|
| 1 | Wen-Chi Chang | + 1115 word(s) | 1115 | 2020-04-30 09:29:35 | | | |
| 2 | Rita Xu | -336 word(s) | 779 | 2020-05-07 11:59:25 | | | | |
| 3 | Rita Xu | -23 word(s) | 756 | 2020-10-29 06:59:16 | | |
Video Upload Options
Climate change affects global crop production year after year. Authors try to explore the effects of various fertilization regimes with climate variability on yield stability for sweet corn production in southern Taiwan. Three fertilization treatments composed of chemical fertilizer only (CF), integrated fertilizer (half organic/half chemical fertilizer) (IF), and organic fertilizer only (OF) were implemented from 2009 to 2018. While the same amounts of these fertilizers were applied during the period, we found that different fertilization changed the marketable yields of fresh fruit (ear), which slightly increased for organic fertilizer, but substantially decreased for both chemical and integrated fertilizer. Above all, we show for the first time that chemical fertilizer had the lowest yield resilience in response to regional relative humidity change compared to organic and integrated fertilizers. Our results also indicate that specific soil microbes have the potential to help sweet corn face environmental vulnerability in subtropical regions.
1. Sweet Corn Yield
There are five survey items of sweet corn yield. The marketable yield of sweet corn was composed of qualified and unqualified ear yield, which can be further separated as first ear and second ear. Although these yields were not significantly different during the period of 2009–2018, the sources of variation belong to “Years,” and “Treatments × Years” had significantly different yields among treatments (Table 1, Table 2).
Table 1. Comparisons among treatments for fresh marketable yield and components of sweet corn yield and weight #.
| Treatments | Marketable Yield (t ha−1) | Qualified First Ear Yield (kg plot−1) | Qualified Second Ear Yield (kg plot−1) | Average First Ear Weight (g ear−1) | Average Second Ear Weight (g ear−1) |
|---|---|---|---|---|---|
| CF | 13.43 a | 24.20 a | 2.38 a | 302.1 a | 212.2 a |
| IF | 13.56 a | 25.35 a | 2.16 a | 303.4 a | 215.0 a |
| OF | 13.35 a | 24.42 a | 2.01 a | 299.8 a | 211.5 a |
Table 2. Analysis of variance among treatments for fresh marketable yield and components of sweet corn yield and weight #.
| Sources of Variation | Marketable Yield (t ha−1) | Qualified First Ear Yield (kg plot−1) | Qualified Second Ear Yield (kg plot−1) | Average First Ear Weight (g ear−1) | Average Second Ear Weight (g ear−1) |
|---|---|---|---|---|---|
| Treatments (T) | ns | ns | ns | ns | ns |
| Years (Y) | *** | *** | *** | *** | *** |
| T × Y | *** | *** | *** | *** | *** |
A further comparison of yield trends on scatter plot among treatments was displayed in Figure 1. The marketable yield trends of three fertilization treatments had different distribution patterns; the trend of marketable yield was significantly decreased under CF (p = 0.0001) and IF (p = 0.0061), but slightly increased under OF.

Figure 1. The marketable yield trends of CF, IF, and OF treatments from 2009 to 2018. Solid lines represent best fit of linear regression trends among sampling observations (blue circles), shadow represents 95% confidence limits and both upward and downward dotted lines mean 95% prediction boundary. The red circle represents lowest yield observed in CF during the period of 2009–2018.
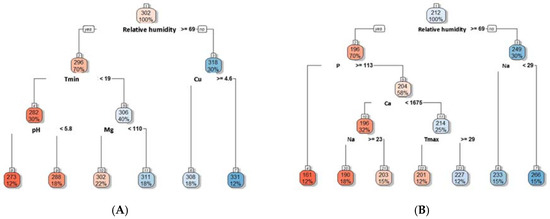
Furthermore, to confirm the effect of these factors on the yield, regression tree analysis was performed. Interestingly, the outcome also shows the major importance of relative humidity: 70% of the yield is produced under the relative humidity above 69% and the average yield is far lower than the average yield under relative humidity below 69% (30% of the yield). This is the case for both average weights of the first ear and second ear, under the CF treatment (Figure 2).

Figure 2. The average weight of first ear (A) and second ear (B) was affected by relative humidity under chemical fertilizer treatment via regression tree analysis.
Therefore, these results are similar to our previous ones, i.e., increase of relative humidity had a negative impact on the average ear weight of CF. Regression tree analysis also shows that, with the relative humidity below 69% and the soil Cu below 4.6 mg kg−1, the average yield for the first ear reaches high average weight of 331 g (Figure 2A). With the relative humidity below 69% and the soil Na above 29 mg kg−1, the average yield for the second ear reaches high average weight of 266 g (Figure 2B). This indicates that there are interaction effects of the climate parameters and soil properties with the average yields under CF. The maize yield is more sensitive to climate change under long-term chemical fertilizer treatment, because Southeast Asia and Taiwan have a tropical/subtropical monsoon climate with frequent typhoons and storms. CF and IF treatments gave higher yield values in 2009–2012 with climate anomalies (2013 with heavy precipitations), but the OF treatment was more sustainable in the 2009–2018 period. Through the regression tree analysis, we can find the most important variables of the climate parameters and soil properties which will promote or reduce the sweet corn average yield. Furthermore, the critical interactions of the climate parameters and soil properties to sweet corn average yield are also identified.


