 +1 credit
| Version | Summary | Created by | Modification | Content Size | Created at | Operation |
|---|---|---|---|---|---|---|
| 1 | Plácido Francisco Lizancos Vidal | + 1039 word(s) | 1039 | 2020-04-24 10:31:21 | | | |
| 2 | Plácido Francisco Lizancos Vidal | + 35 word(s) | 1074 | 2020-04-29 09:10:45 | | | | |
| 3 | Joaquim de Moura | Meta information modification | 1074 | 2020-04-29 18:13:35 | | | | |
| 4 | Joaquim de Moura | + 61 word(s) | 1135 | 2020-04-29 18:28:26 | | | | |
| 5 | Joaquim de Moura | + 61 word(s) | 1135 | 2020-04-29 18:29:27 | | | | |
| 6 | Joaquim de Moura | + 61 word(s) | 1135 | 2020-04-29 18:35:40 | | | | |
| 7 | Joaquim de Moura | + 61 word(s) | 1135 | 2020-04-29 18:48:27 | | | | |
| 8 | Plácido Francisco Lizancos Vidal | Meta information modification | 1135 | 2020-04-30 21:23:27 | | | | |
| 9 | Plácido Francisco Lizancos Vidal | + 2 word(s) | 1137 | 2020-04-30 21:29:35 | | | | |
| 10 | Camila Xu | -62 word(s) | 1075 | 2020-10-30 10:35:29 | | | | |
| 11 | Camila Xu | -108 word(s) | 1029 | 2020-10-30 10:38:19 | | |
Video Upload Options
The accumulation of fluids in the retinal layers is one of the main causes of blindness in developed countries. The main strategy for its study and diagnosis is through the use of Optical Coherence Tomography (OCT) images. This allows experts to observe the layers of the retina in a cross-sectional view. Commonly, for the analysis of these accumulations by means of computer diagnostic support systems, precise segmentation strategies are employed.
1. Introduction
The retina represents the neurosensory layer of the eye. It is the area of the eye in which light is transformed into nerve impulses. Furthermore, it represents one of the most studied parts of the human body thanks to its ease of access and the fact that many pathologies leave their trace on it (such as Parkinson's disease [1][2], multiple sclerosis [3], Alzheimer's disease [4][5], hypertension [6][7], etc.).
Among the most significant damages to the structures of the retina we can find those caused by pathologies such as Age-Related Macular Degeneration (AMD) and diabetes (which leads to Diabetic Retinopathy or DR). These pathologies affect the fragile capillaries that nourish the retina, and when this vascular system is damaged or altered, fluid loss is a common outcome. These progressive accumulations gradually alter the delicate morphology of the retinal layers. If these accumulations of fluid are not detected in time, they will lead to severe vision impairment. These fluid accumulations are so prevalent that they represent one of the main causes of blindness in developed countries [8][9][10][11].
For the diagnosis of these accumulations, experts study the presence of abnormal artifacts in images extracted by Optical Coherence Tomography or OCT [12][13][14]. This medical imaging modality is capable of generating cross-sectional images of the retina, allowing the morphology of its layers to be studied. To do this, the OCT device sends a beam of low coherence light to the retina, which is reflected, refracted and absorbed by the retinal tissues. The device subsequently compares a reference beam with the light received from the retina, studying the differences to generate the final image [15][16]. An example of both a healthy retina and a retina with severe fluid accumulations can be seen in Figure 1.
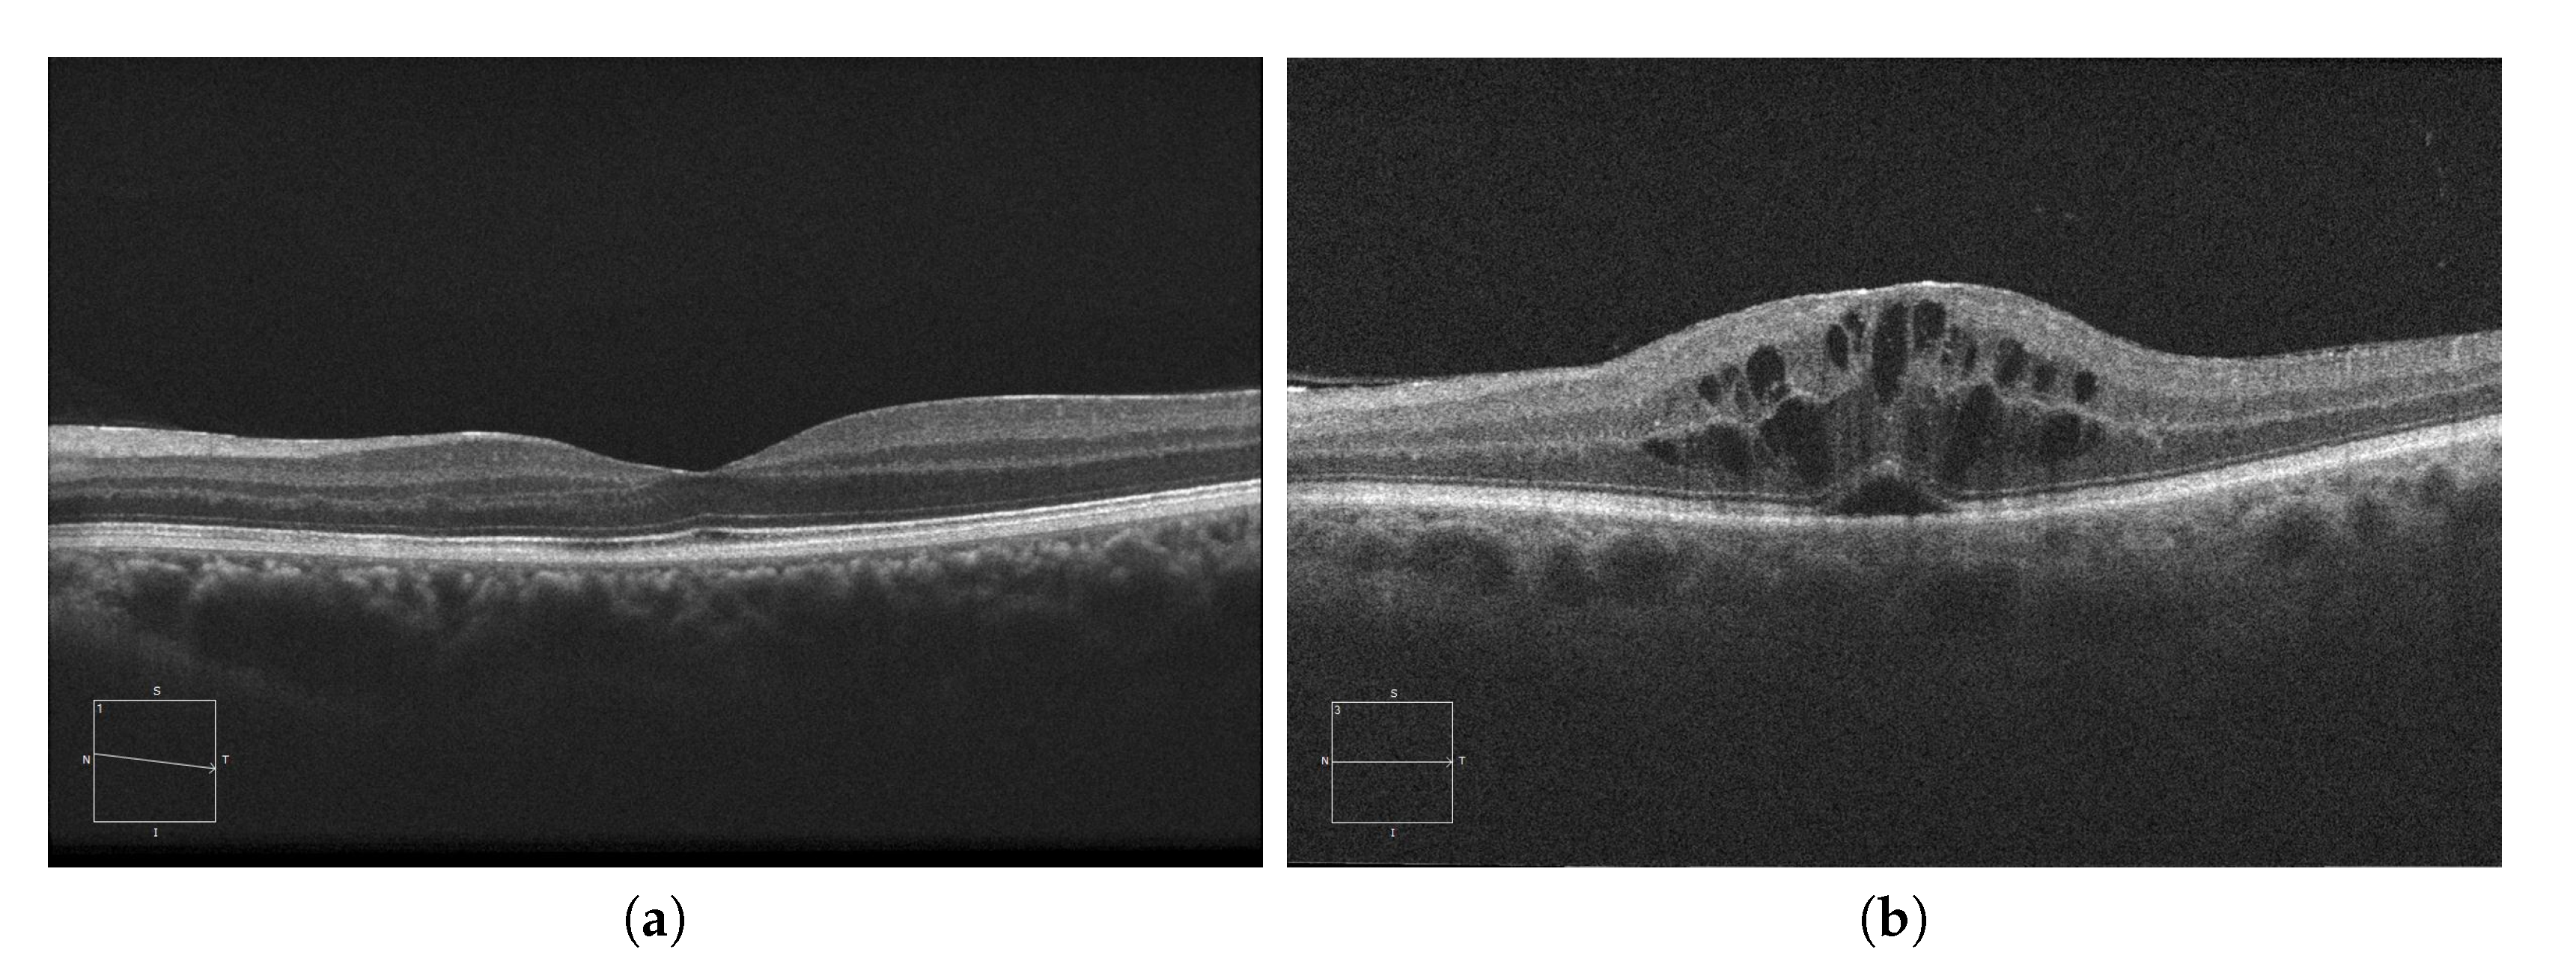
Figure 1. Macular Optical Coherence Tomography (OCT) images. (a) OCT without the presence of cystoid regions. (b) OCT with the presence of cystoid regions.
In the rise of computer aided diagnosis (CAD), several methodologies have been designed based on classical segmentation to extract a mask containing these fluid accumulations [17][18][19][20]. However, due to the nature of cysts (often mixed with healthy tissue, capture device artifacts, and other pathologies), this approach is not always appropriate. As shown in Figure 2, 1st row, some of the fluid accumulations may have high contrast, defined borders but, in the majority of fluid accumulations, what clinicians observe is what is shown in Figure 2, 2nd row: diffuse, low-contrast fluid accumulations. This is why the study for the characterization of intraretinal fluids appeared [21].
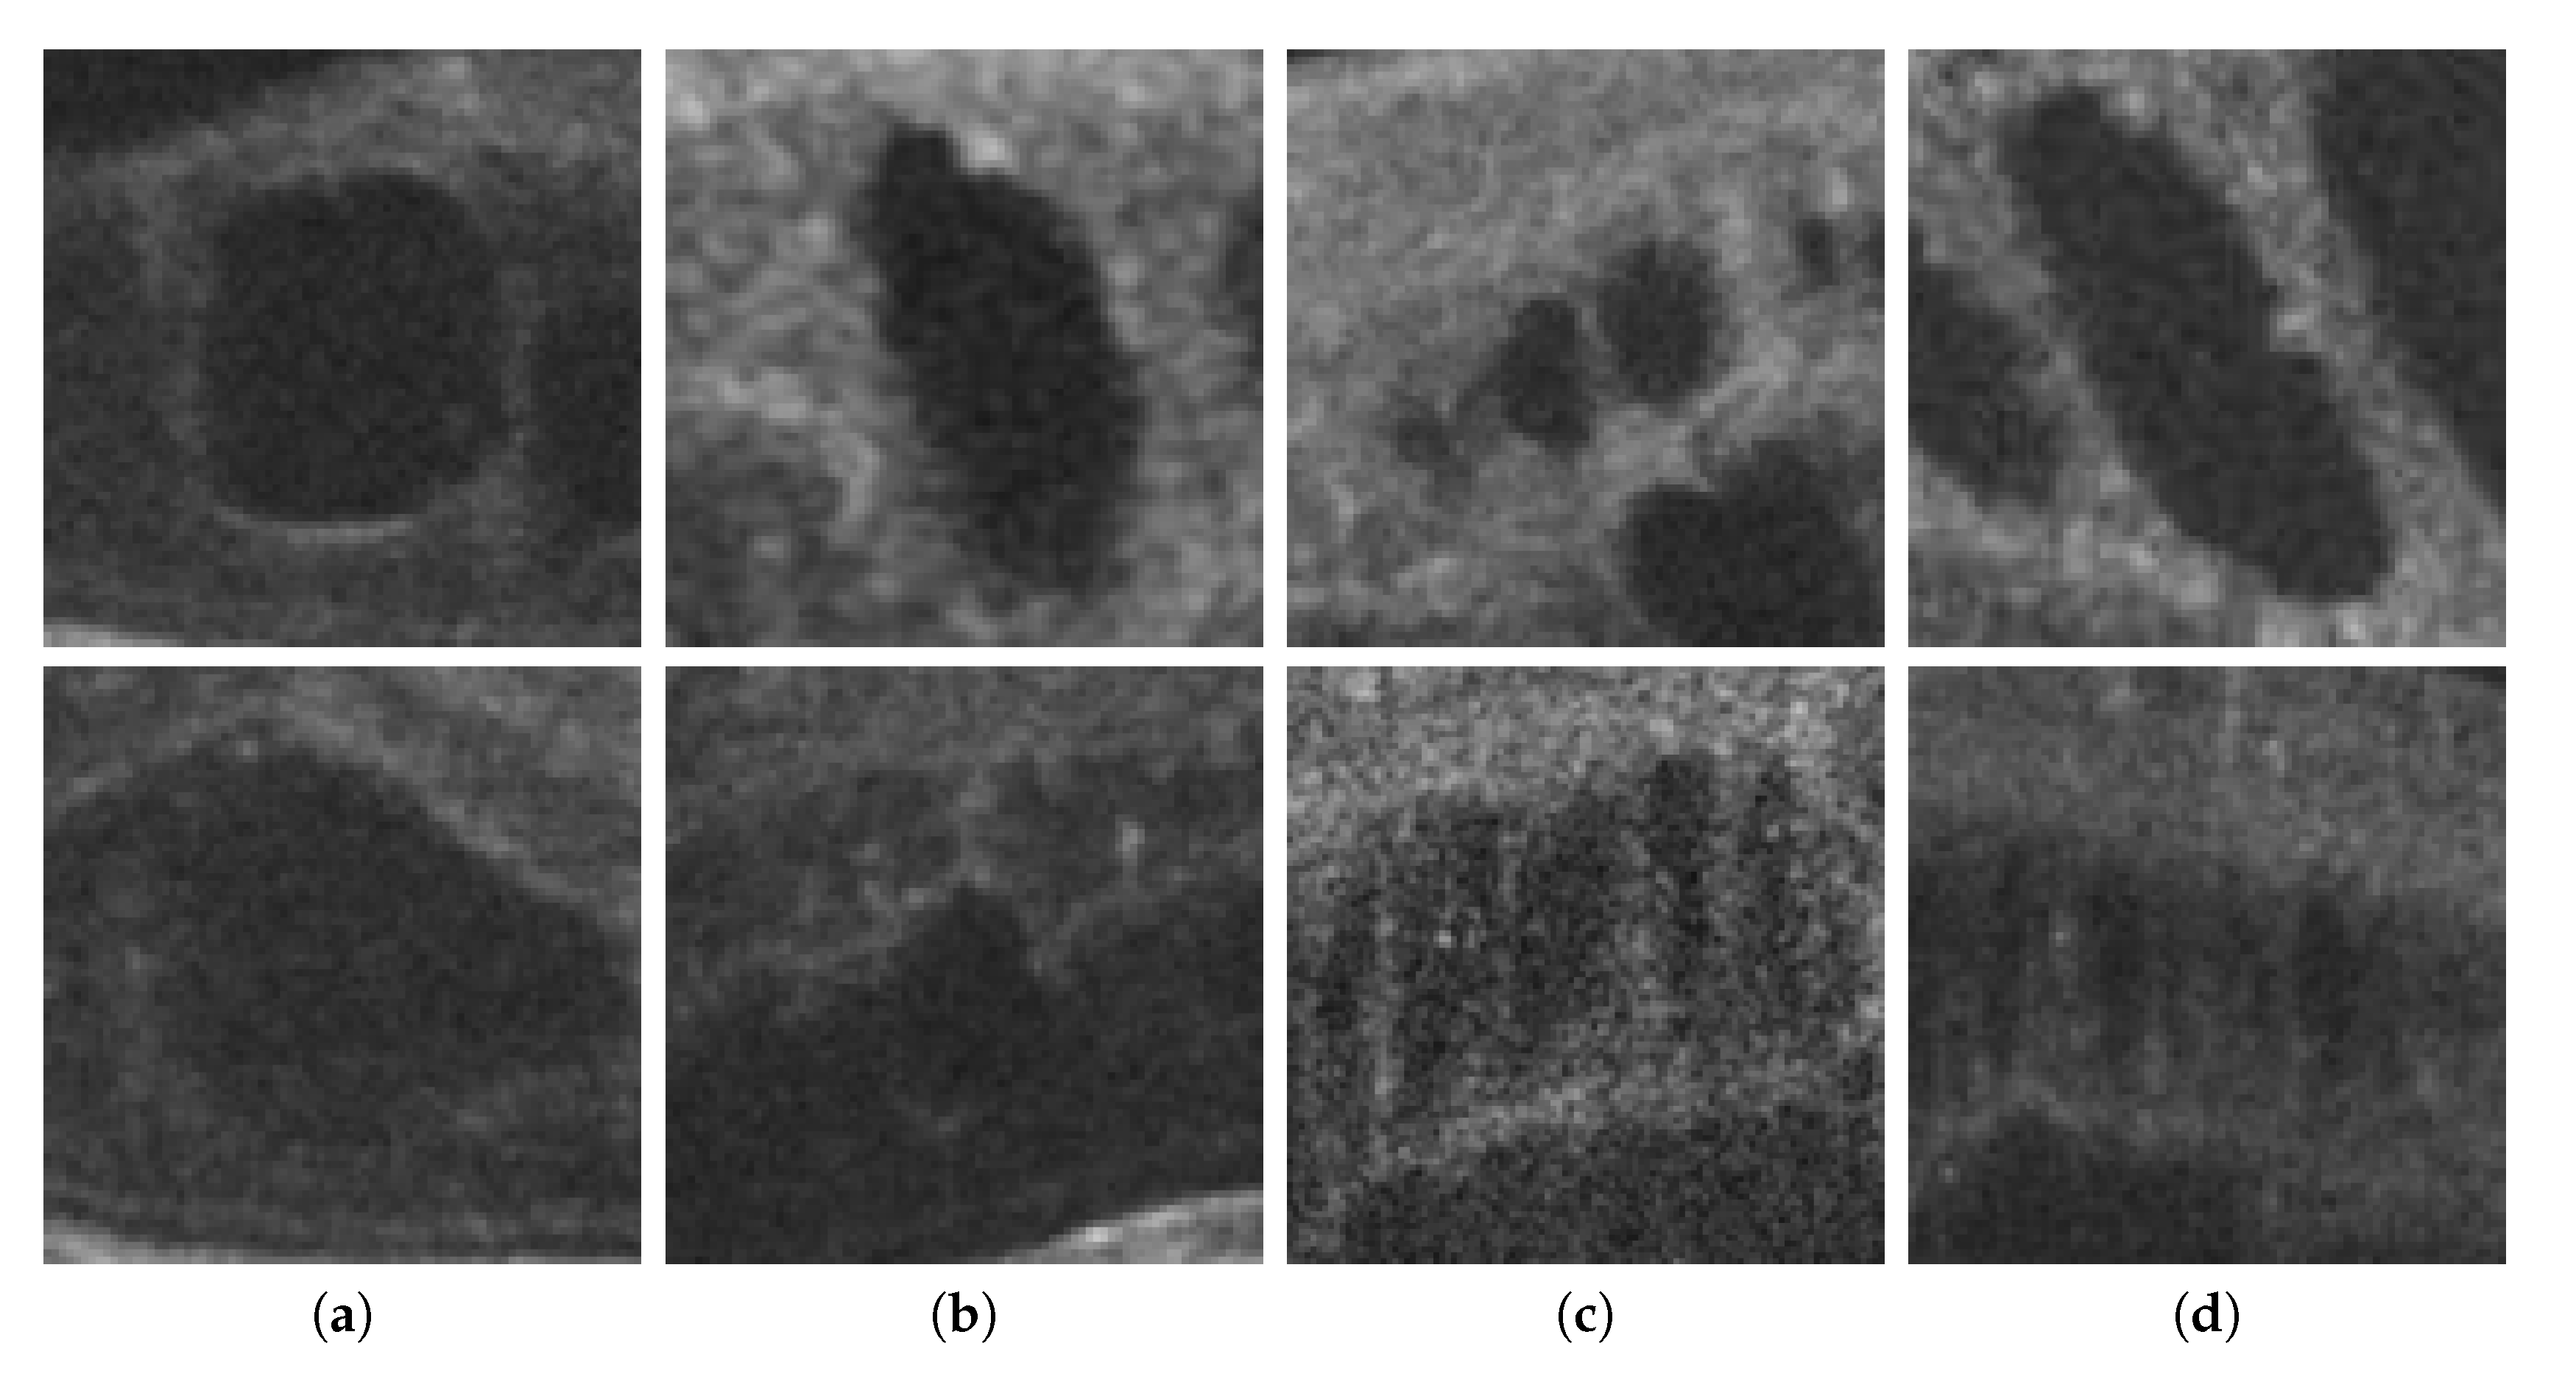
Figure 2. Examples with accumulations of intraretinal fluid with adequate definition for a segmentation (1st row) and counter-examples with blurred, merged, and obfuscated edges that are hard to segment precisely (2nd row). (a,b) Individual cystoid fluid bodies. (c,d) Groups of fluid accumulations.
2. Sample characterization
Instead of looking for a precise segmentation, this strategy analyzes a vector of different characteristics to determine whether a region (or independent sample) of the image corresponds to a region with or without intraretinal fluid. In this way, what we are learning are the main features that identify the regions with fluid: an intraretinal fluid characterization [21][22].
To characterize these regions, a complete library of characteristics is used to analyze different points of view from the same sample. These characteristics study different aspects of the statistical distribution of the gray levels of the image, the spatial patterns formed by them (texture) and the self-similarity or symmetry of the samples. Regarding statistical distribution, values like the minimum, mean, median, standard deviation, skewness, entropy and kurtosis of the gray level histogram are commonly used. On the other hand, when considering the texture analysis of the regions, the Gray-Level Co-Ocurrence Matrix, Histogram of Oriented Gradients and the Gabor filters are among the most successful descriptors (mainly thanks to studying the gradient orientations, as fluid accumulations usually present a cystoid spherical shape while normal retinal structures present more horizontal patterns) [21][22][23].
Once we have defined the feature library, what we do is to create a dataset with defined size samples extracted from OCT images. These small-sized samples correspond to different regions of the OCT images (such as those seen in Figure 2), both from pathological samples and from healthy regions. These samples are labeled by experts and, from each one of them, the complete vector of characteristics defined in the library is extracted [21].
Finally, with this dataset of vectors describing the samples under different points of view and domains, a feature relevance study is performed with different feature selection strategies. Doing so, we obtain a reduced set of characteristics that tell us which aspects define a sample with intraretinal fluid accumulations from a normal retinal region.
3. Applications
With these characteristics, we can generate a vector from each sample that characterizes the most defining features of the fluid accumulations. Thanks to this, it is possible to train a classifier to be able to identify the different independent samples of the image into pathological or non-pathological.
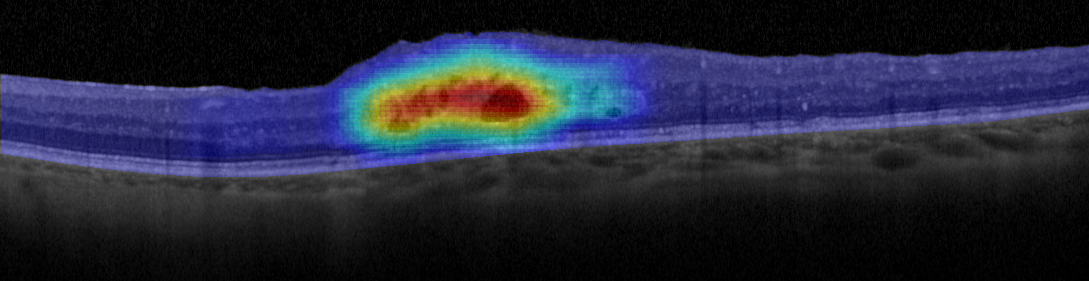
Figure 3. Example of heat map generated using this fluid region characterization and a voting strategy.
If this trained model is combined with an exhaustive image sampling strategy (so that the retina is completely analyzed by the algorithm) we can obtain a representation of the fluid regions that is resilient to all the factors mentioned in the introduction, in addition to accurately representing the location and density of the intraretinal fluid accumulations [23]. Figure 3 shows an example of a heat map generated using this strategy, representing with a cold-to-hot color scale the confidence of the system on the presence of fluid accumulations. Furthermore, this strategy can be extended to a more in-deep classification and characterization of the different types of fluid accumulations [24] or even with deep learning techniques that are able to generate their own feature library [25].
References
- Jeeyun Ahn; Jee-Young Lee; Tae Wan Kim; Eun Jin Yoon; Sohee Oh; Yu Kyeong Kim; Jong-Min Kim; Se Joon Woo; Ki Woong Kim; Beomseok Jeon; et al. Retinal thinning associates with nigral dopaminergic loss in de novo Parkinson disease. Neurology 2018, 91, e1003-e1012, 10.1212/wnl.0000000000006157.
- Marilita M. Moschos; Irini P. Chatziralli; Evaluation of Choroidal and Retinal Thickness Changes in Parkinson’s Disease Using Spectral Domain Optical Coherence Tomography. Seminars in Ophthalmology 2017, 33, 494-497, 10.1080/08820538.2017.1307423.
- Carol Cheung; Yi Ting Ong; Mohammad Kamran Ikram; Shin Yeu Ong; Xiang Li; Saima Hilal; Joseree-Ann S. Catindig; Narayanaswamy Venketasubramanian; Philip Yap; Dennis Seow; et al.Christopher P. ChenTien Yin Wong Microvascular network alterations in the retina of patients with Alzheimer's disease. Alzheimer's & Dementia 2014, 10, 135-142, 10.1016/j.jalz.2013.06.009.
- Ricardo Alonso; Dolores González-Morón; Orlando Garcea; Optical coherence tomography as a biomarker of neurodegeneration in multiple sclerosis: A review. Multiple Sclerosis and Related Disorders 2018, 22, 77-82, 10.1016/j.msard.2018.03.007.
- Marilita M. Moschos; Ioannis Markopoulos; Irini Chatziralli; Alexandros Rouvas; Sokratis Papageorgiou; Ioannis Ladas; Dimitrios Vassilopoulos; Structural and functional impairment of the retina and optic nerve in Alzheimer's disease. Current Alzheimer Research 2012, 9, 782-788, 10.2174/156720512802455340.
- Alun D. Hughes; Elena Martinez-Perez; Abu-Sufian Jabbar; Assif Hassan; Nick W Witt; Paresh D Mistry; Neil Chapman; Alice Stanton; Gareth Beevers; Roberto Pedrinelli; et al.K. H. ParkerSimon A McG Thom Quantification of topological changes in retinal vascular architecture in essential and malignant hypertension. Journal of Hypertension 2006, 24, 889-894, 10.1097/01.hjh.0000222759.61735.98.
- Balvinder Wasan; Alessia Cerutti; Susan Ford; Ronald Marsh; Vascular network changes in the retina with age and hypertension. Journal of Hypertension 1995, 13, 1724, 10.1097/00004872-199512010-00039.
- Johanna M. Colijn et al.; Prevalence of Age-Related Macular Degeneration in Europe. Ophthalmology 2017, 124, 1753-1763, 10.1016/j.ophtha.2017.05.035.
- Jeany Q Li; Thomas Welchowski; Matthias Schmid; Matthias Marten Mauschitz; Frank G Holz; Robert P. Finger; Prevalence and incidence of age-related macular degeneration in Europe: a systematic review and meta-analysis. British Journal of Ophthalmology 2019, 104 , 449-450 , 10.1136/bjophthalmol-2019-314422.
- Riccardo Cheloni; Stefano A Gandolfi; Carlo Signorelli; Anna Odone; Global prevalence of diabetic retinopathy: protocol for a systematic review and meta-analysis. BMJ Open 2019, 9, e022188, 10.1136/bmjopen-2018-022188.
- The Eye Diseases Prevalence Research Group; The Prevalence of Diabetic Retinopathy Among Adults in the United States. Archives of Ophthalmology 2004, 122, 552, 10.1001/archopht.122.4.552.
- Gabriela Samagaio; Joaquim De Moura; Jorge Novo; Marcos Ortega; Optical Coherence Tomography Denoising by Means of a Fourier Butterworth Filter-Based Approach. Lecture Notes in Computer Science 2017, 10485, 422-432, 10.1007/978-3-319-68548-9_39.
- David Huang; Eric A. Swanson; Charles P. Lin; Joel S. Schuman; William G. Stinson; Warren Chang; Michael R. Hee; Thomas Flotte; Kenton Gregory; Carmen A. Puliafito; et al.Al. EtJames G. Fujimoto Optical coherence tomography. Science 1991, 254, 1178-1181, 10.1126/science.1957169.
- J.M. Schmitt; Optical coherence tomography (OCT): a review. IEEE Journal of Selected Topics in Quantum Electronics 1999, 5, 1205-1215, 10.1109/2944.796348.
- Sergio Baamonde; Joaquim De Moura; Jorge Novo; Marcos Ortega; Automatic Detection of Epiretinal Membrane in OCT Images by Means of Local Luminosity Patterns. Advances in Computational Intelligence. IWANN 2017. Lecture Notes in Computer Science 2017, 10305, 222-235, 10.1007/978-3-319-59153-7_20.
- Sergio Baamonde; Joaquim De Moura; Jorge Novo; José Rouco; Marcos Ortega; Feature Definition and Selection for Epiretinal Membrane Characterization in Optical Coherence Tomography Images. Lecture Notes in Computer Science 2017, 10485, 456-466, 10.1007/978-3-319-68548-9_42.
- Freerk G. Venhuizen; Bram Van Ginneken; Bart Liefers; Freekje Van Asten; Vivian Schreur; Sascha Fauser; Carel Hoyng; Thomas Theelen; Clara I. Sanchez; Deep learning approach for the detection and quantification of intraretinal cystoid fluid in multivendor optical coherence tomography. Biomedical Optics Express 2018, 9, 1545-1569, 10.1364/boe.9.001545.
- ZaiLiang Chen; Dabao Li; Hailan Shen; Hailan Mo; Ziyang Zeng; Hao Wei; Automated segmentation of fluid regions in optical coherence tomography B-scan images of age-related macular degeneration. Optics & Laser Technology 2020, 122, 105830, 10.1016/j.optlastec.2019.105830.
- Gary Wilkins; Odette M. Houghton; Amy L. Oldenburg; Automated Segmentation of Intraretinal Cystoid Fluid in Optical Coherence Tomography. Detecting pulse wave from unstable facial videos recorded from consumer-level cameras: a disturbance-adaptive orthogonal matching pursuit 2012, 59, 1109-1114, 10.1109/TBME.2012.2184759.
- Mahdad Esmaeili; Alireza Mehri Dehnavi; Hossein Rabbani; Fedra Hajizadeh; Three-dimensional Segmentation of Retinal Cysts from Spectral-domain Optical Coherence Tomography Images by the Use of Three-dimensional Curvelet Based K-SVD. Journal of Medical Signals & Sensors 2016, 6, 166-171.
- Joaquim De Moura; Plácido L. Vidal; Jorge Novo; José Rouco; Marcos Ortega; Feature definition, analysis and selection for cystoid region characterization in Optical Coherence Tomography. Procedia Computer Science 2017, 112, 1369-1377, 10.1016/j.procs.2017.08.043.
- Joaquim De Moura; Plácido L. Vidal; Jorge Novo; José Rouco; Manuel G. Penedo; Marcos Ortega; Intraretinal Fluid Pattern Characterization in Optical Coherence Tomography Images. Sensors 2020, 20, 2004, 10.3390/s20072004.
- Plácido L. Vidal; Joaquim De Moura; Jorge Novo; Manuel G. Penedo; Marcos Ortega; Intraretinal fluid identification via enhanced maps using optical coherence tomography images. Biomedical Optics Express 2018, 9, 4730-4754, 10.1364/boe.9.004730.
- Iago Otero; Plácido L. Vidal; Joaquim de Moura; Jorge Novo; Marcos Ortega; Computerized tool for identification and enhanced visualization of Macular Edema regions using OCT scans. ESANN 2019
- Plácido L. Vidal; Joaquim De Moura; Jorge Novo; Marcos Ortega; Cystoid Fluid Color Map Generation in Optical Coherence Tomography Images Using a Densely Connected Convolutional Neural Network. 2019 International Joint Conference on Neural Networks (IJCNN) 2019, 1, 1-8, 10.1109/ijcnn.2019.8852208.

