| Version | Summary | Created by | Modification | Content Size | Created at | Operation |
|---|---|---|---|---|---|---|
| 1 | Miriana d'Alessandro | + 2009 word(s) | 2009 | 2021-02-04 04:21:55 | | | |
| 2 | Rita Xu | -474 word(s) | 1535 | 2021-02-04 10:46:14 | | |
Video Upload Options
This paper is a review of the literature on the clinical role of oncomarkers in idiopathic pulmonary fibrosis (IPF) progression, and a description of the routine oncomarker trend in IPF patients over the longest follow-up yet reported. This is the first meta-analysis to review the results of studies evaluating the predictive prognostic value of circulating oncomarkers (CEA, Ca15.3, Ca19.9, Ca125, and KL-6) for IPF. The study focused on the discovery of multiple biomarker signatures, such as combinations of oncomarkers, that are widely and routinely available in biochemistry laboratories.
The combination of clinical parameters and biological markers could help achieve more accurate results regarding prognosis and response to treatment in IPF. Our results could pave the way for a more “personalized” medical approach to patients affected by IPF.
1. Introduction
Idiopathic pulmonary fibrosis (IPF) is a chronic, progressive, fibrosing interstitial pneumonia of unknown cause, occurring primarily in older adults, and limited to the lungs [1]. Recent meta-analyses have shown close associations between the development of IPF and lung cancer [2][3][4]. Both usually affect the periphery of lower lung lobes, sharing common risk factors (e.g., smoking, environmental or occupational exposure, viral infections, and chronic tissue injury) and pathogenic mechanisms, such as epigenetic and genetic alterations, abnormal expression of microRNAs, cell and molecular aberrations (e.g., altered responses to regulatory signals, delayed apoptosis, and reduced cell-to-cell communication), and activation of specific signal transduction pathways [5]. In the PROFILE (prospective observation of fibrosis in the lung clinical endpoints) study, some of these oncomarkers, especially Ca19.9 and Ca125, were associated with increased mortality [6]. Very recently Balestro et al. corroborated the prognostic value of Ca19.9 in end-stage IPF [7]. Although several authors have reported high concentrations of common oncomarkers, including carcinoembryonic antigen (CEA) [8], cancer antigen 19.9 (Ca19.9) [9], 15.3 (Ca15.3) [10], 125 (Ca125) [8], and Krebs von den Lungen-6 (KL-6) [11][12][13][14], in IPF, little data is available on the prognostic role of all these markers, taken together, and their interactions, in IPF progression [9][15].
2. Meta-Analysis Results
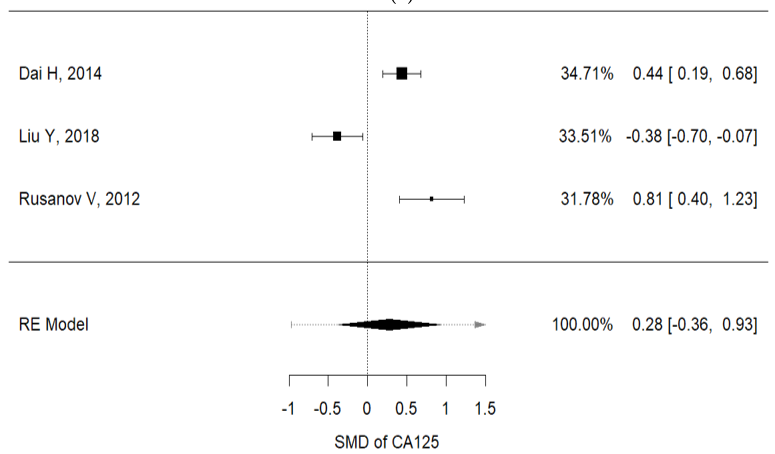
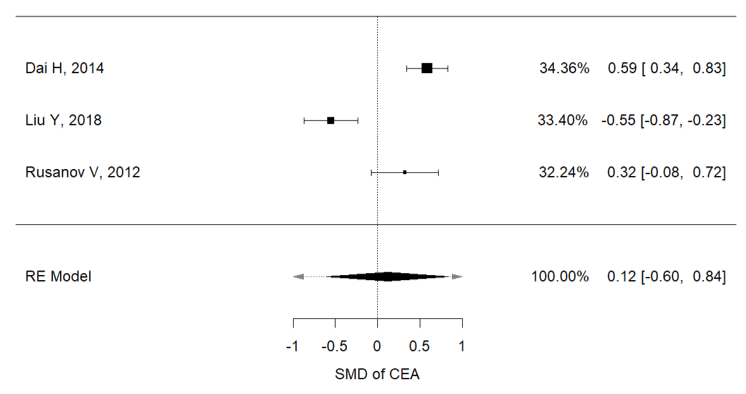
Higher concentrations of carcinoembryonic antigen (CEA) and Ca-125 were recorded in IPF patients with lung cancer, than in non-IPF patients (I2 = 92.3%, p < 0.001, mean CEA concentrations (IPF vs. non-IPF): 5.35 vs. 4.89 ng/mL; I2 = 91.9%, p < 0.001, mean Ca125 concentrations (IPF vs. non-IPF): 34.68 vs. 32.09 U/mL) (Figure 2a,b).
|
(a) |
|
|
|
(b) |
|
|
Figure 1. (a) Metanalysis results from Ca125 concentrations of selected studies; (b) metanalysis results from CEA concentrations of selected studies.
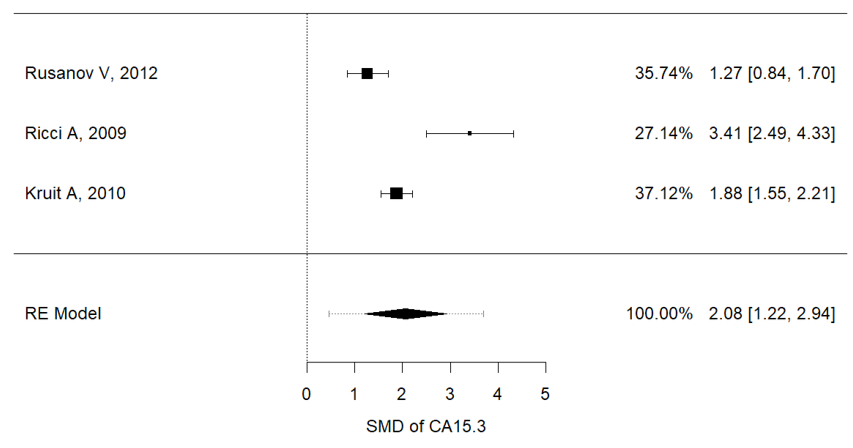
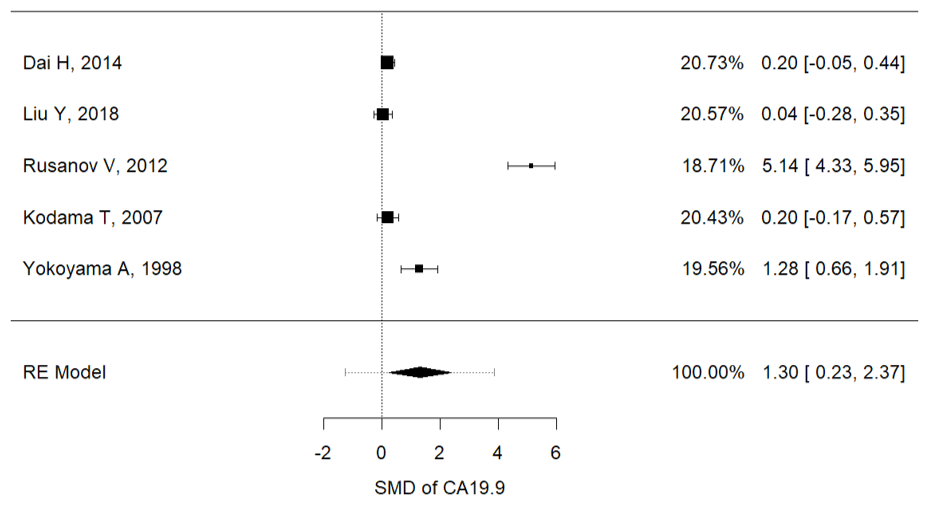
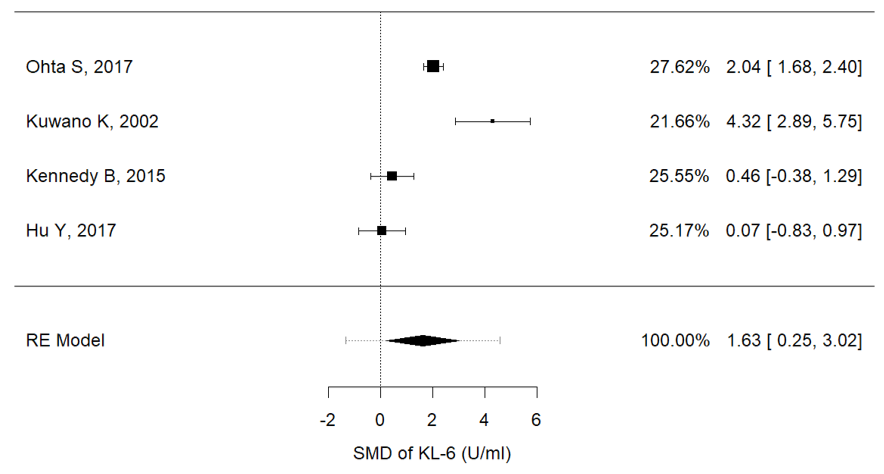
Serum concentrations of Ca15.3 (I2 = 88.8%, P = 0.001, mean (IPF vs. non-IPF): 91.02 vs. 16.3 U/ml), Ca19-9 (I2 = 97.3%, p < 0.001, mean (IPF vs. non-IPF): 54.71 vs. 15.29 U/ml) and KL-6 (I2 = 91.9%, p < 0.001, mean (IPF vs. non-IPF): 1164 vs. 317 U/ml) were associated with disease progression in IPF patients (Figure 2a–c). In particular, higher values of these three markers were found in IPF patients and were correlated with a worse prognosis.
|
|
|
(a) |
|
|
|
(b) |
|
|
|
(c) |
Figure 2. (a) Metanalysis results from Ca15.3 concentrations of selected studies, (b) metanalysis results from Ca19.9 concentrations of selected studies, (c) metanalysis results from KL-6 concentrations of selected studies.
3. Original Contribution
3.1. Study Population
The main characteristics of our population are reported in Table 1. As expected, IPF patients were predominantly male (81.4%), over 65 years of age and most had a history of cigarette smoking (75%). Velcro crackles were audible by chest auscultation in all IPF patients, and significantly more often than in non-IPF patients (Table 1). Dyspnea expressed as modified Medical Research Council (mMRC) score was statistically different in the IPF and non-IPF groups at t3 (p = 0.0070). In the IPF group, mMRC score at t0 differed from those at subsequent follow-up times (p = 0.0001). At 18-month follow-up (t3), three IPF patients had died, while no patient had died in the non-IPF group. Stratifying the study population according to therapy with pirfenidone or nintedanib, we did not observe any statistically significant difference of oncomarker concentrations or functional disease progression.
Table 1. The main characteristics of our population divided in idiopathic pulmonary fibrosis (IPF) and non-IPF groups. 1 and 2: older and prevalence of males in the IPF group (p < 0.05), respectively. 3. Velcro sound was prevalent in the IPF group (p < 0.05). Abbreviations: modified Medical Research Council (mMRC).
|
|
IPF (n = 24) |
Non-IPF (n = 25) |
|
Age (yr) |
73.80 ± 7.79 1 |
62.43 ± 13.63 |
|
Sex (M/F) |
22/2 2 |
14/11 |
|
Smoking history (>5p/yr) |
18/24 |
12/25 |
|
Familiarity for ILD (yes/no) |
2/24 |
1/25 |
|
Cough (VAS > 3/10 cm) |
22/24 |
17/25 |
|
Dyspnea (mMRC > 1/4) |
16/24 |
14/25 |
|
Velcro sound (yes/no) |
23/24 3 |
8/25 |
|
Clubbing (yes/no) |
3/24 |
1/25 |
Statistical analysis was performed comparing each sampling time for each group (IPF: t0 vs. t1, t0, vs. t2, etc.); moreover, a comparison analysis was performed between the two subgroups (IPF t0 vs. non-IPF t0, IPF t1 vs. non-IPF t1, etc.).
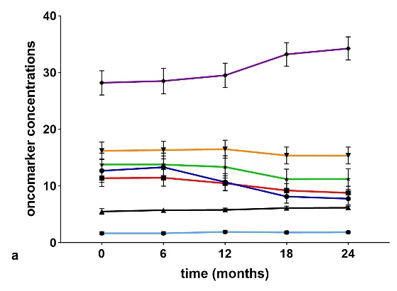
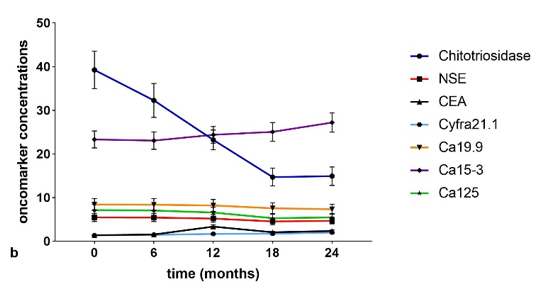
Serum concentrations (Figure 3a,b) of chitotriosidase and oncomarkers Cyfra 21.1, Ca19.9, and Ca125 were in the normal range at t0 in the IPF and non-IPF groups. As expected, serum chitotriosidase was higher in the non-IPF group in relation to the presence of sarcoidosis patients (p < 0.05) [16][17][18][19][20]. This trend remained unchanged even at 18-month follow-up.
|
|
|
|
(a) |
(b) |
Figure 3. (a) Serial concentrations of oncomarkers in the IPF group. (b) Serial oncomarker concentrations in the non-IPF group.
The non-IPF group showed lower CEA concentrations at t0 than at t3 (p = 0.0294) and t4 (p = 0.0019) and the difference was statistically significant between t1 and t4 (p = 0.0327). Comparing oncomarker concentrations in the two groups, neuron specific enolase (NSE), CEA, Ca19.9 and Ca125 were higher in IPF patients than in the non-IPF group at every follow-up (p < 0.05). Ca15.3 concentrations were higher in the IPF than the non-IPF group at t3 (p = 0.0080) and t4 (p = 0.0168).
In IPF group patients, serum concentrations of Ca15.3 showed a statistically significant increase in the intervals t0–t3 (p = 0.0369), t0–t4 (p = 0.0142), t1–t3 (p = 0.0350), and t2–t4 (p = 0.043).
CEA had the greatest sensitivity and specificity for distinguishing IPF and non-IPF patients at all follow-up times (Table 2).
Table 2. Receiver operating characteristic (ROC) curve analysis between IPF and non-IPF patients according to oncomarker concentrations at each sampling time. Abbreviations: t0, baseline; t1, 6 months; t2, 12 months; t3, 18 months; t4, 24 months.
|
IPF vs. Non-IPF |
AUC |
p Value |
Cut-Off Value |
Sensitivity |
Specificity |
|
NSE, T0 |
76 |
0.0016 |
7.75 |
72 |
70.8 |
|
NSE, T1 |
77.1 |
0.0012 |
4.96 |
68 |
79.2 |
|
NSE, T2 |
76.7 |
0.0014 |
7.95 |
72 |
66.7 |
|
NSE, T3 |
77.4 |
0.0010 |
4.65 |
72 |
75 |
|
NSE, T4 |
71.6 |
0.0096 |
5 |
72 |
70.8 |
|
CEA, T0 |
94 |
<0.0001 |
2.55 |
96 |
87.5 |
|
CEA, T1 |
99.7 |
<0.0001 |
2.85 |
96 |
95.8 |
|
CEA, T2 |
95.6 |
<0.0001 |
2.85 |
92 |
95.5 |
|
CEA, T3 |
98.8 |
<0.0001 |
2.85 |
88 |
95.8 |
|
CEA, T4 |
98.1 |
<0.0001 |
3.3 |
88 |
95.8 |
|
Ca19.9, T0 |
78.4 |
0.0006 |
12.6 |
76 |
79.2 |
|
Ca19.9, T1 |
77 |
0.0012 |
11.9 |
72 |
79.2 |
|
Ca19.9, T2 |
78.2 |
0.0007 |
11.2 |
68 |
79.2 |
|
Ca19.9, T3 |
79.6 |
0.0004 |
9.7 |
68 |
79.2 |
|
Ca19.9, T4 |
81.6 |
0.0002 |
8.3 |
68 |
83.3 |
|
Ca15-3, T3 |
69.9 |
0.0168 |
31.6 |
72 |
54.2 |
|
Ca15-3, T4 |
67.7 |
0.0340 |
29.3 |
60 |
62.5 |
|
Ca125, T0 |
71.4 |
0.0114 |
8.8 |
68 |
66.7 |
|
Ca125, T1 |
72.1 |
0.0008 |
8.7 |
68 |
66.7 |
|
Ca125, T2 |
74.2 |
0.0036 |
9.3 |
68 |
66.7 |
|
Ca125, T3 |
73.8 |
0.0042 |
7.2 |
72 |
66.7 |
|
Ca125, T4 |
71.5 |
0.0099 |
9.5 |
76 |
62.5 |
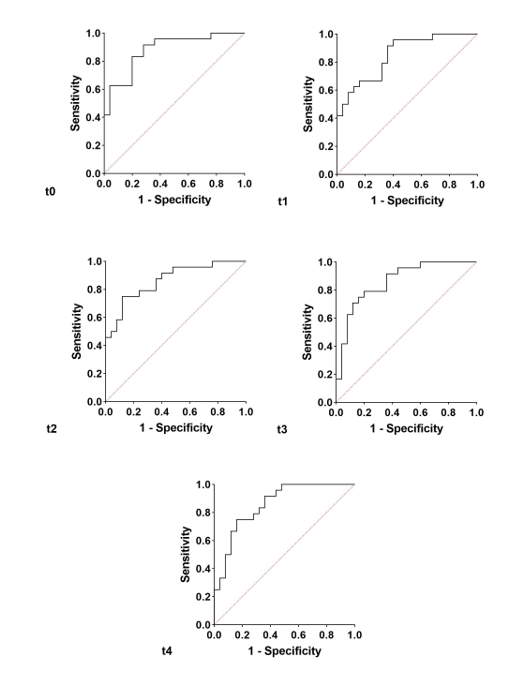
In order to improve the specificity and sensitivity of Ca15.3, a panel of biomarkers was analyzed. With the IPF group as dependent variable, and chitotriosidase, Cyfra 21.1, Ca15.3, Ca125, and Ca19.9 concentrations at t0 as independent variables, the area under the receiver operating curve (AUROC) obtained by logistic regression was 88% (95% CI 78–97, NPP 82.6%, and PPP 76.9%, p < 0.0001) (Figure 4). With the same biomarker concentrations at t1, t2, t3, and t4 as independent variables, we repeated the logistic regression. At t1, we obtained an AUROC of 85% (95% CI 74–95, NPP 70.8%, and PPP 68%, p < 0.0001) (Figure 4), at t2, 86% (95% CI 76–96, NPP 78.3%, and PPP 73.1%, p < 0.0001) (Figure 4), at t3, 86% (95% CI 76–96, NPP 80%, and PPP 79.2%, p < 0.0001) (Figure 4) and at t4, 86% (95% CI 75–96, NPP 78.3%, and PPP 73.1%, p < 0.0001) (Figure 4). With respect to a single biomarker, the panel increased sensitivity and specificity in discriminating the two groups at all follow-up times.
Figure 4. The analysis of logistic regression reporting t0, t1, t2, t3, and t4 oncomarkers panel in the IPF vs. the non-IPF group.
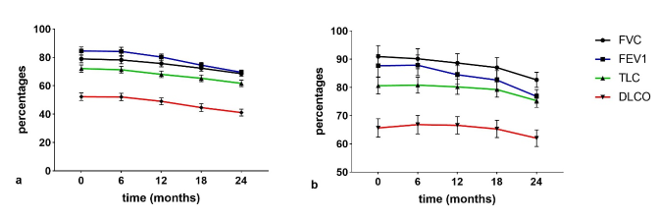
Regarding lung function (Figure 5), FVC%, forced expiratory volume in 1 sec (FEV1%), total lung capacity (TLC)%, and DLCO% decreased significantly in the interval t0–t4 in IPF patients compared to non IPF patients. TLC and DLCO percentages were lower in the IPF than in the non IPF group at all follow-ups. In IPF patients, all functional parameters were significantly different (p < 0.01) at t3 with respect to t2 and t0 (p < 0.01). No significant differences (p > 0.01) in lung function parameters were observed in non-IPF patients in the serial follow-up.
Figure 5. (a) IPF serial changes of pulmonary function test (PFT) parameters (b) non-IPF serial changes PFT parameters.
The trend of functional parameters in the IPF population showed a progressive statistically significant decline at t3 and t4 (p < 0.05). Due to the limited statistical sample, no correlations between serological biomarkers and survival data could be detected. Correlation analysis between serum biomarkers and lung function parameters in the two groups are shown in Table 3. Interestingly, there was a significant negative correlation between serum concentrations of CEA and FEV1, FVC and DLCO percentages at t3 and t4.
Table 3. Correlation analysis between serum biomarkers and pulmonary function test (PFT) parameters in the two subgroups. Abbreviations: FVC, forced vital capacity; FEV1, forced expiratory volume in 1 second; DLCO, diffusing lung for carbon monoxide; CEA, carcinoembryonic antigen; TLC, total ling capacity.
|
IPF |
Rho Coefficient |
p Value |
Non-IPF |
Rho Coefficient |
p Value |
||
|
T0 |
|
|
T0 |
|
|
||
|
CEA |
TLC |
−0.48 |
0.018 |
Chito |
FVC |
0.476 |
0.016 |
|
Cyfra21.1 |
DLCO |
−0.43 |
0.036 |
|
FEV1 |
0.425 |
0.034 |
|
T1 |
|
|
TLC |
0.422 |
0.035 |
||
|
Chito |
DLCO |
0.511 |
0.011 |
T1 |
|
|
|
|
Cyfra21.1 |
DLCO |
−0.44 |
0.031 |
Chito |
FVC |
0.605 |
0.001 |
|
T2 |
|
|
FEV1 |
0.662 |
0.0003 |
||
|
CEA |
FVC |
−0.501 |
0.013 |
|
TLC |
0.515 |
0.008 |
|
CEA |
FEV1 |
−0.524 |
0.009 |
|
DLCO |
0.490 |
0.013 |
|
Cyfra21.1 |
FEV1 |
−0.430 |
0.036 |
T2 |
|
|
|
|
T3 |
|
Chito |
FVC |
0.636 |
0.0006 |
||
|
Chito |
FVC |
0.416 |
0.043 |
|
FEV1 |
0.710 |
0.0001 |
|
Chito |
FEV1 |
0.429 |
0.037 |
|
TLC |
0.522 |
0.0075 |
|
CEA |
FVC |
−0.682 |
0.0002 |
|
DLCO |
0.477 |
0.0252 |
|
CEA |
FEV1 |
−0.811 |
0.000001 |
NSE |
TLC |
−0.480 |
0.015 |
|
CEA |
DLCO |
−0.647 |
0.001 |
CEA |
FEV1 |
−0.529 |
0.007 |
|
Ca19.9 |
FVC |
−0.458 |
0.024 |
|
TLC |
−0.418 |
0.038 |
|
Ca15-3 |
FEV1 |
−0.439 |
0.032 |
|
DLCO |
−0.423 |
0.035 |
|
T4 |
|
Ca19.9 |
TLC |
−0.411 |
0.041 |
||
|
Chito |
FEV1 |
0.54 |
0.006 |
T3 |
|
|
|
|
CEA |
FVC |
−0.803 |
0.000002 |
Chito |
FVC |
0.635 |
0.0006 |
|
CEA |
FEV1 |
−0.852 |
0.0000001 |
|
FEV1 |
0.783 |
0.000004 |
|
CEA |
TLC |
−0.464 |
0.022 |
|
TLC |
0.579 |
0.002 |
|
CEA |
DLCO |
−0.520 |
0.009 |
|
DLCO |
0.509 |
0.0093 |
|
Cyfra21.1 |
FVC |
−0.427 |
0.037 |
NSE |
TLC |
−0.510 |
0.009 |
|
|
FEV1 |
−0.505 |
0.012 |
|
DLCO |
−0.410 |
0.0417 |
|
|
CEA |
TLC |
−0.461 |
0.02 |
|||
|
Ca19.9 |
TLC |
−0.461 |
0.0387 |
||||
|
Ca125 |
TLC |
−0.408 |
0.0431 |
||||
|
T4 |
|
|
|||||
|
Chito |
FVC |
0.614 |
0.001 |
||||
|
|
FEV1 |
0.711 |
0.00007 |
||||
|
|
TLC |
0.598 |
0.002 |
||||
|
|
DLCO |
0.485 |
0.014 |
||||
|
NSE |
TLC |
−0.431 |
0.032 |
||||
|
Ca19.9 |
TLC |
−0.419 |
0.037 |
||||
|
Ca125 |
TLC |
−0.405 |
0.045 |
||||
Abbreviations: t0, baseline; t1, 6 months; t2, 12 months; t3, 18 months; t4, 24 months.
References
- Raghu, G.; Remy-Jardin, M.; Myers, J.L.; Richeldi, L.; Ryerson, C.J.; Lederer, D.J.; Behr, J.; Cottin, V.; Danoff, S.K.; Morell, F.; et al. Diagnosis of Idiopathic Pulmonary Fibrosis. An Official ATS/ERS/JRS/ALAT Clinical Practice Guideline. Am. J. Respir. Crit. Care Med. 2018, 198, e44–e68, doi:10.1164/rccm.201807-1255ST.
- Kato, E.; Takayanagi, N.; Takaku, Y.; Kagiyama, N.; Kanauchi, T.; Ishiguro, T.; Sugita, Y. Incidence and Predictive Factors of Lung Cancer in Patients with Idiopathic Pulmonary Fibrosis. ERJ Open Res. 2018, 4, doi:10.1183/23120541.00111-2016.
- Wynn, T.A. Integrating Mechanisms of Pulmonary Fibrosis. J. Exp. Med. 2011, 208, 1339–1350, doi:10.1084/jem.20110551.
- Spagnolo, P.; Tonelli, R.; Cocconcelli, E.; Stefani, A.; Richeldi, L. Idiopathic Pulmonary Fibrosis: Diagnostic Pitfalls and Therapeutic Challenges. Multidiscip. Respir. Med. 2012, 7, 42, doi:10.1186/2049-6958-7-42.
- Vancheri, C.; Cottin, V.; Kreuter, M.; Hilberg, O. IPF, Comorbidities and Management Implications. Sarcoidosis Vasc. Diffuse Lung Dis. Off. J. WASOG 2015, 32 Suppl 1, 17–23.
- Maher, T.M.; Oballa, E.; Simpson, J.K.; Porte, J.; Habgood, A.; Fahy, W.A.; Flynn, A.; Molyneaux, P.L.; Braybrooke, R.; Divyateja, H.; et al. An Epithelial Biomarker Signature for Idiopathic Pulmonary Fibrosis: An Analysis from the Multicentre PROFILE Cohort Study. Lancet Respir. Med. 2017, 5, 946–955, doi:10.1016/S2213-2600(17)30430-7.
- Balestro, E.; Castelli, G.; Bernardinello, N.; Cocconcelli, E.; Biondini, D.; Fracasso, F.; Rea, F.; Saetta, M.; Baraldo, S.; Spagnolo, P. CA 19-9 Serum Levels in Patients with End-Stage Idiopathic Pulmonary Fibrosis (IPF) and Other Interstitial Lung Diseases (ILDs): Correlation with Functional Decline. Chron. Respir. Dis. 2020, 17, 1479973120958428, doi:10.1177/1479973120958428.
- Dai, H.; Liu, J.; Liang, L.; Ban, C.; Jiang, J.; Liu, Y.; Ye, Q.; Wang, C. Increased Lung Cancer Risk in Patients with Interstitial Lung Disease and Elevated CEA and CA125 Serum Tumour Markers. Respirol. Carlton Vic 2014, 19, 707–713, doi:10.1111/resp.12317.
- Kodama, T.; Satoh, H.; Ishikawa, H.; Ohtsuka, M. Serum Levels of CA19-9 in Patients with Nonmalignant Respiratory Diseases. J. Clin. Lab. 2007, 21, 103–106, doi:10.1002/jcla.20136.
- Ricci, A.; Mariotta, S.; Bronzetti, E.; Bruno, P.; Vismara, L.; De Dominicis, C.; Laganà, B.; Paone, G.; Mura, M.; Rogliani, P.; et al. Serum CA 15-3 Is Increased in Pulmonary Fibrosis. Sarcoidosis Vasc. Diffuse Lung Dis. Off. J. WASOG 2009, 26, 54–63.
- d’Alessandro, M.; Bergantini, L.; Cameli, P.; Lanzarone, N.; Antonietta Mazzei, M.; Alonzi, V.; Sestini, P.; Bargagli, E. Serum KL-6 Levels in Pulmonary Langerhans’ Cell Histiocytosis. Eur. J. Clin. Invest. 2020, e13242, doi:10.1111/eci.13242.
- d’Alessandro, M.; Carleo, A.; Cameli, P.; Bergantini, L.; Perrone, A.; Vietri, L.; Lanzarone, N.; Vagaggini, C.; Sestini, P.; Bargagli, E. BAL Biomarkers’ Panel for Differential Diagnosis of Interstitial Lung Diseases. Exp. Med. 2020, 20, 207–216, doi:10.1007/s10238-020-00608-5.
- Bergantini, L.; d’Alessandro, M.; Vietri, L.; Rana, G.D.; Cameli, P.; Acerra, S.; Sestini, P.; Bargagli, E. Utility of Serological Biomarker’ Panels for Diagnostic Accuracy of Interstitial Lung Diseases. Res. 2020, doi:10.1007/s12026-020-09158-0.
- d’Alessandro, M.; Bergantini, L.; Cameli, P.; Vietri, L.; Lanzarone, N.; Alonzi, V.; Pieroni, M.; M Refini, R.; Sestini, P.; Bonella, F.; et al. Krebs von Den Lungen-6 as Biomarker for Disease Severity Assessment in Interstitial Lung Disease: A Comprehensive Review. Biomark. Med. 2020.
- Rusanov, V.; Kramer, M.R.; Raviv, Y.; Medalion, B.; Guber, A.; Shitrit, D. The Significance of Elevated Tumor Markers among Patients with Idiopathic Pulmonary Fibrosis before and after Lung Transplantation. Chest 2012, 141, 1047–1054.
- Bargagli, E.; Margollicci, M.; Nikiforakis, N.; Luddi, A.; Perrone, A.; Grosso, S.; Rottoli, P. Chitotriosidase Activity in the Serum of Patients with Sarcoidosis and Pulmonary Tuberculosis. Respir. Int. Rev. Thorac. Dis. 2007, 74, 548–552.
- Bargagli, E.; Maggiorelli, C.; Rottoli, P. Human Chitotriosidase: A Potential New Marker of Sarcoidosis Severity. Respir. Int. Rev. Thorac. Dis. 2008, 76, 234–238.
- Bargagli, E.; Bennett, D.; Maggiorelli, C.; Di Sipio, P.; Margollicci, M.; Bianchi, N.; Rottoli, P. Human Chitotriosidase: A Sensitive Biomarker of Sarcoidosis. J. Clin. Immunol. 2013, 33, 264–270.
- Bargagli, E.; Margollicci, M.; Luddi, A.; Nikiforakis, N.; Perari, M.G.; Grosso, S.; Perrone, A.; Rottoli, P. Chitotriosidase Activity in Patients with Interstitial Lung Diseases. Respir. Med. 2007, 101, 2176–2181.
- Bargagli, E.; Bianchi, N.; Margollicci, M.; Olivieri, C.; Luddi, A.; Coviello, G.; Grosso, S.; Rottoli, P. Chitotriosidase and Soluble IL-2 Receptor: Comparison of Two Markers of Sarcoidosis Severity. Scand. J. Clin. Lab. Investig. 2008, 68, 479–483.


