 +1 credit
| Version | Summary | Created by | Modification | Content Size | Created at | Operation |
|---|---|---|---|---|---|---|
| 1 | Anshu Zhang | + 4191 word(s) | 4191 | 2021-01-13 10:23:45 | | | |
| 2 | Lily Guo | + 328 word(s) | 4519 | 2021-02-01 06:59:18 | | |
Video Upload Options
Human mobility, the movement of human beings in space and time, reflects the spatial-temporal characteristics of human behavior. With big data analytics, human mobility research can be used to facilitate smart city development, in multiple disciplines such as smart traffic, smart urban planning, smart health, smart safety, smart commerce, etc. A framework for linking international academic research and city-level management policy was established and applied to the case of Hong Kong. Literatures regarding human mobility research using big data are reviewed. These studies contribute to (1) discovering the spatial-temporal phenomenon, (2) identifying the difference in human behaviour or spatial attributes, (3) explaining the dynamic of mobility, and (4) applying to city management. Then, the application of the research to smart city development are scrutinised based on email queries to various governmental departments in Hong Kong. With further improvement in the practical value of data analytics and the utilization of data sourced from multiple sectors, paths to achieve smarter cities from policymaking perspectives are highlighted.
1. Introduction
With the use of information and communication technologies infiltrating into various aspects of peoples’ daily life, big data sets concerning human mobility provide a powerful social microscope to support the discovery of complex knowledge[1]. The new sources of incessantly produced big data shed light on the understanding of human activity, from both individual and urban perspectives, helping to discover the relationships between human mobility and resource use in the social and spatial spheres of cities [2]. Big data analytics (e.g., exploratory data mining and machine-learning) are applied to intelligent decision-making, and the interplay between technology, social change and policy strategies entails enormous opportunities for smart city development [3].
The concept of the smart city is an expression of the multitude of urban living domains to which technology and policy interventions can be applied, and the domains classified as “hard” domains include office and residential buildings, energy grids, natural resources, energy and water management, waste management, environment, transport, mobility and logistics, as well as “soft” domains such as education, culture, e-government and policies that foster economic and social welfare [4]. The spatial-temporal characteristics of human mobility, as the most frequently investigated application of big data analytics[5], can be used to facilitate smart city development, in multiple disciplines such as smart traffic, smart urban planning, smart health, smart safety, smart commerce, etc.[6][7]. For example, the convergence of transportation and information technologies plays key roles in facilitating cooperative transportation, where data streams from sensed transportation, geographic information science and social media can be fused for human engagement and shared decision making[8]. The analytics of geospatial data, both in traditional forms of raster, vector, or graph and from advanced sources of sensors and mobile devices, enhances the power of location, which has been applied for fuel and time savings, revenue increase, and health care[9].
With the increase of big data and the advancement of technologies, city development could be better understood and promoted based on data-driven knowledge. On the side of data analytic, the practical value of data-driven research is to be discovered, whereas on the city development side, the transitions for smarter applications in multiple domains and disciplines are constantly emerging. How can governments and policy makers apply data-driven research to smart city development is worth further exploration.
2. Big Data based Human Mobility Research
Based on a literature review, the studies are primarily categorised by data sources, including mobile phone, mass media, taxi or car, bank card, metro card, website, wireless devices, and multiple sources. Mobile phone (trajectories or call records) is the source that produces the richest information with constantly track locations of individuals and passengers, which is similar to a taxi or car that reflect the locations of the vehicles as well as the drivers. Mass media is related to digital apps and human activities, while bank card is related to transactions and metro card reflects travel behaviour. Data obtained by wireless devices facilitates the understanding of mobility patterns at the smallest scales. Researches based on multiple sources strengthen the power of big data by integrating difference categories of information.
The literature is also categorised by 4 levels of aims, which are discovering the phenomenon, identifying the difference, explaining the differences and implementation in city management. Human and space are two objects normally targeted in research, since human behaviour is influenced by both personal attributes (who they are) and spatial attributes (where they live or work). Table 1 summarizes these researches, categorised by data source and research objective.
Table 1. The applications of “human mobility” research using big data.
| Data Source | Mobile Phone | Mass Media | Taxi and Car | Bank Card | Metro Card | Website | Multi- Source Data | |
|---|---|---|---|---|---|---|---|---|
| Research Objective | ||||||||
| Discover the phenomenon | human mobility pattern | convergence and divergence pattern, accessibility | spatial-temporal path | mobility pattern, crashes | mobility patterns | travel pattern along railway | mobility pattern | |
| space feature | activity pattern, land use pattern, street, green space usage, traffic condition | heat maps | congestion pattern | spatiotemporal structure, spatial pattern | ||||
| Identify the differences | population clustering | central behaviour, collaborative behaviour, clustering by personality, distance, demographic feature, use feature, transport mode | micro-populations clustered by demographic feature or by personality | driver/passenger behaviour clustered by trip purpose or pattern | social bridge, human consumption pattern | rhythms of urban life | ||
| space clarification | Job–housing balance, locational uncertainty | tourism market segmentation | interaction parcels | city ability | vibrant areas, station functions, urban form | the effectiveness of growth boundary | ||
| Explain the differences | dynamics of human behaviour in space usage | social ecology, social and economic activity, human-interest, deep knowledge, cyberspace and physical space relation | cultural mechanism | migration effect | mobility features and app usage behaviour | |||
| Imply to city management | for quality of life | health-disease, health-air quality, crime prediction | health-disease, crime prediction | public facility | activity pattern and prediction | collective travel time | ||
| for resource use | infrastructure | touristic potential | bus route plan, electric cabs | environmental management, transport system | ||||
| Count (excluding COVID-19 research) | 84 | 39 | 12 | 14 | 4 | 6 | 2 | 7 |
| COVID-19 and human mobility | behavioural change, forecast of epidemic risk, impacts of mobility restriction | - | - | - | factors of pandemic transmission, forecast of epidemic risk, control measures, impacts of mobility restriction | |||
| factors of pandemic transmission, control measures | post-pandemic economic recovery | |||||||
| Count (COVID-19 research) | 40 | 20 | 4 | 0 | 0 | 0 | 11 | 5 |
2.1. Discovering the Phenomenon
To understand the spatio-temporal patterns of human mobility is one of the basic targets and fundamental to follow-up analysis. Spatial-temporal paths consistent for each individual are mined from mobile data, whilst relationships among the generated hotspots in temporal dimensions are discovered[10]. Large-scale collective urban mobility was analysed to elaborate people flows between areas, as well as the exceptional patterns that are associated with real-world events such as soccer matches[11]. With taxi GPS data, the distributions of origin/destination data are visualised, based on which trips are confined to a certain distance or orientation range and drivers’ choices of routes could be figured out[12]. From massive event track app data, heat maps of popular routes online can be generated and visualised by virtue of client preferences[13]. Apart from visualization, the movement pattern could be assessed by feature, e.g., stability, in terms of the convergence and divergence of individuals[14].
Apart from phone and vehicle data, WiFi and locational data are used to uncover the transition characteristics between dynamical regimes[15], or to identify frequencies, directions, intensity, and trajectories[16]. With the transaction data of a smart subway fare card, the mobility model was used for generating the heterogeneous flows at aggregated level as well as visitations at the individual level[17].
Human mobilization, although it is a kind of human behaviour, implies the attributes of the specific spaces where mobility happens. To discover the characteristics of land use, big data analytics figure out clusters, such as residential area, office, leisure-commerce and rush hour clusters[18]. The inference of changes in movements facilitates the understanding of polycentric urban form based on the identified city hubs, centres, and borders[19]. Moreover, by involving the information of land use functions, the spatial variation of self-containment and employment and jobs–housing balance could be demonstrated[20].
The interaction between human behaviour and the urban environment could be re-interpreted in more quantitative approaches with big data. For example, population exposures in urban greenery were highly correlated with land use distribution and the dynamics of human mobility[21]. On a worldwide scale, the tourism hotspots in the US and EU cities are identified based on geotagged photographs, which in turn discovers the power-law distribution of the attractiveness of tourist attractions[22].
To achieve the research objectives of discovering the phenomenon, methods of spatial analysis and visual analytics are typically applied. Software tools with different functions are used, including but not limited to ArcGIS for spatial data analyses and visualizations, Java/Python for data processing, Tableau for visual analytics, SPSS for integrity and validity checks, PostgreSQL/PostGIS for data management, and the R platform for graphing.
2.2. Identification of the Differences
To identify the differences in human mobility and space utilization, clustering analysis is commonly adopted to distinguish the differences by parameters such as demographic features of gender, age, income, nationality, etc. It was found that pedestrian mobility is disaggregated between locals and foreigner, implying the impact of tourist flows on the resident life [23]. Via Twitter, human mobility measures are differentiated particularly between different race/ethnicity groups, then the age[24], while gender difference is observed in the location-based check-in data of Weibo[25].
In addition to the demographic parameters, categorizations are processed by mode or demand or other behavioural profiles, either observed or self-defined. Mobile sensed data analytics contribute to the recognition of user transport modes, e.g., by bike, bus, car, foot, and train[26]. Travel demands of taxi passengers are categorised by incorporating and taking into consideration the distance and time constraints, and geographical context[27]. Patterns of mobile users are clustered by both communication behaviour and average revenue per user[28], or by individual space–time profiles with different movements and behaviours[29]. Using data from the wide area network, by monitoring traffic in a few cities, vehicle trajectories are mined and categorised by time or location features[30].
The discovery of differences enriches the understanding of human behaviour and enhances the quality of services. It was found that people who have a higher diameter of area of influence (DAI) also spend more money for mobile communications, indicating the potentiality to use DAI as a feature for classifying socioeconomic levels of cities[31]. Tourism market segmentation based on crowdsourced data facilitates the provision of more personalised tourism services[32].
Systematic analysis combining difference and similarity among clusters improves the allocation of resources. To enhance collaborative mobility (CM) such as sharing travelling resources, the system with extracted GPS traces can automatically find sharing opportunities and recommend behavioural changes for conducting sharing services[33].
Methods of machine learning are widely adopted among this group of studies, such as support vector machines (SVMs), C-means fuzzy clustering, K-means clustering, hierarchical clustering, ant colony algorithm, etc.
2.3. Explanation of the Differences/Features
Although complex, the differences among groups or individuals are to some extent explicable, based on personal properties, spatial attributions, or the interactive effects of humans and the environment.
Individually, attributes regarding personality, interest, habit, memory, etc, are influential to human mobility. Personality traits help to explain individual differences in location-based social networks usage and the types of places visited[34]. The big five personality traits are commonly applied, and it was found that extraverted individuals have more diverse routines while high neuroticism and openness individuals associate with more instable routine[35]. Interest dynamics of humans, referring to preferential return to previously visited interests, the inertial effect, and exploration of new places, are causally connected to mobility behaviour [36]. Preference itself has rich connotations. For example, differences in the lifestyles between big city and small city residents were observed through the latent patterns of human preference, which is related to both age group and city context[37].
Another interesting discovery is that individual properties are determinative in both physical space and cyberspace movement, the latter defined as changes in online activities, typically corresponding to switching in the websites of exploration. It was detected that movements in the two spaces were similar in terms of exploration of new sites and preferential return to highly visited sites [38]. The unified underpinning of mobility in the real world and cyberspace is also explained as a memory-preferential mechanism in limited space[39].
Spatial or regional attributes, such as economic-social features, cultural sociology, land use function, etc. are important drivers for different mobility behaviours. Distinctive patterns highlight the similarity or the difference in behaviour among regions in Uganda, distinctly related to economic and social regional characteristics [40]. Social ecology reflected by dominant urban functions is also determinative[41], and one example is about intangible cultural ties, e.g., the existence and persistence of dialect borders identified with Weibo data affect human mobility for social interactions[42].
The integration of multiple data sources enhances the interpretation of different space attributes. Based on subway transaction records and points of interest (POI) information, the latent functions of subway stations and the correlation between mobility patterns and station functions were illustrated[43]. Similarly, building functions are inferred with WeChat location records, taxi GPS trajectories, POI, and building footprint from high-resolution Quickbird images[44].
Latent features of either human behaviour or place attributes reflected from economic activities in the process of movement are inspiring yet noteworthy. High income taxi drivers are more likely to deny passage to passengers[45]. The integration of individual economic spending with mobility implies the ability of cities to attracting foreign visitors[46]. People may become the “social bridges” between communities, since it is found that those who work at close-by locations could act similarly in community purchase behaviour even in different communities[47].
In the physical world, mobility is more like a result of interaction between individuals and the space or environment. Methods of statistical analysis are applied for explaining the drivers and their effects, including correlation analysis (mostly used), regression models, preferential attachment models to reproduce the statistical scaling of behaviours, etc.
2.4. Prediction and Implication
The results of some researches could be applied to city management, in multiple disciplines, here mainly categorised in four aspects of transportation system, public health, urban governance, and environment management and policy.
2.4.1. Transportation System
Transportation is the domain where applications of big data are broad. Strategies are proposed in the literature to predict the travel time of any trip, to provide real time traffic information, to predict movement patterns based on personality or spatio-temporal routines, to improve crash analysis, to plan bus routes, to improve taxi dispatch, and to optimise traffic during big events.
The consensual 3D speed map revealing the urban congestion patterns is used to predict the travel time of any trip within the city[48]. With information from individual participants or diary and trajectory generators, the overall traffic could be compared or monitored in real time[49][50]. With multiple data sources, the impact of big events on traffic could be estimated and strategies for reducing the collective travel time and congestion are proposed by evaluating different route choice scenarios at the urban scale[51]. Based on the established relationship between human mobility and personality, movement patterns could be predicted[52]. Twitter-based activity information could be incorporated in spatial analysis of crashes in urban areas, and geographically weighted regression (GWR) models were developed to establish a relationship between the crash counts reported and various contributing factors[53]. Intending to explore the night bus route planning issue by using taxi GPS traces, analysis was conducted to achieve the maximum number of passengers under the given conditions and constraints[54]. Agent-based modelling of taxi behaviour simulation with probe vehicle data helps to get deeper understanding of taxi behaviour, for better managing and dispatching the fleet of the taxi that can make monetary profit for the drivers[55].
2.4.2. Public Health
Increasing attention has been paid to the integration of human mobility data into the policy of public health, particularly in supporting environmental exposure assessment and programs designed for spatiotemporal disease control.
With population density data derived by mobile phone traffic and station-based air quality data, dynamic urban air pollution (e.g., PM2.5 concentrations) population exposures were investigated in details and compared among residents, tourists and commuters [56][57]. For guiding disease control, intra-urban transmission risk of dengue fever with hourly cell phone data was mapped, considering local human movements, temporal scale, and positioning uncertainty[58], while the degree of variation in transmission coefficient, a designated spatially and temporally dependent variable, was inferable using geolocated tweets[59]. Drivers of endemic schistosomiasis were unveiled with both socioeconomic and environmental factors and human mobility features, based on which the effects of control, for example, via improved access to safe water or educational campaigns were analysed [60]. However, it is argued that even though mobility and infectious diseases have been connected by quantifying disease-relevant travel patterns on fine spatial and temporal scales, how a system can be currently implemented against disease incidence remains questionable; the models need to be formally statistically evaluated and tested[61].
The increasing involvement of human mobility data in public health research has been well reflected in the recent intensive mobility-related studies on the COVID-19 pandemic. In particular, these studies have been facilitated by the latest public and aggregated massive mobile phone data provided by major location-based service vendors, such as Google COVID-19 Community Mobility Reports[62] and Baidu Migration data[63]. A focus of mobility-related COVID-19 studies is on the interactions between human mobility and pandemic. The interactions include the role played by human mobility in the pandemic transmission[64][65]; the combined association of mobility and other environment and socioeconomic factors on the pandemic spread [66] and peoples’s change in mobility behaviours and the use of urban spaces, usually because of mobility restrictions and social distancing policies[67][68]. Based on the mobility-pandemic interactions, studies have further involved human mobility data into the forecast of epidemic risk[69][70], as well as the evaluation and recommendation of various epidemic control measures[71][72]. The environmental and socioeconomic impacts of mobility restriction resulted from the pandemic have also been further investigated. While the reduced human mobility and activities have been found to result in a general reduction of pollution[73] [74], they also have been found to lead to great economic loss and aggravation of social issues, such as inequality[75]. Thanks to the availability of timely human mobility data, various online and mobile platforms have been developed for near-real-time mapping of epidemic cases and predicted epidemic risks, to help anti-pandemic policy making and the self-protection of the public[76]. A list of technical tasks in geographic information systems to understand, predict, and support the control measures of COVID-19 are summarised in[77].
2.4.3. Urban Governance
Human mobility patterns reveal the movement of a large population, potential applications of which are raised in domains from big events management, disaster evacuation, crime prediction, and safety estimation, to public space/facility provision.
Knowledge about the occurrences of big events derived from bus trajectories including event start time, end time, temporal patterns of arrival and departure of event attendees, etc. can be usefully applied in event planning and management[78]. For predicting human evacuation following disasters, human emergency behaviour could be modelled using an intelligent deep learning system such as DeepMob [79]. Regarding the classification of crime hotspots, aggregated human behavioural data captured from the mobile network infrastructure, in combination with basic demographic information, can describe the crime level of a geographical area and assist crime prediction[80]. The safety of places in new developments or public areas is possible to estimate by operationalizing relevant concepts from criminological and urban theories, with prediction features exploited from census data, Foursquare, subway usage, and taxi usage [81]. The spatial interaction characteristics and service areas of different types and sizes of public facilities are identified based on taxi drop on drop off data, for optimizing the spatial configuration of medical or other types of public facilities[82].
2.4.4. Environmental Management and Policy
Referring to environment-related policies, big data contributes to the management of environment projects as well as the analysis of policy adoption. Data science and environmental management draw upon the results of national projects. The LENVIS project in Italy enables users to upload video of localised pollution events and personal narratives, forming a network of monitoring the interplay between the concentration levels of a set of airborne pollutants and the health care in hospital [83]. To assess whether the policy of energy-saving vehicles can be implemented, real mobility information is used as decision support for the taxi fleet manager to promote the adoption of electric taxi cabs [84]. Focusing on economic feasibility of the policy, quantitative calculations show that introducing electric vehicles in the taxi fleet increases the purchase cost of the taxis, however service, maintenance and repairs and fuel costs can be reduced, resulting in a reduction in total costs [85].
2.5. Summary of the Hierarchical Research
In summary, the hierarchy of research was illustrated by objective, with data requirements and methods briefly marked. The upper level is to simply show what happened in real world (discovering the phenomenon), mainly using the methods of basic spatial analysis and visualization. The middle levels attempt to explain how and why it happened with more data reflecting social-economic factors and their connections with spatial mobility using mathematical methods such as statistical analysis and machine learning. The bottom level of applications is based on prediction, a platform for information exchange, and knowledge generated from subject data that can be used to explore what we can do for city development and management. Although the methods applied at the bottom level were not always complex, more data are required to achieve the objectives at the deeper levels; see Figure 2.
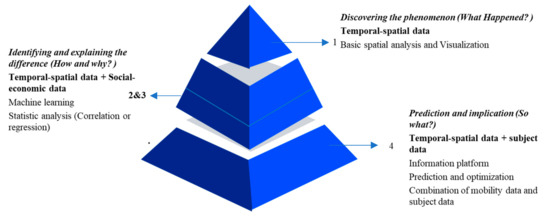
Figure 2. Hierarchy of research by objective (data requirement and method).
Even though the advantages of applying big data analytic in the city are emphasised, the linkage between the concepts of human mobility and the smart city is still fuzzy. However, the current trends and evolution patterns of any individual smart city depend on the local context factors, and in order to shape appropriate strategies for particular cities therefore policy makers are urged to understand these factors[4].
3. Hong Kong Smart City Policy
To identify the gaps between the data-driven research and potential implementation in the various domains of smart city developments, communications with government are essential. In the case of HK, since only a few questions (not more than four) are targeted for each governmental department, emails rather than interviews were adopted for communication.
3.1. Views from Government
Focusing on the management scopes of different departments including the Transport Department, the Hong Kong Police Force, the Department of Health, the Environmental Protection Department, the Hong Kong Tourism Board, and the Planning Department, questions about “How can big data and the advanced analytics/technologies proposed in research applied in the real work?” were enquired with a brief introduction of related literature. Table 2 lists the fields of the questions for the corresponding government sectors. Details of the emails and the responses refer to Supplementary Materials.
Table 2. Enquiries sent to departments of Hong Kong (HK).
| Department | Question |
|---|---|
| Transport Department (TD) | 1. About Route Planning of Public Transport 2. About Big Event Transportation Management 3. About Taxi Dispatching 4. About Vehicle Crash Analysis |
| Hong Kong Police Force (HKPF) | 5. About Crime Prediction |
| Department of Health (HD) | 6. About Disease Control |
| Environmental Protection Department (EPD) | 7. About Air Pollution Exposure 8. About Electric Vehicle Adoption |
| Hong Kong Tourism Board (HKTB) | 9. About Tourism Behaviour 10. About Market Segmentation 11. About Old Town Heritage Tourism |
| Planning Department (PD) | 12. About Land Use Function |
According to their responses, the importance of applying big data in improving city governance was confirmed and many smart initiatives associated with human mobility were mentioned. Nevertheless, regarding the application of the introduced analytics, barriers are still significant. The difficulties mentioned in replied emails were interpreted in five aspects in the following Section 2.2.
3.2. Issues and Barriers in Application
Data isolation. The databases managed by different departments are not well integrated, and therefore the methodologies used in research could not be applied due to data limitation. In addition, data from sub-institutional sectors under the management of the same department may also be isolated. For example, regarding taxi dispatch, a few taxi hailing platforms are being used. Thus, the TD indicates that setting up or integrating these platforms is the primary condition to improve the operational efficiency and service quality of taxis.
Data unavailability. According to the reviewed literature, data from mobile phones is advantageous in reflecting human behaviour and discovering knowledge of peoples’ mobility. However, in the case of HK, these data are not available to government at the current moment, restricting the application of related research in real world. One example is the analysis of the real-time influence of air quality on human daily life. The real-time population exposure was measured in studied areas using mobile- and station-based big data, considering the spatiotemporal variability of both population distribution and pollutants concentrations. In contrast, the studies conducted by EPD took the air quality of a city as homogeneity without sufficient considerations of the spatial differences in pollution exposures.
Costs versus quality of data. The costs not only for the short-term installations but for the long-term operation are unneglectable barriers for obtaining big data, particularly those with high quality. Referring to air quality monitoring, even though some lower cost air monitoring devices are capable of providing quality data, their operating cost is not much lower than that of the existing stations, and thorough consideration is essential in planning for long term deployment of additional monitoring.
Limited knowledge derived from rich data. Even with integrated big data, how can deeper knowledge be generated based on more scientific analytics requires much effort. In the planning of bus routes, franchised bus companies submit proposals for service adjustment through the annual route planning programmes; however, the impacts are considered case by case rather than based on systematic analytics, by taking into consideration all the routes in the city as a whole. There is a large scope of information to turn the absorbed big data into generalized knowledge of human behaviour and space use. For instance, the HKTB has collaborated with social and digital media players such as Google, TripAdvisor and Facebook; nevertheless, the obtained data was not thoroughly used and mined to elaborate tourism behaviours, which if applicable, will be helpful in clarifying destination brandings as well as demonstrating the tourism market.
Estrangement between public and private sectors. The involvement of non-public sectors and cooperation among government, companies, institutions and even individuals are essential to the implementation of smart initiatives, yet proves to be difficult. Taking for instance the adoption of electric vehicles (EVs), chargers for public EVs are being installed to test the real-time electronic information through the Government Electronic Platform. However, how to enlarge the promotion of EVs to private sectors and individual car owners remains an open question to be further discussed.
In summary, the achievements in smart city development are laudable, yet it is still in the start-up stage, which mainly focuses on the base of smart infrastructure, such as the Common Spatial Data Infrastructure (CSDI) by the Development Bureau, map service platform by the Lands Department, Intelligent Transport Systems (ITS) by the TD, smart travel platform by HKTB, etc. Among the smart sub-domains, transportation is the area that is most related to human mobility and has applied more data-driven analytics and technologies than other areas. To accomplish the mission to “maximise innovation, knowledge and value creation for the government, business and the community”, the penetration of smart technologies to other development and management domains will come a long way.
References
- Batty, M.; Axhausen, K.W.; Giannotti, F.; Pozdnoukhov, A.; Bazzani, A.; Wachowicz, M.; Ouzounis, G.; Portugali, Y. Smart cities of the future. Eur. Phys. J. Spéc. Top. 2012, 214, 481–518, doi:10.1140/epjst/e2012-01703-3.
- Yuan, Y.; Raubal, M. Analyzing the distribution of human activity space from mobile phone usage: An individual and ur-ban-oriented study. Int. J. Geogr. Inf. Sci. 2016, 30, 1594–1621, doi:10.1080/13658816.2016.1143555.
- Hilbert, M. Big Data for Development: A Review of Promises and Challenges. Dev. Policy Rev. 2016, 34, 135–174, doi:10.1111/dpr.12142.
- Neirotti, P.; De Marco, A.; Cagliano, A.C.; Mangano, G.; Scorrano, F. Current trends in Smart City initiatives: Some stylised facts. Cities 2014, 38, 25–36, doi:10.1016/j.cities.2013.12.010.
- Liu, J.; Li, J.; Li, W.; Liu, J. Rethinking big data: A review on the data quality and usage issues. ISPRS J. Photogramm. Remote. Sens. 2016, 115, 134–142, doi:10.1016/j.isprsjprs.2015.11.006.
- Pan, G.; Qi, G.; Zhang, W.; Li, S.; Wu, Z.; Yang, L.T. Trace analysis and mining for smart cities: Issues, methods, and applica-tions. IEEE Commun. Mag. 2013, 51, 120–126, doi:10.1109/mcom.2013.6525604.
- Yin, C.; Xiong, Z.; Chen, H.; Wang, J.; Cooper, D.; David, B. A literature survey on smart cities. Sci. China Inf. Sci. 2015, 58, 1–18, doi:10.1007/s11432-015-5397-4.
- Miller, H.J. Beyond sharing: Cultivating cooperative transportation systems through geographic information science. J. Transp. Geogr. 2013, 31, 296–308, doi:10.1016/j.jtrangeo.2013.04.007.
- Lee, J.-G.; Kang, M. Geospatial Big Data: Challenges and Opportunities. Big Data Res. 2015, 2, 74–81, doi:10.1016/j.bdr.2015.01.003.
- Yao, H.; Xiong, M.; Zeng, D.; Gong, J. Mining multiple spatial–temporal paths from social media data. Futur. Gener. Comput. Syst. 2018, 87, 782–791, doi:10.1016/j.future.2017.08.003.
- Sagl, G.; Loidl, M.; Beinat, E. A Visual Analytics Approach for Extracting Spatio-Temporal Urban Mobility Information from Mobile Network Traffic. ISPRS Int. J. Geo-Inf. 2012, 1, 256–271, doi:10.3390/ijgi1030256.
- Sainio, J.; Westerholm, J.; Oksanen, J. Generating Heat Maps of Popular Routes Online from Massive Mobile Sports Track-ing Application Data in Milliseconds While Respecting Privacy. ISPRS Int. J. Geo-Inf. 2015, 4, 1813–1826, doi:10.3390/ijgi4041813.
- Jiang, X.; Zheng, C.; Tian, Y.; Liang, R.-H. Large-scale taxi O/D visual analytics for understanding metropolitan human movement patterns. J. Vis. 2015, 18, 185–200, doi:10.1007/s12650-015-0278-x.
- Fang, Z.; Yang, X.; Xu, Y.; Shaw, S.-L.; Yin, L. Spatiotemporal model for assessing the stability of urban human convergence and divergence patterns. Int. J. Geogr. Inf. Sci. 2017, 31, 2119–2141, doi:10.1080/13658816.2017.1346256.
- Li, R.; Zhao, Z.; Yang, C.; Wu, C.; Zhang, H. Wireless big data in cellular networks: The cornerstone of smart cities. IET Commun. 2018, 12, 1517–1523, doi:10.1049/iet-com.2017.1278.
- Traunmueller, M.W.; Johnson, N.E.; Malik, A.; Kontokosta, C.E. Digital footprints: Using WiFi probe and locational data to analyze human mobility trajectories in cities. Comput. Environ. Urban Syst. 2018, 72, 4–12, doi:10.1016/j.compenvurbsys.2018.07.006.
- Hasan, S.; Schneider, C.M.; Ukkusuri, S.V.; Gonzalez, M.C. Spatiotemporal Patterns of Urban Human Mobility. J. Stat. Phys. 2013, 151, 304–318, doi:10.1007/s10955-012-0645-0.
- Ríos, S.A.; Munoz, R. Land Use detection with cell phone data using topic models: Case Santiago, Chile. Comput. Environ. Urban Syst. 2017, 61, 39–48, doi:10.1016/j.compenvurbsys.2016.08.007.
- Zhong, C.; Arisona, S.M.; Huang, X.; Batty, M.; Schmitt, G. Detecting the dynamics of urban structure through spatial net-work analysis. Int. J. Geogr. Inf. Sci. 2014, 28, 2178–2199, doi:10.1080/13658816.2014.914521.
- Zhou, X.; Yeh, A.G.; Yue, Y. Spatial variation of self-containment and jobs-housing balance in Shenzhen using cellphone big data. J. Transp. Geogr. 2018, 68, 102–108, doi:10.1016/j.jtrangeo.2017.12.006.
- Song, Y.; Huang, B.; Cai, J.; Chen, B. Dynamic assessments of population exposure to urban greenspace using multi-source big data. Sci. Total. Environ. 2018, 634, 1315–1325, doi:10.1016/j.scitotenv.2018.04.061.
- Paldino, S.; Bojic, I.; Sobolevsky, S.; Ratti, C.; González, M.C. Urban magnetism through the lens of geo-tagged photography. EPJ Data Sci. 2015, 4, 5, doi:10.1140/epjds/s13688-015-0043-3.
- Mizzi, C.; Fabbri, A.; Rambaldi, S.; Bertini, F.; Curti, N.; Sinigardi, S.; Luzi, R.; Venturi, G.; Davide, M.; Muratore, G.; et al. Unraveling pedestrian mobility on a road network using ICTs data during great tourist events. EPJ Data Sci. 2018, 7, 44, doi:10.1140/epjds/s13688-018-0168-2.
- Luo, F.; Cao, G.; Mulligan, K.; Li, X. Explore spatiotemporal and demographic characteristics of human mobility via Twitter: A case study of Chicago. Appl. Geogr. 2016, 70, 11–25, doi:10.1016/j.apgeog.2016.03.001.
- Rizwan, M.; Wanggen, W.; Cervantes, O.; Gwiazdzinski, L.; Wan, W. Using Location-Based Social Media Data to Observe Check-In Behavior and Gender Difference: Bringing Weibo Data into Play. ISPRS Int. J. Geo-Inf. 2018, 7, 196, doi:10.3390/ijgi7050196.
- Semanjski, I.; Gautama, S.; Ahas, R.; Witlox, F. Spatial context mining approach for transport mode recognition from mobile sensed big data. Comput. Environ. Urban Syst. 2017, 66, 38–52, doi:10.1016/j.compenvurbsys.2017.07.004.
- Gong, L.; Liu, X.; Wu, L.; Liu, Y. Inferring trip purposes and uncovering travel patterns from taxi trajectory data. Cartogr. Geogr. Inf. Sci. 2016, 43, 103–114, doi:10.1080/15230406.2015.1014424.
- Wang, Z.; Tu, L.; Guo, Z.; Yang, L.T.; Huang, B. Analysis of user behaviors by mining large network data sets. Futur. Gener. Comput. Syst. 2014, 37, 429–437, doi:10.1016/j.future.2014.02.015.
- Shen, J.; Cheng, T. A framework for identifying activity groups from individual space-time profiles. Int. J. Geogr. Inf. Sci. 2016, 30, 1785–1805, doi:10.1080/13658816.2016.1139119.
- Yang, J.; Li, X.; Wang, D.; Wang, J. A Group Mining Method for Big Data on Distributed Vehicle Trajectories in WAN. Int. J. Distrib. Sens. Networks 2015, 11, 756107–9, doi:10.1155/2015/756107.
- Wijesinghe, W.O.K.I.S.; Kumarasinghe, C. Relationship Among the Diameter of the Area of Influence & Refill Usage of Sri Lanka Using Anonymized Call Detail Records. ICST Trans. Scalable Inf. Syst. 2017, 4, 152104, doi:10.4108/eai.18-1-2017.152104.
- Rodríguez-Echeverría, J.; Semanjski, I.; Gautama, S.; Van De Weghe, N.; Ochoa, D. Unsupervised Hierarchical Clustering Approach for Tourism Market Segmentation Based on Crowdsourced Mobile Phone Data. Sensors 2018, 18, 2972, doi:10.3390/s18092972.
- Toader, B.; Sprumont, F.; Faye, S.; Popescu, M.; Viti, F. Usage of Smartphone Data to Derive an Indicator for Collaborative Mobility between Individuals. ISPRS Int. J. Geo-Inf. 2017, 6, 62, doi:10.3390/ijgi6030062.
- Chorley, M.J.; Whitaker, R.M.; Allen, S.M. Personality and location-based social networks. Comput. Hum. Behav. 2015, 46, 45–56, doi:10.1016/j.chb.2014.12.038.
- Alessandretti, L.; Lehmann, S.; Baronchelli, A. Understanding the interplay between social and spatial behaviour. EPJ Data Sci. 2018, 7, 36, doi:10.1140/epjds/s13688-018-0164-6.
- Zhao, Z.-D.; Yang, Z.; Zhang, Z.; Zhou, T.; Huang, Z.-G.; Lai, Y.-C. Emergence of scaling in human-interest dynamics. Sci. Rep. 2013, 3, 3472, doi:10.1038/srep03472.
- Hu, T.; Bigelow, E.; Luo, J.; Kautz, H. Tales of Two Cities: Using Social Media to Understand Idiosyncratic Lifestyles in Dis-tinctive Metropolitan Areas. IEEE Trans. Big Data 2017, 3, 55–66, doi:10.1109/tbdata.2016.2580542.
- Zhao, Z.-D.; Huang, Z.-G.; Huang, L.; Liu, H.; Lai, Y.-C. Scaling and correlation of human movements in cyberspace and physical space. Phys. Rev. E 2014, 90, 050802, doi:10.1103/physreve.90.050802.
- Zhao, Y.-M.; Zeng, A.; Xiao-Yong, Y.; Wang, W.-X.; Lai, Y.-C. Unified underpinning of human mobility in the real world and cyberspace. New J. Phys. 2016, 18, 53025, doi:10.1088/1367-2630/18/5/053025.
- Wang, H.; Kilmartin, L. Comparing Rural and Urban Social and Economic Behavior in Uganda: Insights from Mobile Voice Service Usage. J. Urban Technol. 2014, 21, 61–89, doi:10.1080/10630732.2014.888296.
- Xu, F.; Li, Y.; Chen, M.; Chen, S. Mobile cellular big data: Linking cyberspace and the physical world with social ecology. IEEE Netw. 2016, 30, 6–12, doi:10.1109/mnet.2016.7474338.
- Wu, W.; Wang, J.; Dai, T. The Geography of Cultural Ties and Human Mobility: Big Data in Urban Contexts. Ann. Am. Assoc. Geogr. 2016, 106, 612–630, doi:10.1080/00045608.2015.1121804.
- Wang, J.; Kong, X.; Rahim, A.; Xia, F.; Tolba, A.; Al-Makhadmeh, Z. IS2Fun: Identification of Subway Station Functions Us-ing Massive Urban Data. IEEE Access 2017, 5, 27103–27113, doi:10.1109/access.2017.2766237.
- Niu, N.; Liu, X.; Jin, H.; Ye, X.; Liu, Y.; Li, X.; Chen, Y.; Li, S. Integrating multi-source big data to infer building functions. Int. J. Geogr. Inf. Sci. 2017, 31, 1–20, doi:10.1080/13658816.2017.1325489.
- Zhang, S.; Wang, Z. Inferring Passenger Denial Behavior of Taxi Drivers from Large-Scale Taxi Traces. PLoS ONE 2016, 11, e0165597, doi:10.1371/journal.pone.0165597.
- Sobolevsky, S.; Sitko, I.; Combes, R.T.D.; Hawelka, B.; Arias, J.M.; Ratti, C. Cities through the Prism of People’s Spending Behavior. PLoS ONE 2016, 11, e0146291, doi:10.1371/journal.pone.0146291.
- Dong, X.; Suhara, Y.; Bozkaya, B.; Singh, V.K.; Lepri, B.; Pentland, A. ‘Sandy’ Social Bridges in Urban Purchase Behavior. ACM Trans. Intell. Syst. Technol. 2018, 9, 1–29, doi:10.1145/3149409.
- Lopez, C.; Leclercq, L.; Krishnakumari, P.; Chiabaut, N.; Van Lint, H. Revealing the day-to-day regularity of urban conges-tion patterns with 3D speed maps. Sci. Rep. 2017, 7, 1–11, doi:10.1038/s41598-017-14237-8.
- De Domenico, M.; Lima, A.; González, M.C.; Arenas, A. Personalized routing for multitudes in smart cities. EPJ Data Sci. 2015, 4, 1, doi:10.1140/epjds/s13688-015-0038-0.
- Pappalardo, L.; Simini, F. Data-driven generation of spatio-temporal routines in human mobility. Data Min. Knowl. Discov. 2018, 32, 787–829, doi:10.1007/s10618-017-0548-4.
- Xu, Y.; Gonzalez, M.C. Collective benefits in traffic during mega events via the use of information technologies. J. R. Soc. Interface 2017, 14, 20161041, doi:10.1098/rsif.2016.1041.
- Kim, D.Y.; Song, H.Y. Method of predicting human mobility patterns using deep learning. Neurocomputing 2018, 280, 56–64, doi:10.1016/j.neucom.2017.07.069.
- Bao, J.; Liu, P.; Yu, H.; Xu, C. Incorporating twitter-based human activity information in spatial analysis of crashes in urban areas. Accid. Anal. Prev. 2017, 106, 358–369, doi:10.1016/j.aap.2017.06.012.
- Chen, C.; Zhang, D.; Li, N.; Zhou, Z.-H. B-Planner: Planning Bidirectional Night Bus Routes Using Large-Scale Taxi GPS Traces. IEEE Trans. Intell. Transp. Syst. 2014, 15, 1451–1465, doi:10.1109/tits.2014.2298892.
- Ranjit, S.; Witayangkurn, A.; Nagai, M.; Shibasaki, R. Agent-Based Modeling of Taxi Behavior Simulation with Probe Vehi-cle Data. ISPRS Int. J. Geo-Inf. 2018, 7, 177, doi:10.3390/ijgi7050177.
- Chen, B.; Song, Y.; Jiang, T.; Chen, Z.; Huang, B.; Xu, B. Real-Time Estimation of Population Exposure to PM2.5 Using Mo-bile- and Station-Based Big Data. Int. J. Environ. Res. Public Heal. 2018, 15, 573, doi:10.3390/ijerph15040573.
- Gariazzo, C.; Pelliccioni, A.; Bolignano, A. A dynamic urban air pollution population exposure assessment study using model and population density data derived by mobile phone traffic. Atmos. Environ. 2016, 131, 289–300, doi:10.1016/j.atmosenv.2016.02.011.
- Mao, L.; Yin, L.; Song, X.; Mei, S. Mapping intra-urban transmission risk of dengue fever with big hourly cellphone data. Acta Trop. 2016, 162, 188–195, doi:10.1016/j.actatropica.2016.06.029.
- Kraemer, M.U.G.; Bisanzio, D.; Reiner, R.C.; Zakar, R.; Hawkins, J.B.; Freifeld, C.C.; Smith, D.L.; Hay, S.I.; Brownstein, J.S.; Perkins, T.A. Inferences about spatiotemporal variation in dengue virus transmission are sensitive to assumptions about human mobility: A case study using geolocated tweets from Lahore, Pakistan. EPJ Data Sci. 2018, 7, 1–17, doi:10.1140/epjds/s13688-018-0144-x.
- Mari, L.; Gatto, M.; Ciddio, M.; Dia, E.D.; Sokolow, S.H.; De Leo, G.A.; Casagrandi, R. Big-data-driven modeling unveils country-wide drivers of endemic schistosomiasis. Sci. Rep. 2017, 7, 1–11, doi:10.1038/s41598-017-00493-1.
- Wesolowski, A.; Buckee, C.O.; Engø-Monsen, K.; Metcalf, C.J.E. Connecting Mobility to Infectious Diseases: The Promise and Limits of Mobile Phone Data. J. Infect. Dis. 2016, 214, S414–S420, doi:10.1093/infdis/jiw273.
- Google. COVID-19 Community Mobility Reports. 2020. Available online: https://www.google.com/covid19/mobility/ (ac-cessed on 7 December 2020).
- Baidu. Baidu Qianxi—Baidu Map Huiyan. 2020. Available online: https://qianxi.baidu.com/ (accessed on 7 December 2020).
- Badr, H.S.; Du, H.; Marshall, M.; Dong, E.; Squire, M.M.; Gardner, L. Association between mobility patterns and COVID-19 transmission in the USA: A mathematical modelling study. Lancet Infect. Dis. 2020, 20, 1247–1254, doi:10.1016/s1473-3099(20)30553-3.
- Iacus, S.M.; Santamaria, C.; Sermi, F.; Spyratos, S.; Tarchi, D.; Vespe, M. Human mobility and COVID-19 initial dynamics. Nonlinear Dyn. 2020, 101, 1901–1919, doi:10.1007/s11071-020-05854-6.
- Kubota, Y.; Shiono, T.; Kusumoto, B.; Fujinuma, J. Multiple drivers of the COVID-19 spread: The roles of climate, interna-tional mobility, and region-specific conditions. PLoS ONE 2020, 15, e0239385, doi:10.1371/journal.pone.0239385.
- Santamaria, C.; Sermi, F.; Spyratos, S.; Iacus, S.M.; Annunziato, A.; Tarchi, D.; Vespe, M. Measuring the impact of COVID-19 confinement measures on human mobility using mobile positioning data. A European regional analysis. Saf. Sci. 2020, 132, 104925, doi:10.1016/j.ssci.2020.104925.
- Venter, Z.S.; Barton, D.N.; Gundersen, V.; Figari, H.; Nowell, M. Urban nature in a time of crisis: Recreational use of green space increases during the COVID-19 outbreak in Oslo, Norway. Environ. Res. Lett. 2020, 15, 104075, doi:10.1088/1748-9326/abb396.
- Jia, J.S.; Lu, X.; Yuan, Y.; Xu, G.; Jia, J.; Christakis, N.A. Population flow drives spatio-temporal distribution of COVID-19 in China. Nat. Cell Biol. 2020, 582, 389–394, doi:10.1038/s41586-020-2284-y.
- Wang, H.Y.; Yamamoto, N. Using a partial differential equation with Google Mobility data to predict COVID-19 in Arizona. Math. Biosci. Eng. 2020, 17, 4891–4904, doi:10.3934/mbe.2020266.
- Kraemer, M.; Yang, C.-H.; GutiérrezB.; Wu, C.-H.; Klein, B.; Pigott, D.M.; Du Plessis, L.; Faria, N.R.; Li, R.; Hanage, W.P.; et al. The effect of human mobility and control measures on the COVID-19 epidemic in China. Science 2020, 368, 493–497, doi:10.1126/science.abb4218.
- Gatto, M.; Bertuzzo, E.; Mari, L.; Miccoli, S.; Carraro, L.; Casagrandi, R.; Rinaldo, A. Spread and dynamics of the COVID-19 epidemic in Italy: Effects of emergency containment measures. Proc. Natl. Acad. Sci. USA 2020, 117, 10484–10491, doi:10.1073/pnas.2004978117.
- Bao, R.; Zhang, A. Does lockdown reduce air pollution? Evidence from 44 cities in northern China. Sci. Total. Environ. 2020, 731, 139052, doi:10.1016/j.scitotenv.2020.139052.
- Cheval, S.; Adamescu, C.M.; Georgiadis, T.; Herrnegger, M.; Piticar, A.; LeGates, D.R. Observed and Potential Impacts of the COVID-19 Pandemic on the Environment. Int. J. Environ. Res. Public Heal. 2020, 17, 4140, doi:10.3390/ijerph17114140.
- Bonaccorsi, G.; Pierri, F.; Cinelli, M.; Flori, A.; Galeazzi, A.; Porcelli, F.; Schmidt, A.L.; Valensise, C.M.; Scala, A.; Quattro-ciocchi, W.; et al. Economic and social consequences of human mobility restrictions under COVID-19. Proc. Natl. Acad. Sci. USA 2020, 117, 15530–15535, doi:10.1073/pnas.2007658117.
- Boulos, M.N.K.; Geraghty, E.M. Geographical tracking and mapping of coronavirus disease COVID-19/severe acute res-piratory syndrome coronavirus 2 (SARS-CoV-2) epidemic and associated events around the world: How 21st century GIS technologies are supporting the global fight against outbreaks and epidemics. Int. J. Health Geogr. 2020, 19, 8.
- Zhou, C.; Su, F.; Pei, T.; Zhang, A.; Du, Y.; Luo, B.; Cao, Z.; Wang, J.; Yuan, W.; Zhu, Y.; et al. COVID-19: Challenges to GIS with Big Data. Geogr. Sustain. 2020, 1, 77–87, doi:10.1016/j.geosus.2020.03.005.
- Mazimpaka, J.D.; Timpf, S. How They Move Reveals What Is Happening: Understanding the Dynamics of Big Events from Human Mobility Pattern. ISPRS Int. J. Geo-Inf. 2017, 6, 15, doi:10.3390/ijgi6010015.
- Song, X.; Shibasaki, R.; Yuan, N.J.; Xie, X.; Li, T.; Adachi, R. DeepMob. ACM Trans. Inf. Syst. 2017, 35, 1–19, doi:10.1145/3057280.
- Bogomolov, A.; Lepri, B.; Staiano, J.; Letouzé, E.; Oliver, N.; Pianesi, F.; Pentland, A. Moves on the Street: Classifying Crime Hotspots Using Aggregated Anonymized Data on People Dynamics. Big Data 2015, 3, 148–158, doi:10.1089/big.2014.0054.
- Kadar, C.; Pletikosa, I. Mining large-scale human mobility data for long-term crime prediction. EPJ Data Sci. 2018, 7, 26, doi:10.1140/epjds/s13688-018-0150-z.
- Kong, X.; Liu, Y.; Wang, Y.; Tong, D.; Zhang, J. Investigating Public Facility Characteristics from a Spatial Interaction Per-spective: A Case Study of Beijing Hospitals Using Taxi Data. ISPRS Int. J. Geo-Inf. 2017, 6, 38, doi:10.3390/ijgi6020038.
- Giordani, I.; Archetti, F.; Candelieri, A. Data Science and Environmental Management in Smart Cities. Environ. Eng. Manag. J. 2015, 14, 2095–2102, doi:10.30638/eemj.2015.224.
- Ardanuy, J.F.; Castano-Solis, S.; Álvaro-Hermana, R.; Merino, J.; Castillo, Á. Using mobility information to perform a feasi-bility study and the evaluation of spatio-temporal energy demanded by an electric taxi fleet. Energy Convers. Manag. 2018, 157, 59–70, doi:10.1016/j.enconman.2017.11.070.
- Guo, Q.; Karimi, H.A. A novel methodology for prediction of spatial-temporal activities using latent features. Comput. En-viron. Urban Syst. 2017, 62, 74–85, doi:10.1016/j.compenvurbsys.2016.10.006.

