
1. Introduction
The White Sea is unique; it belongs completely to Russia, serves as gates to the Arctic, and it can be considered as a model of the Arctic[1]. The area is estimated as 91000 sq.km, maximal depth estimations vary from 293m to 350m. The volume of water is 5400 cub.km. Some bays are very shallow: e.g. Onega bay is 20m deep and Mezenskiy Bay is just 13m, on the average. Gorlo is a narrow shallow strait that connects two parts of the sea. It is at most 55km wide and not more than 37m deep. Figure 1 shows the White Sea bathymetry according to ETOPO (https://www.ngdc.noaa.gov/mgg/global/) with main rivers and main parts of the Sea.
The White Sea has been playing an important role for Russia for ages. As it is an inner sea, its resources were initially mostly used by the people who lived at its coast. This group of people is called pomors; they were rather isolated, built special ships, developed fishing gear and methods of hunting the sea animals, and learned to navigate in the harsh boreal conditions. This knowledge allowed pomors to travel out of the White Sea far to the north, up to the Spitsbergen (also known as Svalbard) and Novaya Zemlya archipelago in the Kara Sea. Therefore, the White Sea was the starting point of exploring the Arctic, as far as 500 years ago.
During the Soviet time, the White Sea-Baltic Canal was built and cargo shipping along the Northern Sea Route was launched. The White Sea became an important transport hub and it also remained important for fishing, essential for the economy of the country. Besides the fish, algae and molluscs were also harvested. Deposits of various metals, including precious, and diamonds were discovered.
The amount of data accumulated for the White Sea is rather decent, but there is a lack of coupled comprehensive numerical models adjusted for the sea.
Data can be obtained either in situ (from vessels, autonomous gliders or buoys) or by remote sensors[2]. Some estimates can be obtained by numerical models. However, in order to verify and tune a model, as well as for initial and boundary data, measured data are still necessary.
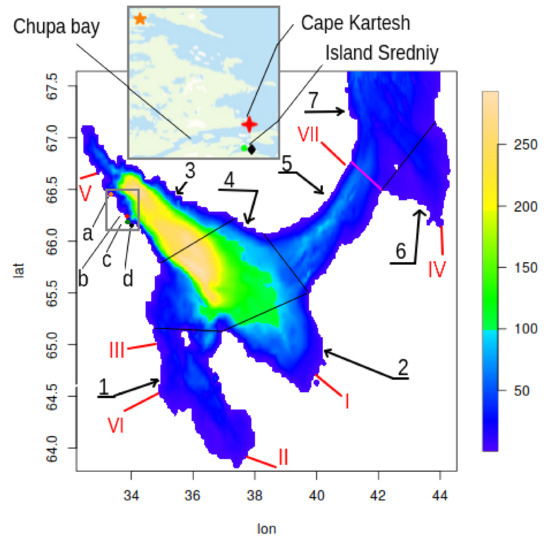
Figure 1. The White Sea bathymetry. The colour shows the depth in metres. Black lines are boundaries of the bays marked by arabic numbers: 1—Onega Bay, 2—Dvinskiy Bay, 3—Kandalakshskiy Bay, 4—Bassein, 5—Gorlo, 6—Mezenskiy Bay, 7—Voronka. The pink line separates Voronka and Gorlo. Red roman numbers mark the main rivers: I—Northern Dvina, II—Onega, III—Kem, IV—Mezen, V—Kovda, VI—Nizhniy Vyg (part of the White Sea-Baltic Canal), VII—Ponoy. Letters a-d mark positions of biological stations: a—Moscow State University, b—Zoological Institute of the Russian Academy of Sciences, c—Saint-Petersburg University, d—Kazan University; the incut shows part of the Kandalakshskiy Bay with the stations in detail.
2. In Situ Data
Obtaining in situ data in the White Sea is not easy. Regular seasonal measurements in all areas of the sea are not carried out due to various reasons, although the White Sea is internal and logistically convenient enough for organizing expeditions. Nevertheless, there are either fragmentary observations obtained in expeditions, or permanent long-term observations carried out at biological stations, and so are concentrated on a relatively small part of the south-west coast of the Kandalakshskiy Bay (Figure 1). Besides, measurements in expeditions are carried out with different equipment, irregularly in time (usually from June to August), at different depth levels, and they are quite sporadic spatially. Hence, it is difficult to extrapolate such data and compare measurement series with each other. There is more data for the sea surface than for the water column.
However, this does not mean that there are no acceptable resources for modelling circulation and biogeochemical dynamics in the White Sea. Regular observations in the water area are carried out by the institutions of the Federal Service for Hydrometeorology and Environmental Monitoring (Roshydromet), Federal Fishing Agency, as well as the Ministry of Transport. The Ministry of Defense is also carrying out work. However, for obvious reasons, access to such data is strictly regulated for scientific organizations.
Most of the in situ data are obtained by the Federal Service for Hydrometeorology (Roshydromet) during expeditions. Besides water temperature and salinity, data on biogeochemical tracers in the water column are collected at different times of the year and include the so-called secular sections. Roshydromet conducts observations on a standard grid of hydrometeorological stations [3] according to standard methods. These measurements are regular, long-term, and well-structured. Information about the ice regime, characteristics of the runoff of rivers flowing into the sea is available, as well as meteorological data. These observations are also performed at standard stations. The main obstacle to the use of Roshydromet data is that access to them is commercial, even at the official request of scientific institutions. Only a part of these materials can be obtained free of charge through the Obninsk World Data Centre (http://meteo.ru/english/index.php), which is part of the Roshydromet structure and is its main institution for the accumulation, storage, and processing of hydrometeorological information. This organization publishes regional directories, catalogues, creates open electronic resources, but access to a significant part of the data is also not free.
The data of the Zoological Institute of the Russian Academy of Sciences obtained at the biological station near Cape Kartesh (http://www.zin.ru/kartesh/) (see Figure 1) are useful for simulating the White Sea. Measurements are carried out at the ten-day station D-1 (66°20.230′ N; 33°38.972′ E) for several decades, every 10 days from May to October. Temperature and salinity are measured in the water column at several depth levels from 0 to 65 m (since 2010 continuous profiling of the water column with a CTD probe is done), concentrations of biogenic elements, abundance of zooplankton, and, from time to time, phytoplankton are measured. In winter, observations are also conducted here, but much less frequently (once a month or two, depending on the ice conditions). During summer the deep-water station in the central part of the Kandalakshskiy Bay is available. All these data are kept in an electronic database (http://www.st.nmfs.noaa.gov/copepod/time-series/ru-10101/) Access is possible through an agreement with the Institute. Some data have been obtained in a joint project with the American National Oceanic and Atmospheric Administration (http://www.noaa.gov/) (NOAA) and are now available in electronic form on the NOAA website (https://www.nodc.noaa.gov/OC5/WH_SEA/WWW/HTML/atlas.html ).
Educational stations of universities make a significant contribution to the knowledge about the White Sea gathering in situ data; they are also located on the south-west coast of the Kandalakshskiy Bay (see Figure 1). The biological station (http://www.wsbs-msu.ru/) of the Moscow State University is located north to the Chupa Bay (66°34′ N, 33°08′ E). The marine biological station (http://spbu.ru) of St. Petersburg State University is at 66°17′21″ N, 33°39′41″ E and the station (http://kpfu.ru) of the Kazan Federal University is located on the island Sredniy. Hydrophysical and biogeochemical parameters are also measured. In addition to measurements done at the stations, all three universities organize expeditions in the White Sea (for example,[4][5]), and contribute databases of hydrological and biogeochemical data. Most of these databases are copyrighted.
Yearly expeditions are also carried out by P.P. Shirshov’s Oceanology Institute (https://ocean.ru/) of Russian Academy of Sciences and its Saint-Petersburg branch[6][7][8][9] [7,8,9,10].
Student training expeditions by Russian State Hydrometeorological University (http://www.rshu.ru/) in the White Sea collected a significant multi-year amount of data on temperature, salinity, and currents of the sea.
The data of the Murmansk Marine Biological Institute (http://www.mmbi.info/) of the Kola Science Centre of the Russian Academy of Sciences (MMBI KSC RAS) contain information on ship in situ measurements of temperature and salinity, starting from 1891, in different seasons and different years. Besides, much expedition data on ecosystem indicators (biogenic elements, distribution of chlorophyll a, etc.) have been assembled here. The joint project of MMBI KSC RAS and NOAA “Climatic Atlas of the Arctic Seas 2004: Part I. Database of the Barents, Kara, Laptev, and White Seas—Oceanography and Marine Biology” (https://permanent.fdlp.gov/lps118727/english58.pdf) presents temperature and salinity maps of the White and Barents Seas together; this is important for setting the boundary conditions in numerical models.
Expedition data of the Northern Water Problems Institute (http://water.krc.karelia.ru/) of the Karelian Research Centre of the Russian Academy of Sciences, obtained in joint research projects with many organizations, are also useful for tuning numerical models. The following research programs of the last twenty years are worth mentioning: Federal Research Program “World Ocean”, INCO-Copernicus, INTAS, Russian Foundation for Basic Research projects. The data on the temperature and salinity of the White Sea water and concentration of biogen matter and chlorophyll-a at various depth levels in different regions from the year 2000 up to today has been collected in a database; most measurements were made in ice-free periods (although some data was collected during winter). All these data are contained in an off-line database [10] and are available on request.
Data of the Institute of Northern Environmental Problems (http://fciarctic.ru/index.php?page=iepn) of the Ural Branch of the Russian Academy of Sciences in Arkhangelsk are of special interest. They have accumulated data on thermohydrodynamics, hydrochemistry, and ecology of the White Sea. Measurements on the mouth of the river Northern Dvina and Dvinskiy Bay as a whole, as well as Onega Bay, are added yearly.
The N.M. Knipovich Northern Polar Scientific Research Institute (http://www.pinro.ru/15/index.php/structure/sevpinro#) of Marine Fisheries and Oceanography, an institution of the Federal Agency for Fishery in Arkhangelsk, has accumulated data on the catches of algae, fish, and marine mammals in the White Sea. A significant part of the expeditionary work carried out by this Institute refers to monitoring, so it is done regularly. However, access to these materials for other organizations is strictly regulated.
Data on river runoff into the White Sea are possessed by Roshydromet (http://www.r-arcticnet.sr.unh.edu/v4.0/index.html); among the free sources, the most convenient seems to be R-ArcticNET: it contains data on river discharge, including the Northern Dvina, Onega, Mezen, Kovda, Ponoy, White Sea-Baltic Canal starting from 1999 (earlier for some rivers).
3. Remote Sensing Data
Satellites provide a significant amount of the White Sea data. For example, the online resource of Oceanology Institute (http://optics.ocean.ru) by O.V. Kopelevich et al., provides information on the distribution of surface temperature, suspended and yellow matter, backscatter coefficient, chlorophyll a for the warm season. Some of the satellite data (distribution of temperature and chlorophyll a) were obtained in 2009 during joint work by the NWPI (http://water.krc.karelia.ru/) of Karelian Research Centre of RAS and the Nansen’s International Centre for the Environment and Remote Sensing (http://www.niersc.spb.ru/home.html). All of these measurements are contained in the database [10]. A survey of ocean remote sensing in USSR and Russia is given in [11].
Due to climatic conditions, data are available for May–September[12]. Temperature measurements are accurate enough if the sky is clear. However, ice concentration can be estimated well in winter, provided that there are no clouds. With chlorophyll, the remote sensor data reliability is the most questionable. Standard algorithms may produce large errors due to strong river discharge, turbid water, and an abundance of optically active matter. This is typical for the Arctic region, but even more important for the White sea (4% of the volume discharged by rivers yearly, the euphotic layer is 10–15 m). The regional algorithm has been developed [12], but it is not reliable enough due to the low number of in situ control measurements: 68 pairs of concurrent in situ and satellite. In[13], a very high variability of chlorophyll a is reported (see Table 2 there). For instance, for June 2008 the range was from 0.27 to 9.17, for 80 measurements. Also, the station measurement (Figure 1 in the paper) reports 2–2.5 μg/L, while the satellite data in the neighbourhood is 1.5–1.7 and 1.7–2. However, the data maps (http://optics.ocean.ru) give no less than 2 μg/L in most of the sea. The paper[4] reports other values for the chlorophyll (μg/L, see Table 3): 0.727 for the Onega Bay (10 stations) and 0.702 for the Chupa Bay (5 stations). Additionally, chlorophyll a concentration was between 1.9 and 9.8 μg/L in the Dvinskiy Bay and between 0.54 and 1.16 μg/L in the Onega Bay in 1991, according to the book[3]. The regional algorithm uses averaging over squares and long time periods (one month or even a year), which relies on the mean of instant measurements of concentration. However, the atlas (http://optics.ocean.ru) is already a decent result and the best possible to be offered for such a complex region as the White Sea. The qualitative distribution of chlorophyll during the productive season is reproduced well.
Many satellite data sources are free and open, and, therefore, rather available: e.g., NOAA (https://www.nnvl.noaa.gov/view/globaldata.html), NASA (https://oceancolor.gsfc.nasa.gov), and Scanex (http://new.scanex.ru/). Let us mention the research centre for space hydrometeorology “Planeta” (http://planet.iitp.ru) and the satellite data centre ESIMO (mentioned above (http://www.esimo.ru/atlas/Beloe/1_1.html). For the ice situation in the White Sea, the “Multimaps” (https://multimaps.ru) is convenient. It gets data from satellites Terra, Aqua, and Suomi NPP, for a chosen date. A bathymetry map and animated wind, wave, and cloud maps are offered, as well as a short-term forecast of the state of the water surface and weather.
Reference data of the Russian Maritime Register of Shipping [14] are useful for setting up mathematical models. It includes typical wind speeds and wave heights for different seasons, expected frequencies of extreme events for different periods, including 30-year and secular. Note that the NCEP/NCAR reanalysis is used in addition to the collected data.
The NCEP/NCAR reanalysis is NOAA (National centre for Environmental Forecasting and National Centre for Atmospheric Research) meteorological data, for the entire globe on a regular grid, starting from 1948, with the six-hour time step. This dataset (atmospheric pressure fields, wind, air temperature, etc.) is updated monthly and it is freely available (https://rda.ucar.edu/datasets/ds090.0/#!description) to researchers. NCEP/NCAR data are one of the most commonly used by numerical sea models. A summary of resources providing reanalysis data is available on the NCAR/UCAR (https://climatedataguide.ucar.edu/climate-data/atmospheric-reanalysis-overview-comparison-tables) and the University of Hamburg (http://icdc.cen.uni-hamburg.de/projekte/easy-init/easy-init-ocean.html) pages.

