| Version | Summary | Created by | Modification | Content Size | Created at | Operation |
|---|---|---|---|---|---|---|
| 1 | Christopher Collins | + 1114 word(s) | 1114 | 2020-04-17 18:58:17 | | | |
| 2 | Vicky Zhou | -188 word(s) | 926 | 2020-10-30 04:48:38 | | | | |
| 3 | Catherine Yang | Meta information modification | 926 | 2020-11-05 11:26:54 | | |
Video Upload Options
TNF is a gene that plays an essential role in the body, it affects both immune response and inflammation. The gene encodes a protein called tumour necrosis factor alpha (TNFα) [1].
1. Introduction
TNFα is a cell signalling protein known as a cytokine, produced by multiple parts of the immune system such as macrophages, natural killer cells, mast cells and neutrophils. Polymorphisms in the TNF gene can cause an inappropriate production of TNFα, which has been associated with a number of health conditions such as irritable bowel syndrome (IBS), asthma, Crohn’s disease, COPD, lymphoma, lupus, sarcoidosis, headaches/migraines and poor muscle recovery post exercise[2].
TNFα is predominantly responsible for cell regulation within the immune system and works in tandem with IL-6 and IL-1, the effects of TNFα include the removal of pathogens, inflammation, fever and appetite suppression.
The polymorphism rs1800629 has been associated with multiple conditions, those with the less common “A” allele are associated with higher levels of TNFα than those with the more common “G” allele, this increase is believed to cause higher inflammation and to some extent autoimmune problems.
2. Aims & Methods
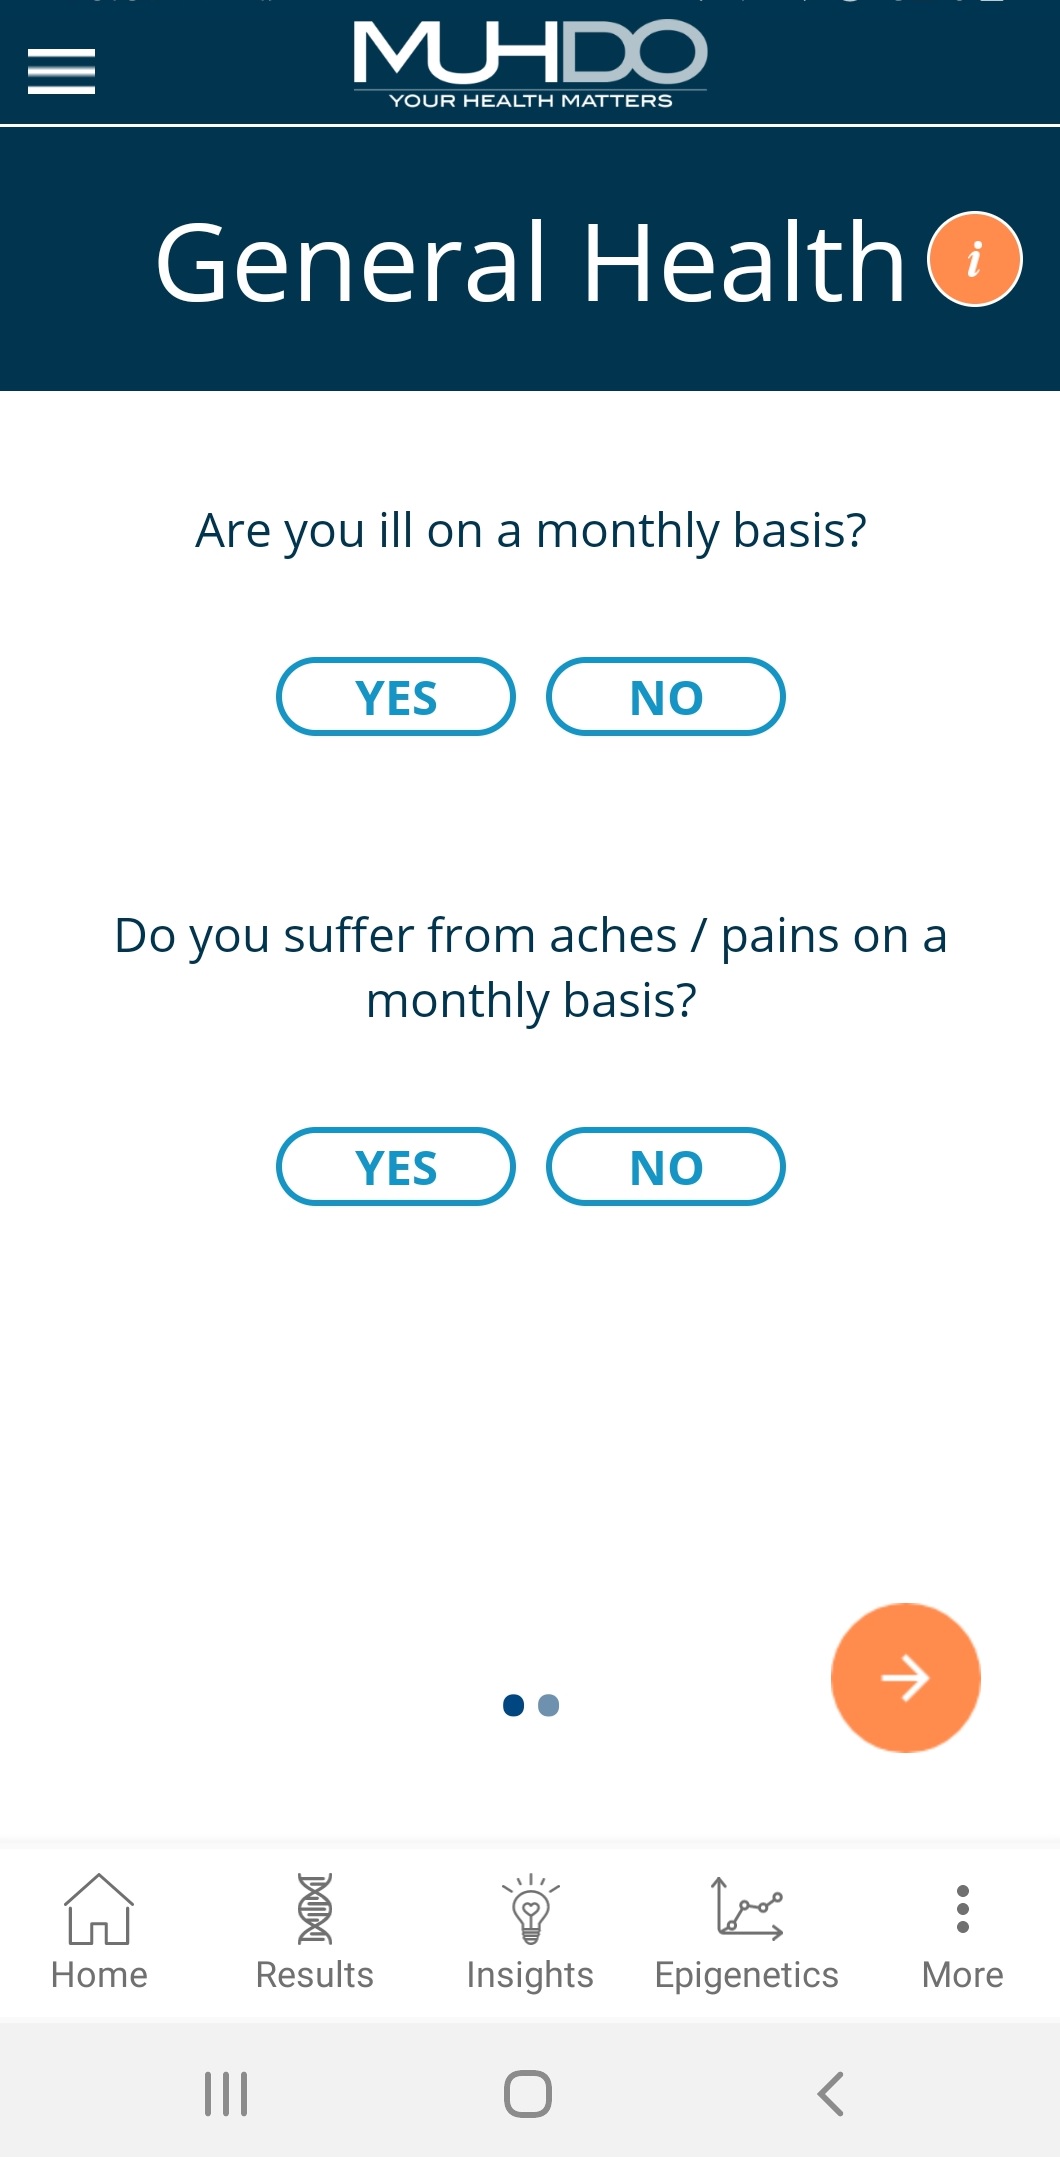
The aim of this study is to discover if there are any correlations between self-reported illness and/or muscular pains and the variations of rs1800629 (TNF). 104 Caucasian females (30-45y/o) with no conflicting prior diagnosis of pathology were tested under a custom Illumina array in conjunction with the Muhdo Health Ltd mobile app, this array analyses 1000 SNPs, one of which is rs1800629 that was read in the forward/forward orientation. The Muhdo app has preinstalled questions within to better understand each client. The questions used for this study were:
“Are you ill on a monthly basis? Yes/No or Y/N”
“Do you suffer from aches/pains on a monthly basis? Yes/No or Y/N”
Picture 1. Muhdo app screen.
3. Results
The questionnaire and polymorphism results are tabled below:
Table 1. Results.
|
rs1800629, FEMALE, BRITISH-CAUCASIAN, 30-45 |
Are you ill on a monthly basis? Y/N |
Do you suffer from aches/pains on a monthly basis? Y/N |
|
GG |
N |
N |
|
GG |
N |
N |
|
GG |
N |
N |
|
GG |
N |
N |
|
GG |
N |
N |
|
GG |
N |
N |
|
GG |
N |
N |
|
GG |
N |
N |
|
GG |
N |
N |
|
GG |
Y |
N |
|
GG |
Y |
N |
|
GG |
N |
N |
|
GG |
Y |
Y |
|
GG |
N |
N |
|
GG |
N |
N |
|
GG |
N |
N |
|
GG |
N |
N |
|
GG |
N |
N |
|
GG |
N |
N |
|
GG |
N |
N |
|
GG |
N |
N |
|
GG |
N |
N |
|
GG |
N |
N |
|
GG |
Y |
N |
|
GG |
N |
N |
|
GG |
N |
N |
|
GG |
N |
Y |
|
GG |
N |
N |
|
GG |
N |
N |
|
GG |
N |
N |
|
GG |
N |
N |
|
GG |
N |
N |
|
GG |
N |
N |
|
GG |
N |
N |
|
GG |
N |
N |
|
GG |
N |
N |
|
GG |
Y |
N |
|
GG |
N |
N |
|
GG |
Y |
N |
|
GG |
N |
N |
|
GG |
Y |
N |
|
GG |
Y |
N |
|
GG |
Y |
N |
|
GG |
Y |
N |
|
GG |
Y |
N |
|
GG |
Y |
N |
|
GG |
N |
N |
|
AG |
N |
N |
|
AG |
Y |
N |
|
AG |
Y |
N |
|
AG |
Y |
N |
|
AG |
Y |
N |
|
AG |
Y |
N |
|
AG |
N |
Y |
|
AG |
N |
Y |
|
AG |
N |
Y |
|
AG |
Y |
Y |
|
AG |
N |
N |
|
AG |
Y |
Y |
|
AG |
Y |
Y |
|
AG |
Y |
Y |
|
AG |
Y |
N |
|
AG |
N |
Y |
|
AG |
N |
Y |
|
AG |
Y |
N |
|
AG |
Y |
N |
|
AG |
Y |
N |
|
AG |
Y |
N |
|
AG |
Y |
N |
|
AG |
Y |
N |
|
AG |
Y |
N |
|
AG |
Y |
N |
|
AG |
Y |
N |
|
AG |
Y |
N |
|
AG |
N |
N |
|
AG |
N |
N |
|
AG |
N |
N |
|
AA |
Y |
N |
|
AA |
Y |
N |
|
AA |
Y |
N |
|
AA |
Y |
N |
|
AA |
Y |
Y |
|
AA |
Y |
Y |
|
AA |
Y |
Y |
|
AA |
N |
Y |
|
AA |
N |
Y |
|
AA |
Y |
Y |
|
AA |
Y |
Y |
|
AA |
Y |
Y |
|
AA |
Y |
N |
|
AA |
Y |
N |
|
AA |
Y |
Y |
|
AA |
Y |
Y |
|
AA |
Y |
Y |
|
AA |
Y |
Y |
|
AA |
Y |
Y |
|
AA |
Y |
N |
|
AA |
Y |
N |
|
AA |
N |
Y |
|
AA |
N |
Y |
|
AA |
Y |
Y |
|
AA |
Y |
Y |
|
AA |
Y |
Y |
|
AA |
Y |
Y |
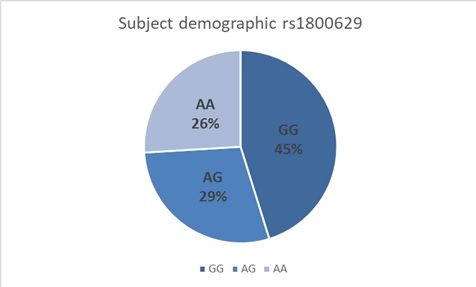
The results show that 47 subjects had GG, 30 had AG and 27 had AA.
Graph 1. Subject % demographic.
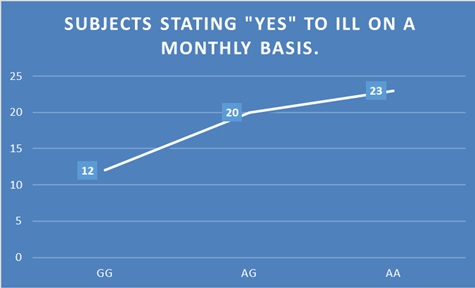
In the ill on a monthly basis category 55 subjects answered Y, those with GG (n=47) answered Y 12 times which made up 25.53% of that group and 11.53% of the total (104) group. Those with AG (n=30) answered Y 20 times which made up 66.66% of that group and 19.23% of the total (104) group. Those with AA (n=27) answered Y 23 times which made up 85.18% of that group and 22.11% of the total (104) group.
Graph 2. Monthly illness graph.
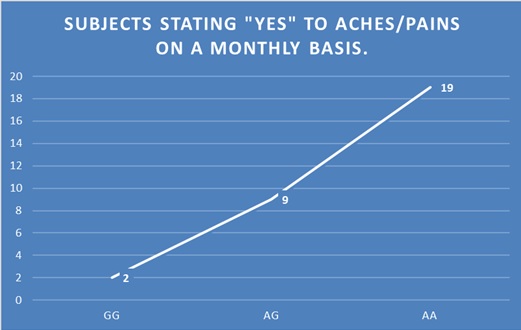
In the monthly aches/pains category 30 subjects answered Y, those with GG (n=47) answered Y twice which made up 4.25% of that group and 1.92% of the total (104) group. Those with AG (n=30) answered Y 9 times which made up 30% of that group and 8.65% of the total (104) group. Those with AA (n=27) answered Y 19 times which made up 70.37% of the group and 18.26% of the total (104) group.
Graph 3. Aches/Pains graph.
4. Conclusion
The results show that those with at least one “A” variant in rs1800629 are at more risk of becoming ill more frequently and suffering with more aches and pains on a monthly basis, those who are homozygotes (A/A) are less common but appear to have the most risk of suffering frequent illness and aches/pain.
A far larger subject size is required to form concrete correlations, as are more in depth questions, however this preliminary look at data gathered from an app shows potential further study into rs1800629 and its association with the frequency of illness and pain.
*This is a preliminary search for correlations to allow for further study.
References
- Idriss H.T, Naismith J.H.; TNF alpha and the TNF receptor superfamily: structure-function relationship(s). Microsc Res Tech 2000, 50(3), 184-95, DOI: 10.1002/1097-0029.
- Philipp Baumert; Mark J. Lake; Claire Stewart; Barry Drust; Robert M Erskine; Genetic variation and exercise-induced muscle damage: implications for athletic performance, injury and ageing. European Journal of Applied Physiology 2016, 116, 1595-1625, 10.1007/s00421-016-3411-1.


