 +1 credit
| Version | Summary | Created by | Modification | Content Size | Created at | Operation |
|---|---|---|---|---|---|---|
| 1 | Christopher Collins | -- | 1187 | 2025-08-30 20:15:43 | | | |
| 2 | Christopher Collins | Meta information modification | 1187 | 2025-08-30 20:17:12 | | | | |
| 3 | Catherine Yang | -11 word(s) | 1176 | 2025-09-02 10:44:48 | | | | |
| 4 | Christopher Collins | + 24 word(s) | 1200 | 2025-09-03 15:52:20 | | |
Video Upload Options
DNA methylation-based epigenetic clocks are powerful tools for quantifying biological ageing and detecting health-related ageing acceleration. Building on recent work introducing a cost-effective saliva-based 10-CpG methylation clock, this study evaluates its performance and biological relevance across five cohorts: Excellent Health, Fatigue, Fibromyalgia, Dementia, and Colon Cancer. Using cohort-level regression models, CpG–age association testing, and methylation profiling, we examined both age-prediction accuracy and disease-related methylation patterns.
The clock demonstrated high accuracy across all cohorts (Pearson r = 0.77–0.86, R² = 0.60–0.75, MAE ≈ 5–6 years), closely matching the validation performance reported in the original study. Disease cohorts exhibited significant epigenetic age acceleration, with mean predicted ages +8–12 years older than chronological age, while the Excellent Health group showed a modest negative deviation (≈ −5 years). CpG-level ANOVA revealed ELOVL2 (cg16867657) as the strongest age-associated marker, alongside CHGA, OTUD7A, PRLHR, and LHFPL4, highlighting key roles for lipid metabolism, neuroendocrine signalling, and proteostasis in ageing biology.
Together, these findings confirm that a minimal 10-CpG clock can robustly capture biological age, distinguish health status, and provide mechanistic insight into chronic disease and ageing processes. This compact assay offers a scalable and clinically relevant biomarker platform for population health monitoring, risk stratification, and personalised health interventions.
1. Introduction
The saliva-based 10-CpG epigenetic clock model from Collins et al. (2025) was analysed against multiple DNA methylation datasets. This clock uses a linear combination of methylation levels at 10 CpG sites to predict DNA methylation age (DNAm age). All 10 selected CpGs show age-related increases in methylation (hypermethylation) [1]. In this analysis, we used the published 10-CpG linear model coefficients (fitted on a large healthy training set) to compute DNAm ages for each individual. We then calculated age acceleration as the difference between DNAm age and the individual’s chronological age. A positive age acceleration means the person’s epigenetic age is higher than expected for their chronological age (accelerated aging), whereas a negative value indicates a younger epigenetic age than expected (age deceleration).
Each individual in the dataset belongs to one of five cohorts: Dementia (diagnosed with dementia), Colon Cancer, Fibromyalgia, High Fatigue (subjective fatigue 10/10), or Excellent Health (no pathologies, healthy lifestyle). We computed DNAm age and age acceleration for all individuals and then examined results by cohort.
2. Statistics
For each cohort, we first determined the average chronological age, average DNAm age, and mean age acceleration (DNAm age – chronological age), analyse the correlation and MAE of each.
Excellent Health Cohort — N=1369
r=0.864, R²=0.746, MAE=5.11y, RMSE=6.48y
Fatigue Cohort — N=570
r≈0.836, R²≈0.699, MAE≈5.27y, RMSE≈7.07y
Colon cancer — N=244
r=0.812, R²=0.660, MAE=5.58y, RMSE=7.05y
Dementia Cohort — N=436
r=0.774, R²=0.599, MAE=5.56y, RMSE=7.42y
Fibromyalgia — N=58
r=0.791, R²=0.625, MAE=5.92y, RMSE=8.15y
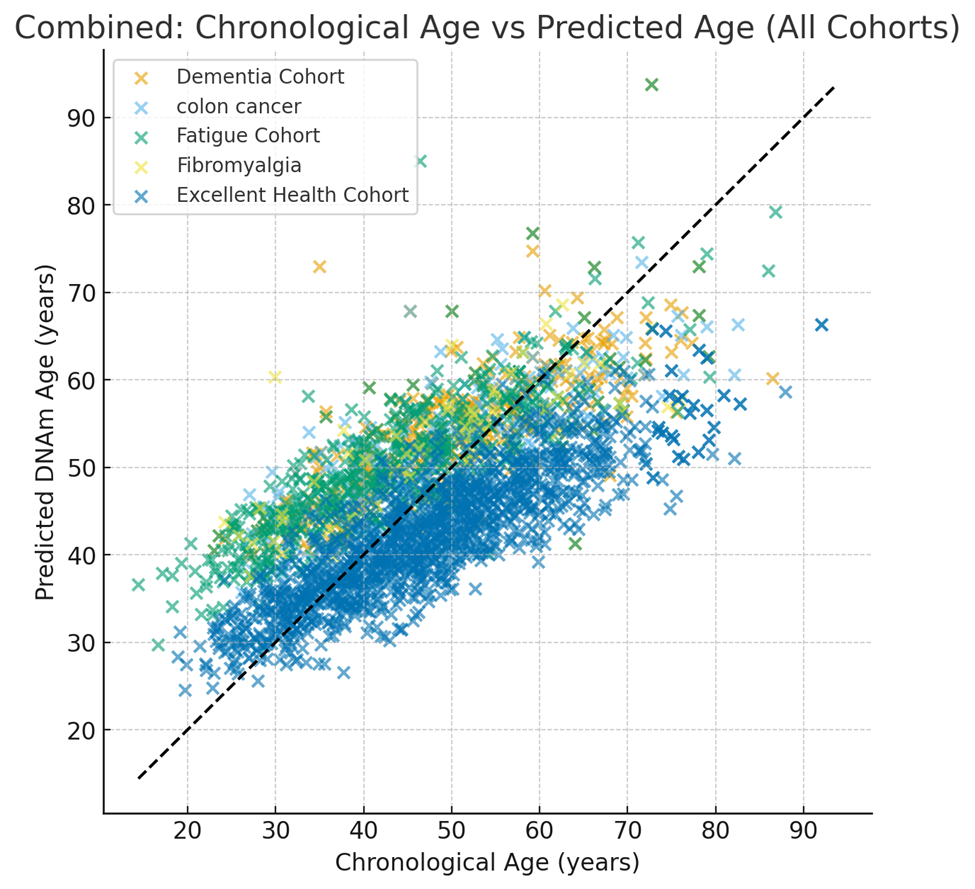
Figure 1. Scatter plot chart shows how those in excellent health have stronger hypomethylation vs. the pathological groups indicating a lower biological age in individuals free of illness.
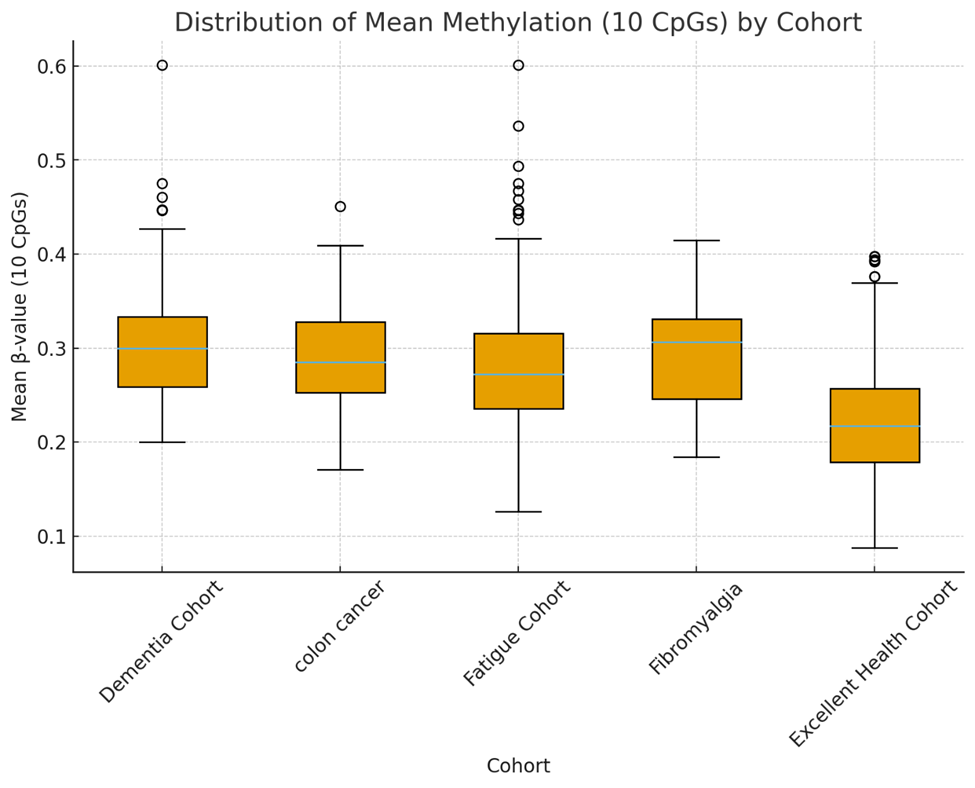
Figure 2. The differences in mean methylation in varying cohorts which also shows lower variability in the excellent health cohort (R²=0.746 vs. 0.6~).
Table 1. Chronological Age Means per group
|
Cohort |
Mean Chronological Age (years) |
Sample Size (N) |
|
Dementia Cohort |
49.04 |
436 |
|
Colon Cancer |
48.03 |
244 |
|
Fatigue Cohort |
43.33 |
570 |
|
Fibromyalgia |
48.09 |
58 |
|
Excellent Health Cohort |
47.35 |
1,369 |
Table 2. Pairwise t-test Findings (Predicted − Chronological Age).
|
Comparison |
Mean Difference (yrs) |
p-value (significance) |
Interpretation |
|
Fatigue vs Excellent Health |
+11.7 yrs |
4.1×10⁻¹⁵² |
Fatigue cohort is ~11.7 years “older” epigenetically than the Excellent Health group. |
|
Dementia vs Excellent Health |
+9.2 yrs |
7.6×10⁻⁸² |
Dementia group shows significant acceleration (~9 years older). |
|
Colon cancer vs Excellent Health |
+8.9 yrs |
2.9×10⁻⁴⁶ |
Colon cancer cohort also accelerated (~9 years). |
|
Fibromyalgia vs Excellent Health |
+9.6 yrs |
2.0×10⁻¹¹ |
Fibromyalgia group also shows strong acceleration. |
|
Dementia vs Fatigue |
-2.5 yrs |
1.9×10⁻⁷ |
Fatigue cohort slightly higher acceleration than Dementia group. |
Table 3. Most altered CpG sites between cohorts.
|
CpG ID |
Associated Gene(s) |
F-statistic |
p-value |
Interpretation |
|
cg16867657 (ELOVL2) |
Lipid metabolism, ageing hallmark |
7.80 |
3×10⁻⁶ |
Strongest cohort discriminator, confirming its critical role in biological ageing. |
|
cg21620282 (CHGA) |
Neuroendocrine regulation |
7.37 |
7×10⁻⁶ |
Highlights stress/endocrine pathway involvement. |
|
cg04875128 (OTUD7A) |
Protein turnover & neural development |
6.86 |
1.7×10⁻⁵ |
Suggests proteostasis dysregulation in disease groups. |
|
cg11705975 (PRLHR) |
Hormonal receptor, feeding/stress response |
6.04 |
7.8×10⁻⁵ |
Neuroendocrine signal of ageing. |
|
cg12841266 (LHFPL4) |
Synaptic regulation |
5.78 |
1.3×10⁻⁴ |
Possible neurocognitive linkage. |
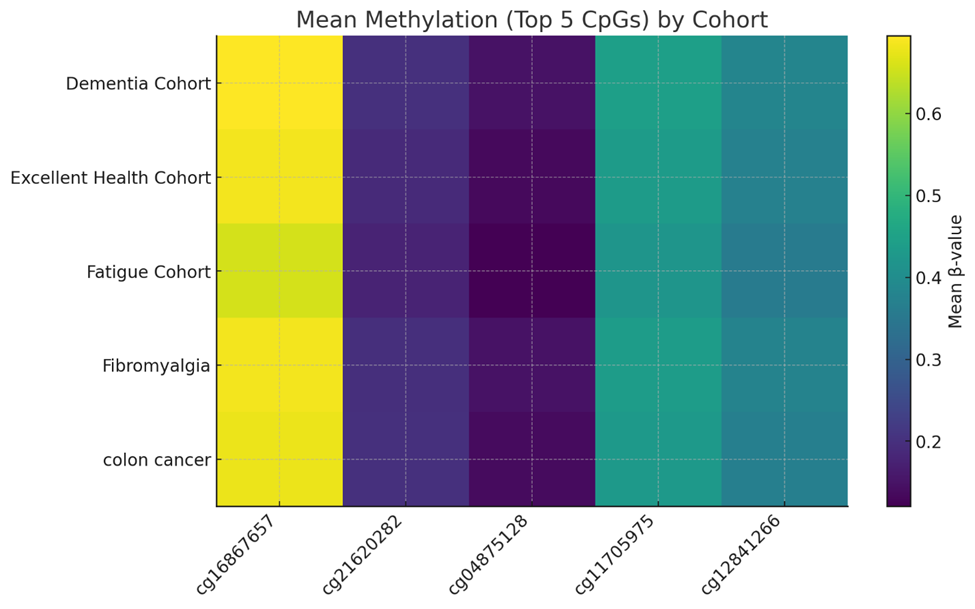
Figure 3. Heatmap on CpG sites.
3. Conclusion & Summary
Using a cost-effective 10-CpG saliva clock, we found clear evidence that health status influences epigenetic aging rates. This analysis reinforces the 10 CpG clock conclusion that a small, carefully selected panel of CpGs can capture powerful biological ageing signals. ELOVL2 (cg16867657) stands out as the dominant marker, strongly correlating with chronological age and separating healthy from disease cohorts, consistent with its known role in lipid metabolism and retinal ageing. Other top CpGs such as CHGA (cg21620282) and PRLHR (cg11705975) highlight the involvement of neuroendocrine pathways, while OTUD7A and LHFPL4 point toward protein homeostasis and synaptic regulation. Together, these methylation sites form a compact, multi-system fingerprint of biological ageing, linking metabolic, hormonal, and neuronal processes to DNA methylation drift.
Cohort comparisons reveal significant epigenetic age acceleration in individuals with fatigue, dementia, fibromyalgia, and colon cancer, ranging from +8 to +12 years compared to the Excellent Health group, which itself appears ~5 years biologically younger. This demonstrates that the 10-CpG clock is not only a precise age predictor but also sensitive to disease-related biological stress. The increased methylation variability and elevation in disease cohorts likely reflect systemic inflammation, chronic stress, and metabolic dysregulation, which accelerate methylation changes over time. These findings align with previous research but show that such insights can be achieved with a minimal, cost-effective assay.
The results position this clock as a valuable biomarker for health span monitoring and early disease detection. The methylation differences seen here suggest that age acceleration signatures could be leveraged to stratify disease risk or track intervention efficacy. By anchoring on loci like ELOVL2, CHGA, and OTUD7A, this assay captures fundamental biological ageing mechanisms, confirming its utility for population health studies, clinical screening, and personalised health analytics.
4. Biological Age Acceleration and Its Implications
The analysis shows that individuals in the Fatigue, Fibromyalgia, Dementia, and Colon Cancer cohorts are epigenetically 8–12 years older than their chronological age. This acceleration reflects widespread biological stress and dysregulation, including altered lipid metabolism, chronic inflammation, neuroendocrine disruption, and reduced proteostasis, as indicated by methylation shifts at loci such as ELOVL2, CHGA, OTUD7A, and PRLHR. Biological ageing at this scale is not simply a marker of chronological time but a signal of cumulative cellular and systemic damage, which can predispose individuals to earlier onset of age-related conditions.
Accelerated biological age has been consistently linked in the literature to shortened health span and lifespan, increased frailty, and higher risk of chronic illnesses such as cardiovascular disease, diabetes, neurodegenerative disorders, and cancer. The methylation patterns observed here align with those pathways, suggesting that these individuals may experience earlier decline in physiological resilience, reduced capacity for stress recovery, and a higher burden of multimorbidity. Even modest acceleration of 5–10 years has been shown to significantly impact long-term survival, and here we see acceleration exceeding that threshold.
From a quality-of-life perspective, this degree of biological ageing may manifest as chronic fatigue, pain syndromes, cognitive decline, and decreased functional capacity, as reflected in the fatigue and fibromyalgia cohorts. In clinical contexts, identifying individuals with elevated biological age provides a powerful opportunity for targeted interventions—such as anti-inflammatory strategies, metabolic optimisation, exercise, and lifestyle modification—to slow or even partially reverse epigenetic drift.
References
- Christopher Collins; James Brown; Henry C. Chung; A Cost-Effective Saliva-Based Human Epigenetic Clock Using 10 CpG Sites Identified with the Illumina EPIC 850k Array. DNA. 2025, 5, 28.


