Your browser does not fully support modern features. Please upgrade for a smoother experience.
Submitted Successfully!
 +1 credit
Thank you for your contribution! You can also upload a video entry or images related to this topic.
For video creation, please contact our Academic Video Service.
| Version | Summary | Created by | Modification | Content Size | Created at | Operation |
|---|---|---|---|---|---|---|
| 1 | Anurag Sinha | -- | 2343 | 2024-03-18 09:48:57 | | | |
| 2 | Sirius Huang | Meta information modification | 2343 | 2024-03-21 01:42:15 | | |
Video Upload Options
We provide professional Academic Video Service to translate complex research into visually appealing presentations. Would you like to try it?
Cite
If you have any further questions, please contact Encyclopedia Editorial Office.
Sinha, A.; Aljrees, T.; Pandey, S.K.; Kumar, A.; Banerjee, P.; Kumar, B.; Singh, K.U.; Singh, T.; Jha, P. Data Gathering and Disease Detection in Healthcare WSN. Encyclopedia. Available online: https://encyclopedia.pub/entry/56374 (accessed on 26 July 2026).
Sinha A, Aljrees T, Pandey SK, Kumar A, Banerjee P, Kumar B, et al. Data Gathering and Disease Detection in Healthcare WSN. Encyclopedia. Available at: https://encyclopedia.pub/entry/56374. Accessed July 26, 2026.
Sinha, Anurag, Turki Aljrees, Saroj Kumar Pandey, Ankit Kumar, Pallab Banerjee, Biresh Kumar, Kamred Udham Singh, Teekam Singh, Pooja Jha. "Data Gathering and Disease Detection in Healthcare WSN" Encyclopedia, https://encyclopedia.pub/entry/56374 (accessed July 26, 2026).
Sinha, A., Aljrees, T., Pandey, S.K., Kumar, A., Banerjee, P., Kumar, B., Singh, K.U., Singh, T., & Jha, P. (2024, March 18). Data Gathering and Disease Detection in Healthcare WSN. In Encyclopedia. https://encyclopedia.pub/entry/56374
Sinha, Anurag, et al. "Data Gathering and Disease Detection in Healthcare WSN." Encyclopedia. Web. 18 March, 2024.
Copy Citation
Wireless sensor networks (WSNs) consist of a multitude of distributed devices, equipped with sensors, to monitor physical or environmental conditions. These devices, also known as nodes, collaboratively pass their data through the network to a main location or sink where the data can be observed and analyzed. WSNs have emerged as a promising technology in healthcare, enabling continuous patient monitoring and early disease detection.
WSN
data gathering
data mining
KGS theory
signal processing
healthcare
clustering
1. Introduction
The use of wireless sensor networks (WSNs) for healthcare applications has attracted a lot of study to improve data collection and disease diagnosis. To increase the operating life of resource-constrained sensor nodes, several researchers have looked into energy-efficient data aggregation methods designed for WSNs in healthcare. In order to increase accuracy and lower false positives, machine learning-based techniques for disease identification have been investigated [1]. It has also been studied the use of dynamic routing protocols in healthcare WSNs, emphasizing its importance in streamlining data gathering procedures. According to the goals of the proposed DANA algorithm and semi-supervised clustering-based model, these connected studies together contribute to the creation of effective and precise healthcare monitoring systems based on WSNs [2]. In the field of wireless sensor networks (WSNs) for healthcare applications, a wide range of related studies have been carried out to solve the urgent concerns of data collection effectiveness and disease detection accuracy [3]. In order to increase the operational lifespan of sensor nodes, which is essential in settings when resources are few, researchers have dug into the complexities of energy-efficient data aggregation approaches. Furthermore, supervised and unsupervised machine learning-based disease detection methods in WSNs have been investigated in order to improve diagnosis accuracy and reduce false positives. In order to optimize the gathering of healthcare data, the search for dynamic routing protocols in healthcare WSNs has also been a main focus.
Recent research has also explored the fusion of data from various sensor sources in WSNs, providing insights into how such data fusion can improve the accuracy and reliability of healthcare data, aligning well with the all-encompassing approach embodied in the proposed DANA algorithm and semi-supervised clustering-based model. Machine learning has been used to the field of real-time disease outbreak detection in order to quickly identify disease outbreaks using real-time sensor data, demonstrating the potential use of cutting-edge machine learning techniques in healthcare monitoring systems. Researchers have also looked on adaptive energy-efficient routing protocols, investigating ways to save energy while assuring data accuracy—a topic that is relevant to the DANA algorithm energy-efficient data collecting feature. Research on semi-supervised clustering methods is ongoing concurrently [4].
A thorough examination of the difficulties involved in integrating data from multiple sensor types and standards has also become a crucial concern for healthcare WSN interoperability concerns. This assessment emphasizes the value of a unified framework, a key concern addressed by the proposed DANA algorithm and integrated model, which seeks to harmony and expedite data collection procedures from diverse sources.
2. Signal Processing Techniques
There are frequently high spatial and temporal correlations between sensor data. Giving inadequate information in this situation is ineffective. The quantity of information supplied can be reduced by using the objective [5] and signal processing, particularly changes and encoding compression (CEC) approaches. The hub gathers data in accordance with the Shannon-SyQuest testing hypothesis to nearby CEC methods; these estimates are then changed and appropriately encoded. Additionally, the outcome of such a modification is sent away from the washbasin and stored in at least one packet in the payload. According to the particular application circumstances, specifically. Lossy algorithms are used to compress the raw data [6]. This enables the discarding of part of the original data. Increasing pressure levels while remaining beneficial with a certain degree of precision, the data may be replicated. Certain kinds of observation, however, need accuracy. It is implausible in some cases to expect that one will be aware of the scope of allowable observational errors without affecting the genuine facts. In addition, some application domains (such as body area networks (BANs)), where sensor hubs are continually present and filter and report critical information, call for sensors with high and cannot accept estimates that have been ruined by exactness. practices that include pressure loss. In this wide variety of WSNs, lossless data collection is both necessary and appealing. Authors of [7] have made suggestions for localized lossless compression plans. Lossy pressure strategies have been analyzed and investigated in relation to recreation mistakes and energy. Utilizations in [8], in this work, they emphasize lossless methods. They believed it to be out of place. Nevertheless, in some forms of verification, perceptual accuracy is crucial for comprehending the fundamental actual cycles. It is implausible to expect to be able to decide the amount of observational mistakes that are tolerable without compromising reliable data collecting in varied situations. As shown in Equation (1), some application areas (such as body region networks (BRNs), where sensor hubs continually monitor and record fundamental indicators) are required for sensors with high precision and cannot accept approximations polluted by lossy pressure processes.
The mathematical expression provided outlines a set of constraints concerning the 2-norms of vectors. In simpler terms, it suggests that when a vector x undergoes transformation through a linear operator or matrix, the 2-norm of the resulting vector is bound to stay within specific limits. More precisely, it will be confined to a range that is k times the original norm of x. This type of inequality is common in mathematical scenarios where maintaining the vector’s norm is crucial, such as in compressed sensing or in approximating matrices. The parameter k serves as a measure of allowance, ensuring the system’s fundamental characteristics are preserved, even with slight alterations, as represented in Equation (1).
-
𝛿𝑘: This is the restricted isometry constant for sparsity level 𝑘. It quantifies how much the transformation Φ deviates from being an isometry (a distance-preserving operation) when applied to 𝑘-sparse vectors. A 𝑘-sparse vector is a vector that has at most 𝑘 non-zero entries. The value of 𝛿𝑘 is between 0 and 1, and smaller values indicate that Φ better preserves the distances between sparse vectors.
-
𝒙: This is a vector in the original signal space. The vector 𝒙 is what we want to recover in compressed sensing problems.
-
∥𝒙∥2: This denotes the 2-norm (or Euclidean norm) of the vector 𝒙, calculated as the square root of the sum of the squares of its entries.
-
Φ: This represents a linear operator or matrix that performs a transformation on the vector x. In the context of compressed sensing, Φ is often the measurement matrix that is used to acquire compressed measurements of the signal.
-
Φ𝒙: This is the result of applying the transformation Φ to the vector 𝒙.
-
∥Φ𝒙∥2: This is the 2-norm of the transformed vector Φ𝒙.
3. Information Theory-Related Techniques
The focus of the data sink centric (DSC) clustering approach in wireless sensor networks (WSN) is on effective data collection and transmission to a single data sink. This method involves the formation of clusters by the sensor nodes on their own, with each cluster being run by a cluster head (CH) who is in charge of gathering and transmitting data locally. DSC reduces redundant transmissions by focusing on data aggregation at the cluster level, which saves energy and increases network longevity. The central sink is reached by the cluster heads after they have transmitted the aggregated data, enabling an organized and power-saving data routing process. DSC clustering is a good choice for applications that need real-time or near-real-time data, especially in cases like environmental monitoring when information is gathered from scattered sensor nodes across a wide region. These applications benefit from dynamic adaptability and decreased latency.
The association of data concurrently secured by many sensors may be employed by DSC approaches, which are driven by the Slepian–Wolf assumption [9]. The DSC systems state that each sensor center point transmits its compressed results to the sink for collective interpretation. This indicates that during pair gathers, the center points must cooperate for one to contribute side information and the other to compress it to the Slepian–Wolf or Wyner–Ziv limit. Due to their foundational belief that the full benefits of the secret data appointment should be understood early on [10], DSC techniques are similarly challenging to implement in these situations. The most popular and useful DSC implementation is called DISCUS [11], where sensor center points are thought of as being divided into bundles. As side information, a center point (the collecting head) communicates uncompressed data for each pack, while any additional centers send encoded (i.e., compacted) data. Permit us to assume that (quantized) assessments will fall between [0, 7] for the whole number and that, when taken into consideration, all data from different sensors will be discriminated at (almost) the same time contrast. To address unambiguous data from each sensor with regard to wireless sensor networks (WSNs), the DANA algorithm, or the semi-supervised clustering-based model, “DSC” is not a widely used acronym or abbreviation. It is possible that “DSC” refers to a specific term or concept within a particular research or project context. It is difficult to give a detailed answer without more background or details. A WSN generally comprises of several small sensor nodes with limited resources that are dispersed across a vast region. These nodes have sensors to gather data, computing units to execute calculations, and wireless communication capabilities to send data to a centralized base.
In this case, sensor nodes in a wireless sensor network (WSN) are grouped into clusters, with each cluster having a designated cluster head in charge of data aggregation. In order to communicate with the cluster head, the sensor nodes encode the features they have seen. In particular, the binary representations 00, 01, 10, and 11 are used to express independently properties that are thought to be similar and have a base distance of 4. The cluster head then groups these encoded traits into four unique bins, numb0, 4, 1, 5, 2, and 3, and stores them in a common repository. When a sensor node sends data with the encoded value 01, the sink, the main data gathering point, instantly decodes it as 5, identifying the value as 5.
4. Clustering-Based Big Data Gathering in Densely Distributed WSN
When examining the arrangement of data gathering in WSN using a flexible sink, the best strategy to decrease energy usage is to pick where data collection is coordinated. At the end of the day, a response to the process with two inquiries will not be more significant than this issue. (1) Which computation is the most effective for classifying centers into packs? (2) To decrease energy usage, how many clusters are advised? Reduce the square of data transmission distance inside an organization using the best bundling calculation to lower energy consumption for data transmission. This is because, according to our predictions, the energy used for data transmission at the center is inversely correlated with the square of the transmission distance [12]. Similarly, according to the statement, there is an inverse square relationship between the transmission distance square and the amount of energy used to transmit data at the center. This connection is frequently linked to the free-space route loss model in wireless communication, which describes how signal strength declines as transmitter and receiver distances rise. The received signal power (received P received) is inversely proportional to the square of the distance (d) between the transmitter and receiver in free-space route loss. This connection is denoted mathematically by the following. The formula below shows how energy usage for data transmission is frequently correlated with transmitted power (transmitted P sent).
Its adaptability is demonstrated by the model technique’s use in a variety of dynamical systems, including rare occurrences and high-degree-of-freedom systems like boundary layer flow simulations, classic issues like the Lorenz attractor, and other dynamical systems. This strategy works well even for complicated problems with a lot of degrees of freedom, providing computational solutions without assuming any particular analytical structure for the model. In Figure 1, the model expands its value when used in conjunction with a clustering networking model, where clusters are modeled using various distance measurements and algorithms, such as Manhattan distance. The aforementioned model is utilized in a situation where N sensor centers, each one representing a different circle, are present. To complete the assignment, an adjustable washbasin must go through K focus points of bundles, each of which is addressed by a filled circle [13]. This implies that the model method is flexible enough to handle the challenges of clustering in networking, supporting a variety of distance measurements and algorithms to efficiently move between and control the sensor hubs in the network.
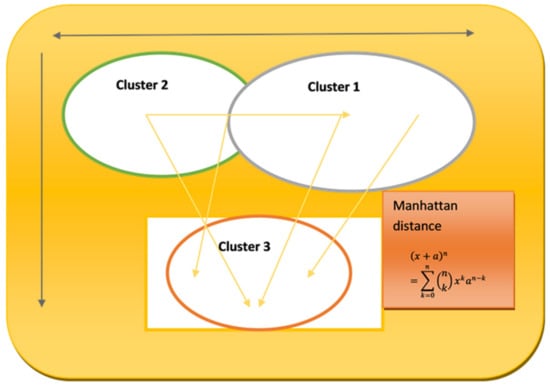
Figure 1. Clustering networking model.
Equation (1) represents the binomial theorem, expressing the expansion of the 𝑝𝑜𝑤𝑒𝑟(𝑥+𝑎)𝑛. Here, x and an are terms being raised to the power of n. The symbol ∑ denotes a summation, k is the index of summation, and (n!k) are binomial coefficients, which determine the number of ways to choose k terms from n, aiding in the distribution of the powers across the terms. The terms 𝑥𝑘 𝑎𝑛𝑑 𝑎(𝑛−𝑘) represent the varying powers of x and a in each term of the expansion. This theorem is fundamental in algebra for expanding expressions that are raised to a power.
Table 1 lists some strategies for acquiring data in wireless sensor networks (WSNs) that is energy-efficient across a variety of properties. Significant factors include heterogeneity, mobility, space complexity, memory utilization, length of input data, clustering goals, and big data aspects like volume, variety, and efficiency. The suggested approach stands out by addressing these characteristics thoroughly and including elements like overhead reduction, low-latency interference reduction, storage optimization, energy-efficient data collection, and sophisticated analytics. By maintaining efficiency in resource utilization and performance across several WSN variables, this approach tries to achieve a balance.
Table 1. Comparative study of several state of the art methods using different methods.
| Approaches | Attributes of Energy Efficient Gathering | ||||||
|---|---|---|---|---|---|---|---|
| Hetrogeniousity | Mobility | Space Complexity | Memory Usage | Length of Input Data | Clustering Ojective | Big Data Parameters Like Volume, Veracty Effiency… | |
| [14] | 🗸 | no | 🗸 | Avg. | 🗸 | Energy consumption | no |
| [15] | 🗸 | no | High | 🗸 | Scheduling | no | |
| [5] | 🗸 | 🗸 | 🗸 | High | 🗸 | Load balancing | no |
| [16] | 🗸 | 🗸 | High | 🗸 | Throughput | no | |
| [1] | 🗸 | 🗸 | 🗸 | High | Packet delivery | 🗸 | |
| [8] | 🗸 | 🗸 | 🗸 | Data storage | 🗸 | ||
| [17] | no | no | 🗸 | Efficient | 🗸 | Processing | 🗸 |
| [18] | no | no | 🗸 | Warehousing | no | ||
| [13] | no | 🗸 | 🗸 | Avg. | 🗸 | Shrinkage | 🗸 |
| [19] | 🗸 | no | 🗸 | 🗸 | Analytics | 🗸 | |
| Proposed | 🗸 | 🗸 | 🗸 | Efficient | 🗸 | Overhead reduction, reduction of low latancy interference, storage, energy efficient data gathering, analytics | 🗸 |
References
- Bloemheuvel, S.; Hoogen, J.v.D.; Atzmueller, M. A computational framework for modeling complex sensor network data using graph signal processing and graph neural networks in structural health monitoring. Appl. Netw. Sci. 2021, 6, 97.
- Campobello, G.; Segreto, A.; Serrano, S. Data Gathering Techniques for Wireless Sensor Networks: A Comparison. Int. J. Distrib. Sens. Netw. 2016, 12, 4156358.
- Gupta, H.; Navda, V.; Das, S.; Chowdhary, V. Efficient gathering of correlated data in sensor networks. ACM Trans. Sens. Netw. 2008, 4, 1–31.
- Hussain, A.; Zafar, K.; Baig, A.R.; Almakki, R.; AlSuwaidan, L.; Khan, S. Sensor-Based Gym Physical Exercise Recognition: Data Acquisition and Experiments. Sensors 2022, 22, 2489.
- Losilla, F.; Garcia-Sanchez, A.J.; Garcia-Sanchez, F.; Garcia-Haro, J.; Haas, Z.J. A comprehensive approach to WSN-based ITS applications: A survey. Sensors 2011, 11, 10220–10265.
- DeBlauw, J.A.; Drake, N.B.; Kurtz, B.K.; Crawford, D.A.; Carper, M.J.; Wakeman, A.; Heinrich, K.M. High-Intensity Functional Training Guided by Individualized Heart Rate Variability Results in Similar Health and Fitness Improvements as Predetermined Training with Less Effort. J. Funct. Morphol. Kinesiol. 2021, 6, 102.
- Moon, J.; Jeong, M.; Oh, S.; Laine, T.H.; Seo, J. Data Collection Framework for Context-Aware Virtual Reality Application Development in Unity: Case of Avatar Embodiment. Sensors 2022, 22, 4623.
- Sumathi, J.; Velusamy, R.L. A review on distributed cluster based routing approaches in mobile wireless sensor networks. J. Ambient. Intell. Humaniz. Comput. 2020, 12, 835–849.
- Kore, A.; Patil, S. Cross layered cryptography based secure routing for IoT-enabled smart healthcare system. Wirel. Netw. 2022, 28, 287–301.
- Kumar, B.; Roy, S.; Sinha, A.; Iwendi, C.; Strážovská, L. E-Commerce Website Usability Analysis Using the Association Rule Mining and Machine Learning Algorithm. Mathematics 2022, 11, 25.
- Eckstein, M.L.; Moser, O.; Rössler, A.; Moertl, M.G.; Jantscher, A.; Papousek, I.; Wagner, J.; Schmid-Zalaudek, K.; Sourij, H.; Treiber, G.; et al. Differences in Hemodynamic, Hormonal and Heart Rate Variability Parameters in Complication-Free Pregnancies Compared to Individuals with Gestational Diabetes Mellitus and Preeclampsia: An Observational Retrospective Analysis. Life 2021, 11, 626.
- Lotfian, M.; Ingensand, J.; Brovelli, M.A. The Partnership of Citizen Science and Machine Learning: Benefits, Risks, and Future Challenges for Engagement, Data Collection, and Data Quality. Sustainability 2021, 13, 8087.
- Safaldin, M.; Otair, M.; Abualigah, L. Improved binary gray wolf optimizer and SVM for intrusion detection system in wireless sensor networks. J. Ambient. Intell. Humaniz. Comput. 2020, 12, 1559–1576.
- Sinha, A.; Ramish, M.; Kumari, S.; Jha, P.; Tiwari, M.K. ANN-ANT-LION-MLP Ensemble Transfer Learning Based Classifier for Detection and Classification of Oral Disease Severity. In Proceedings of the 2022 12th International Conference on Cloud Computing, Data Science & Engineering (Confluence), Noida, India, 27–28 January 2022; pp. 530–535.
- Doreswamy; Kunal, G.S.; Manjunatha, B.R. Performance Evaluation of Various Clustering Techniques for Gathering Big Data in Distributed Wireless Sensor Network. In Proceedings of the 2017 IEEE International Conference on Computational Intelligence and Computing Research (ICCIC), Coimbatore, India, 14–16 December 2017; pp. 1–6.
- Mamurjon, D.; Ahn, B. A Novel Data Gathering Method for Large Wireless Sensor Networks. IERI Procedia 2013, 4, 288–294.
- Foster, B.; Heath, G.; Llewellyn, T.; Gingrich, D.; Harnew, N.; Hallam-Baker, P.; Khatri, T.; McArthur, I.; Morawitz, P.; Nash, J.; et al. The performance of the ZEUS central tracking detector z-by-timing electronics in a transputer based data acquisition system. Nucl. Phys. B Proc. Suppl. 1993, 32, 181–188.
- Alhayani, B.; Kwekha-Rashid, A.S.; Mahajan, H.B.; Ilhan, H.; Uke, N.; Alkhayyat, A.; Mohammed, H.J. 5G standards for the Industry 4.0 enabled communication systems using artificial intelligence: Perspective of smart healthcare system. Appl. Nanosci. 2023, 13, 1807–1817.
- Nguyen, M.T. Data Collection Algorithms in Wireless Sensor Networks Employing Compressive Sensing. Ph.D. Thesis, Oklahoma State University, Stillwater, OK, USA, 2015; p. 192.
More
Information
Contributors
MDPI registered users' name will be linked to their SciProfiles pages. To register with us, please refer to https://encyclopedia.pub/register
:
View Times:
586
Revisions:
2 times
(View History)
Update Date:
22 Mar 2024
Table of Contents


Notice
You are not a member of the advisory board for this topic. If you want to update advisory board member profile, please contact office@encyclopedia.pub.
OK
Confirm
Only members of the Encyclopedia advisory board for this topic are allowed to note entries. Would you like to become an advisory board member of the Encyclopedia?
Yes
No
${ textCharacter }/${ maxCharacter }
Submit
Cancel
Back
Comments
${ item }
|
${ item.createdUser.fullName }
${ item.createdAt }
${ item.vote }
${ item.reply }
Delete
${ reply.createdUser.fullName }
${ reply.createdAt }
${ reply.vote }
Delete
There is no reply to this comment~
${ item.replyTextCharacter }/${ item.replyMaxCharacter }
Submit
Cancel
More
No more~
There is no comment~
${ textCharacter }/${ maxCharacter }
Submit
Cancel
${ selectedItem.replyTextCharacter }/${ selectedItem.replyMaxCharacter }
Submit
Cancel
Confirm
Are you sure to Delete?
Yes
No