Your browser does not fully support modern features. Please upgrade for a smoother experience.
Submitted Successfully!
 +1 credit
Thank you for your contribution! You can also upload a video entry or images related to this topic.
For video creation, please contact our Academic Video Service.
| Version | Summary | Created by | Modification | Content Size | Created at | Operation |
|---|---|---|---|---|---|---|
| 1 | Ronald B. Brown | -- | 1232 | 2024-03-13 13:35:10 | | | |
| 2 | Peter Tang | Meta information modification | 1232 | 2024-03-14 03:19:33 | | |
Video Upload Options
We provide professional Academic Video Service to translate complex research into visually appealing presentations. Would you like to try it?
Cite
If you have any further questions, please contact Encyclopedia Editorial Office.
Brown, R.B. Reporting Bias in COVID-19 mRNA Vaccine Clinical Trials. Encyclopedia. Available online: https://encyclopedia.pub/entry/56209 (accessed on 26 June 2026).
Brown RB. Reporting Bias in COVID-19 mRNA Vaccine Clinical Trials. Encyclopedia. Available at: https://encyclopedia.pub/entry/56209. Accessed June 26, 2026.
Brown, Ronald B.. "Reporting Bias in COVID-19 mRNA Vaccine Clinical Trials" Encyclopedia, https://encyclopedia.pub/entry/56209 (accessed June 26, 2026).
Brown, R.B. (2024, March 13). Reporting Bias in COVID-19 mRNA Vaccine Clinical Trials. In Encyclopedia. https://encyclopedia.pub/entry/56209
Brown, Ronald B.. "Reporting Bias in COVID-19 mRNA Vaccine Clinical Trials." Encyclopedia. Web. 13 March, 2024.
Copy Citation
Relative risk reduction and absolute risk reduction measures in the evaluation of clinical trial data are poorly understood by health professionals and the public. The absence of reported absolute risk reduction in COVID-19 vaccine clinical trials can lead to outcome reporting bias that affects the interpretation of vaccine efficacy.
mRNA vaccine
COVID-19 vaccine
vaccine efficacy
relative risk reduction
absolute risk reduction
1. Introduction
Using messenger RNA (mRNA) in vaccines to produce proteins that trigger an immune response against infectious diseases has held promise for decades, but until recently, no clinically tested mRNA vaccine has managed to advance beyond small, early-phase trials [1]. Normally, genetic code in mRNA is transcribed from DNA in the cell nucleus, and the coded message is delivered by mRNA to cell ribosomes for translation during protein biosynthesis [2]. COVID-19 mRNA vaccines directly inject cells with a synthetic genetic code to replicate the spike S protein found on the surface of the coronavirus, SARS-CoV-2 [3]. Once replicated, the spike protein is proposed to trigger an immune response that creates antibodies against the virus [4].
However, several biological obstacles continue to challenge the development of mRNA vaccines, including “mRNA’s extremely large size, charge, intrinsic instability, and high susceptibility to enzymatic degradation” [5]. To mitigate enzymatic degradation, mRNA in the vaccines is encapsulated in lipid nanoparticles [6], but it is unclear how this encapsulation affects genetic code translation in the cell ribosomes. Nevertheless, clinical results of phase III trials reported for COVID-19 vaccines manufactured by Pfizer/BioNTech (New York City, NY, USA/Mainz, Germany) [7] and Moderna (Cambridge, MA, USA) [8] have far surpassed predicted performance, with vaccine efficacy rates of approximately 95%. Curiously, “why these vaccines seem so effective while previous attempts against other pathogens haven’t appeared as promising remains an open question” [1].
2. Critical Appraisal of Vaccine Efficacy
The application of epidemiologic and biometric methods to clinical diagnosis and treatment is known as clinical epidemiology [9]. Clinical epidemiologic tools can be applied in evidence-based medicine (EBM) to critically appraise research evidence for validity, size of effect, and usefulness in clinical practice [10]. Clinical treatment effects in groups of participants are measured by comparing probabilities of an event, known as event rates [11].
Figure 1 shows an example of a vaccine clinical trial for an infectious disease. The vaccine and placebo groups in Figure 1 each have 100 randomly assigned individuals with no history of infection, and an event is defined as the incidence of infection among all individuals during the course of the trial. The percentage of events in the vaccine group is the experimental event rate (EER) or the risk of infection in the vaccine group (1/100 = 1%), and the percentage of events in the placebo group is the control event rate (CER) or the risk of infection in the placebo group (2/100 = 2%).

Figure 1. Example of a vaccine clinical trial for an infectious disease.
3. 2 × 2 Contingency Tables and Epidemiologic Equations
The following 2 × 2 contingency tables for SARS-CoV-2 infection are based on reported clinical trial data for the Pfzier/BioNTech BNT162b2 vaccine [12] and the Moderna mRNA-1273 vaccine [13]. The table rows, shown in Table 1, list the vaccine and placebo groups and the table columns list the participants’ outcomes of either SARS-CoV-2 infection or no infection. Table 2 and Table 3 list the clinical trial data for the Pfzier/BioNTech and Moderna vaccines, respectively. As shown in Table 1, the total number of participants in a group, known as n, is represented by a + b for the vaccine group and c + d for the placebo group.
Table 1. 2 × 2 contingency table for SARS-CoV-2 infection in vaccine clinical trials.
|
Infection |
No Infection |
||
|---|---|---|---|
|
Vaccine |
a |
b |
a + b |
|
Placebo |
c |
d |
c + d |
Table 2. 2 × 2 contingency table for SARS-CoV-2 infection in Pfzier/BioNTech vaccine clinical trial.
|
Infection |
No Infection |
||
|---|---|---|---|
|
BNT162b2 |
8 |
21,712 |
21,720 |
|
Placebo |
162 |
21,564 |
21,726 |
Table 3. 2 × 2 contingency table for SARS-CoV-2 infection in Moderna vaccine clinical trial.
|
Infection |
No Infection |
||
|---|---|---|---|
|
mRNA-1273 |
11 |
15,199 |
15,210 |
|
Placebo |
185 |
15,025 |
15,210 |
The following epidemiologic equations use data from the 2 × 2 contingency tables (Table 1, Table 2 and Table 3) to calculate relative and absolute measures of COVID-19 mRNA vaccine efficacy.
Risk ratio (RR):
The risk ratio, also known as the relative risk, in a randomized controlled trial is the ratio calculated by dividing the experimental event rate (EER), a/(a + b), by the control event rate (CER), c/(c + d) [14]. Dividing the EER by the CER equals 1 if the rates do not differ, in which case the RR has the null value 1. RRs below 1 indicate a protective effect and a decreased risk (EER < CER), and RRs above 1 indicate an increased risk (EER > CER).
Risk ratio 95% confidence interval (CI):
The risk ratio 95% confidence interval predicts the range of probable risk ratios if the experiment or trial was repeated 95 out of 100 times. The narrower the range between the upper and lower CI values, the more precise the CI. If the range includes the RR null value, 1, the risk ratio is considered statistically insignificant. The equation calculates the standard error (SE) [15][16], and the natural logarithm (Ln) is used, along with the antilog expressed as an exponent of the base e, to normally distribute the data when calculating the 95% probability.
Absolute risk reduction (ARR):
The absolute risk reduction is a percentage equal to the arithmetic difference when subtracting the EER from the CER [14]. The difference equals zero if the rates do not differ, in which case the ARR has the null value zero. The difference is negative if the EER is higher than the CER.
Absolute risk reduction 95% confidence interval (CI upper, lower):
The standard error in the absolute risk reduction 95% confidence interval measures the square root of the sum of the group variances [17]. If the ARR CI includes the null value zero, the ARR is not statistically significant.
Number needed to vaccinate (NNV):
The NNV, or the number needed to vaccinate to prevent one infection, is the reciprocal of the ARR [18]. Note that the numerator is multiplied by 100 when the ARR is expressed with a percentage sign. The NNV is also usually rounded up to the next individual.
NNV 95% confidence interval (CI):
The CI of the NNV is calculated by dividing 1 by the ARR CI [17], again multiplying by 100 in the numerator when the ARR is expressed with a percentage sign.
Relative risk reduction (RRR) or vaccine efficacy (VE):
The relative risk reduction is the same as vaccine efficacy (VE) [18]. The RRR is calculated by subtracting the RR from the null value 1, or by dividing the ARR by the CER [17].
RRR, VE 95% confidence interval (CI):
The CI for the relative risk reduction is calculated by subtracting the RR CI from the null value 1.
Pvalues, which measure the probability that a trial result occurred by chance, can be calculated from the confidence interval for the difference between two proportions, as in the ARR, and from the confidence interval for a ratio, as in the RRR [19]. Online calculators are also available that compare group proportions [20] and calculate epidemiological equations [21], which are useful for measuring vaccine efficacy. Figure 2 shows a chart of the present critical appraisal of mRNA COVID-19 vaccine efficacy. Note that the vertical axis of the chart is a logarithmic scale, base 10.
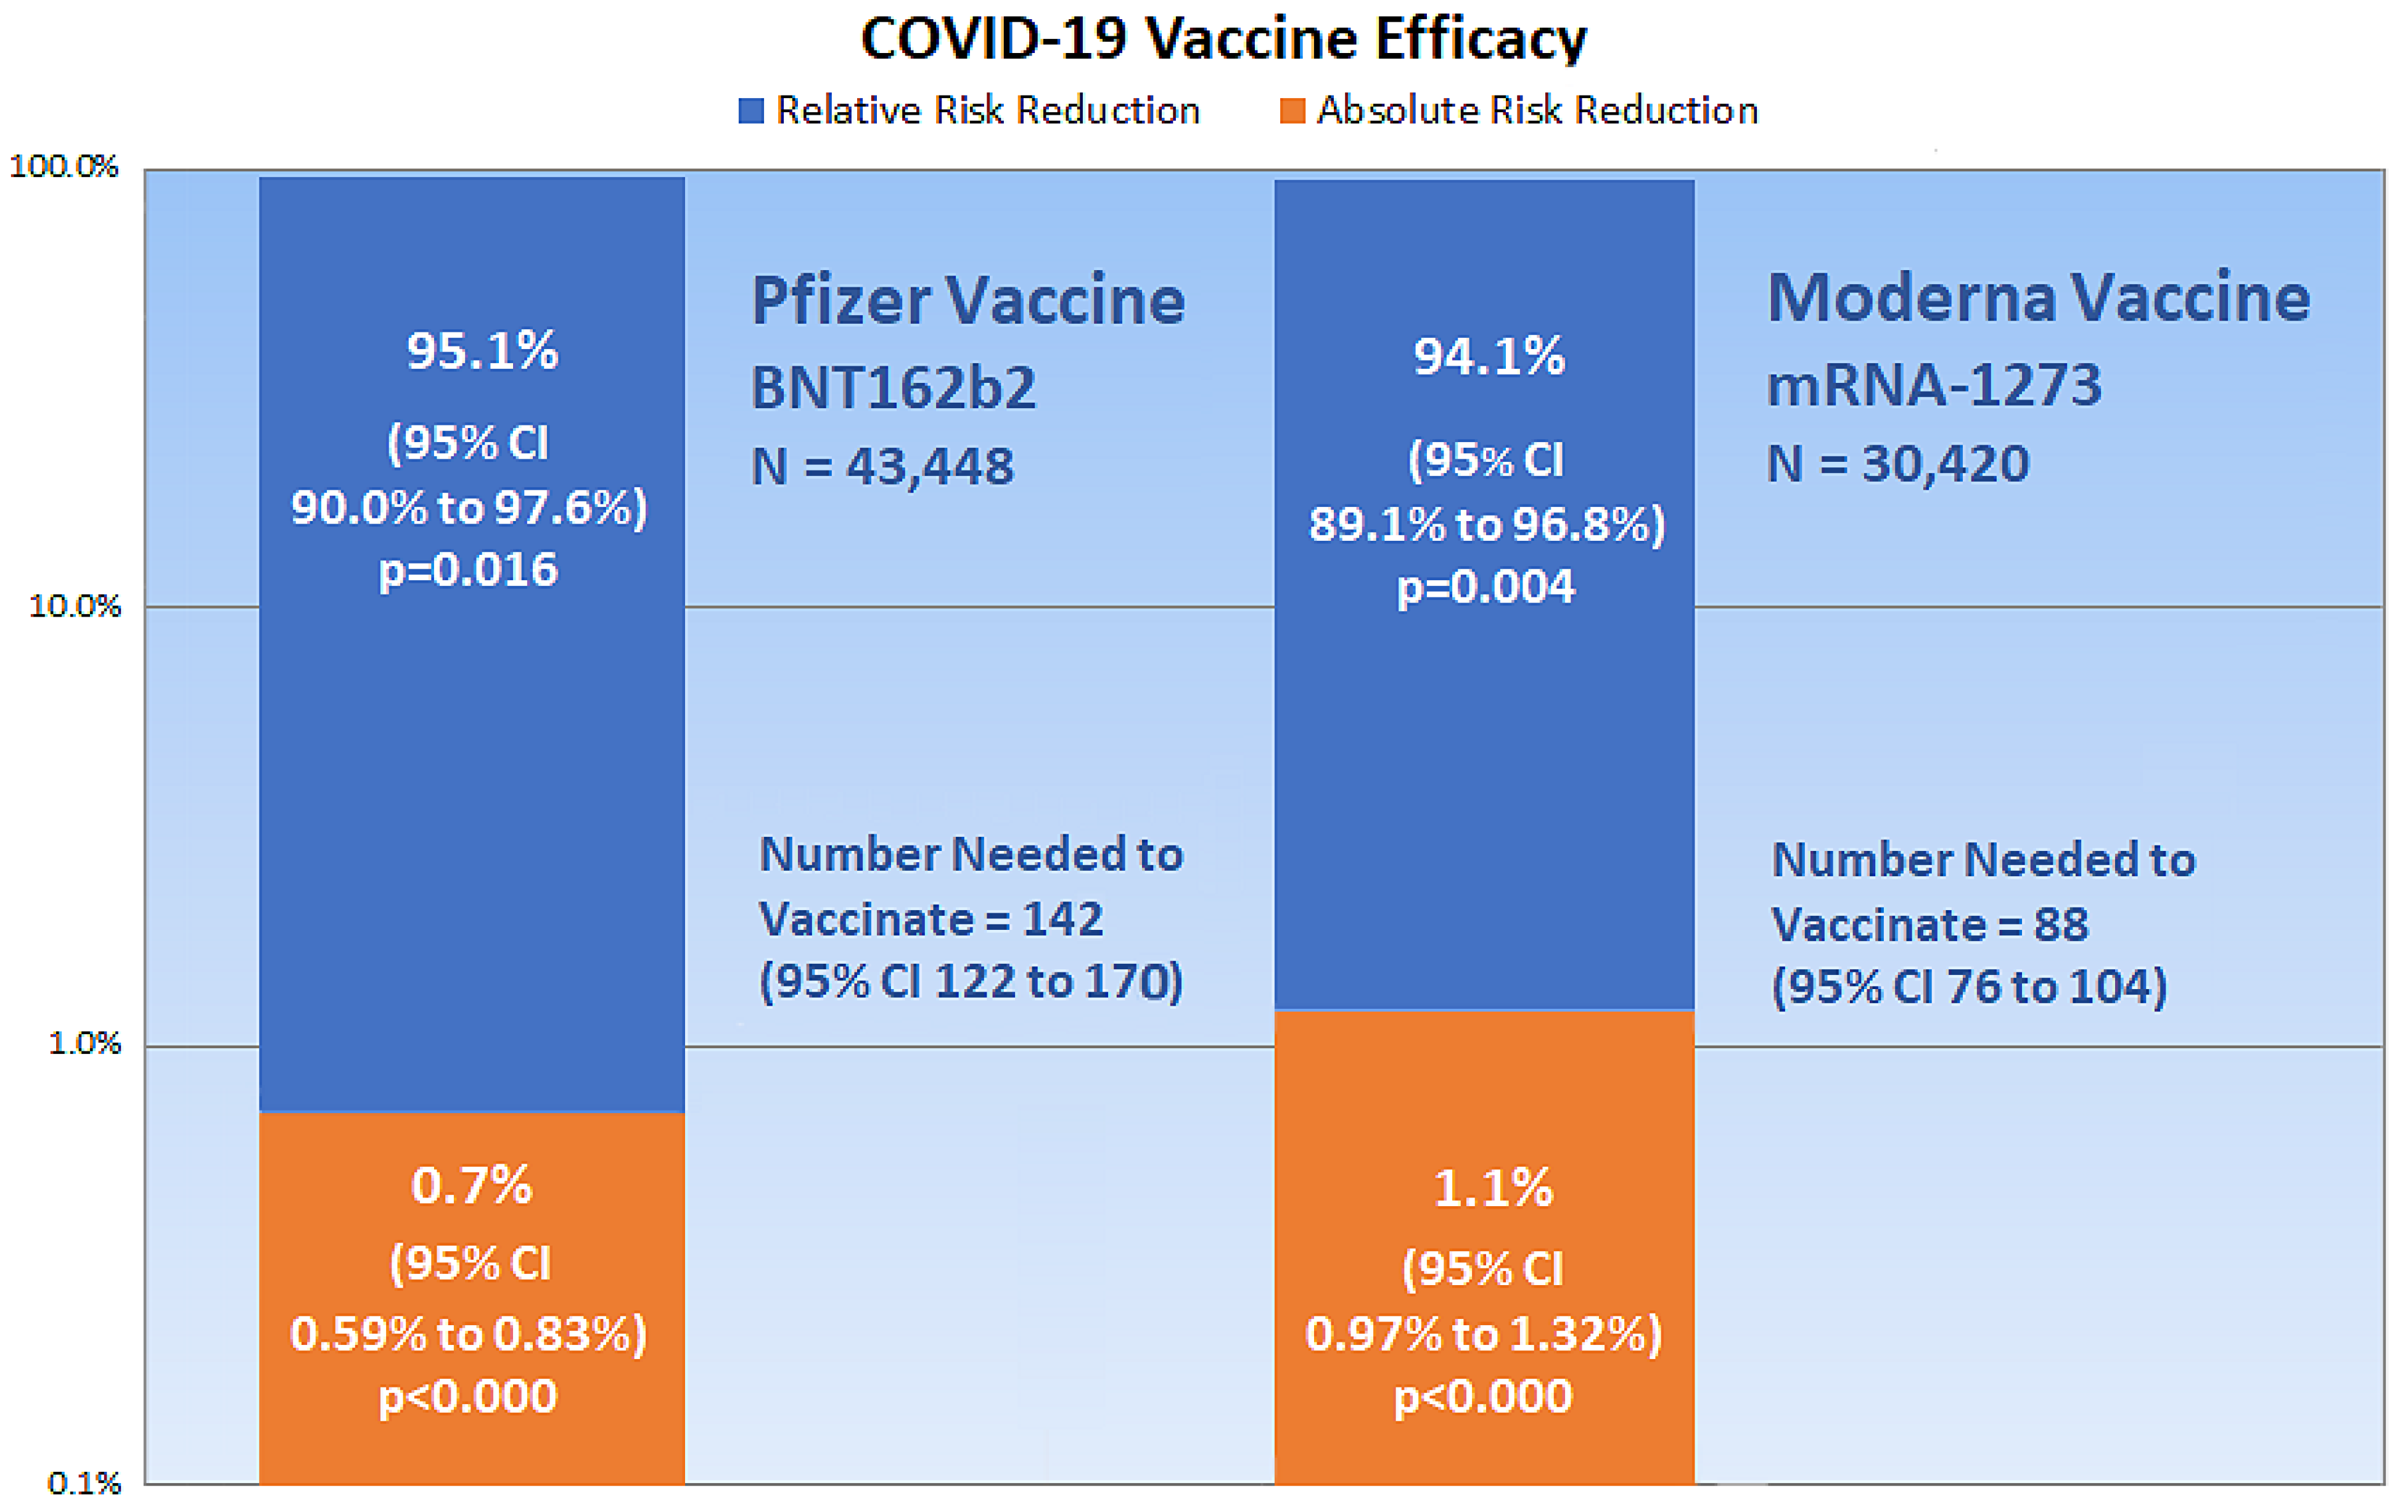
Figure 2. The chart shows critical appraisal results of mRNA COVID-19 vaccine efficacy.
References
- Kwon, D. The Promise of mRNA Vaccines. Available online: https://www.the-scientist.com/news-opinion/the-promise-of-mrna-vaccines-68202 (accessed on 23 December 2020).
- Genome. Messenger RNA (mRNA). Available online: https://www.genome.gov/genetics-glossary/messenger-rna (accessed on 23 December 2020).
- Garde, D. The Story of mRNA: How a Once-Dismissed Idea Became a Leading Technology in the Covid Vaccine Race. Available online: https://www.statnews.com/2020/11/10/the-story-of-mrna-how-a-once-dismissed-idea-became-a-leading-technology-in-the-covid-vaccine-race/ (accessed on 5 January 2021).
- Centers for Disease Control and Prevention. Understanding mRNA COVID-19 Vaccines. Available online: https://www.cdc.gov/coronavirus/2019-ncov/vaccines/different-vaccines/mrna.html (accessed on 22 December 2020).
- Wadhwa, A.; Aljabbari, A.; Lokras, A.; Foged, C.; Thakur, A. Opportunities and Challenges in the Delivery of mRNA-based Vaccines. Pharmaceutics 2020, 12, 102.
- Reichmuth, A.M.; Oberli, M.A.; Jaklenec, A.; Langer, R.; Blankschtein, D. mRNA vaccine delivery using lipid nanoparticles. Ther. Deliv. 2016, 7, 319–334.
- Food and Drug Administration. Pfizer-BioNTech COVID-19 Vaccine VRBPAC Briefing Document. Available online: https://www.fda.gov/media/144246/download (accessed on 23 December 2020).
- Food and Drug Administration. FDA Briefing Document: Moderna COVID-19 Vaccine. Available online: https://www.fda.gov/media/144434/download (accessed on 23 December 2020).
- Sackett, D.L. Clinical epidemiology. Am. J. Epidemiol. 1969, 89, 125–128.
- Sackett, D.; Straus, S.; Scott Richardson, W.; Rosenberg, W.; Haynes, R. Evidence-Based Medicine: How to Practice and Teach EBM, 2nd ed.; Churchill Livingstone: Edinburgh, UK; London, UK, 2000.
- Cook, R.J.; Sackett, D.L. The number needed to treat: A clinically useful measure of treatment effect. BMJ 1995, 310, 452–454.
- Polack, F.P.; Thomas, S.J.; Kitchin, N.; Absalon, J.; Gurtman, A.; Lockhart, S.; Perez, J.L.; Pérez Marc, G.; Moreira, E.D.; Zerbini, C. Safety and efficacy of the BNT162b2 mRNA covid-19 vaccine. N. Engl. J. Med. 2020, 383.
- Baden, L.R.; El Sahly, H.M.; Essink, B.; Kotloff, K.; Frey, S.; Novak, R.; Diemert, D.; Spector, S.A.; Rouphael, N.; Creech, C.B.; et al. Efficacy and safety of the mRNA-1273 SARS-CoV-2 vaccine. N. Engl. J. Med. 2020, 384.
- Kremer, L.; Moyer, V. Tips and tricks for understanding and using SR results—No 1: Relative risk, risk difference, and number needed to treat. Evidence-Based Child Health Cochrane Rev. J. 2009, 4, 1146–1148.
- Sullivan, L. Confidence Intervals for the Risk Ratio (Relative Risk). Available online: https://sphweb.bumc.bu.edu/otlt/mph-modules/bs/bs704_confidence_intervals/bs704_confidence_intervals8.html#:~:text=Therefore%2C%20computing%20the%20confidence%20interval,confidence%20interval%20for%20the%20RR (accessed on 26 December 2020).
- Morris, J.A.; Gardner, M.J. Calculating Confidence Intervals For Relative Risks (Odds Ratios) And Standardised Ratios And Rates. BMJ 1988, 296, 1313–1316.
- Schechtman, E. Odds ratio, relative risk, absolute risk reduction, and the number needed to treat—Which of these should we use? Value Health 2002, 5, 431–436.
- Dasgupta, S. A Review of Vaccine Efficacy Measures. Vaccin Res. Open J. 2019, 1, 61–64.
- Altman, D.G.; Bland, J.M. How to obtain the P value from a confidence interval. BMJ 2011, 343, d2304.
- Azzopardi, D. Group Comparison Calculator. Available online: https://www.neoweb.org.uk/Additions/compare.htm (accessed on 6 January 2021).
- Heidel, E. Epidemiology. Available online: https://www.scalestatistics.com/epidemiology.html (accessed on 6 January 2021).
More
Information
Subjects:
Pharmacology & Pharmacy
Contributor
MDPI registered users' name will be linked to their SciProfiles pages. To register with us, please refer to https://encyclopedia.pub/register
:
View Times:
764
Revisions:
2 times
(View History)
Update Date:
14 Mar 2024
Table of Contents


Notice
You are not a member of the advisory board for this topic. If you want to update advisory board member profile, please contact office@encyclopedia.pub.
OK
Confirm
Only members of the Encyclopedia advisory board for this topic are allowed to note entries. Would you like to become an advisory board member of the Encyclopedia?
Yes
No
${ textCharacter }/${ maxCharacter }
Submit
Cancel
Back
Comments
${ item }
|
${ item.createdUser.fullName }
${ item.createdAt }
${ item.vote }
${ item.reply }
Delete
${ reply.createdUser.fullName }
${ reply.createdAt }
${ reply.vote }
Delete
There is no reply to this comment~
${ item.replyTextCharacter }/${ item.replyMaxCharacter }
Submit
Cancel
More
No more~
There is no comment~
${ textCharacter }/${ maxCharacter }
Submit
Cancel
${ selectedItem.replyTextCharacter }/${ selectedItem.replyMaxCharacter }
Submit
Cancel
Confirm
Are you sure to Delete?
Yes
No