Your browser does not fully support modern features. Please upgrade for a smoother experience.
Submitted Successfully!
 +1 credit
Thank you for your contribution! You can also upload a video entry or images related to this topic.
For video creation, please contact our Academic Video Service.
| Version | Summary | Created by | Modification | Content Size | Created at | Operation |
|---|---|---|---|---|---|---|
| 1 | Francis Oppong | -- | 3707 | 2024-03-11 10:05:19 | | | |
| 2 | Jason Zhu | -8 word(s) | 3699 | 2024-03-12 02:57:39 | | |
Video Upload Options
We provide professional Academic Video Service to translate complex research into visually appealing presentations. Would you like to try it?
Cite
If you have any further questions, please contact Encyclopedia Editorial Office.
Song, Y.; Xu, C.; Li, X.; Oppong, F. Lightning-Induced Wildfire Modeling. Encyclopedia. Available online: https://encyclopedia.pub/entry/56095 (accessed on 25 June 2026).
Song Y, Xu C, Li X, Oppong F. Lightning-Induced Wildfire Modeling. Encyclopedia. Available at: https://encyclopedia.pub/entry/56095. Accessed June 25, 2026.
Song, Yang, Cangsu Xu, Xiaolu Li, Francis Oppong. "Lightning-Induced Wildfire Modeling" Encyclopedia, https://encyclopedia.pub/entry/56095 (accessed June 25, 2026).
Song, Y., Xu, C., Li, X., & Oppong, F. (2024, March 11). Lightning-Induced Wildfire Modeling. In Encyclopedia. https://encyclopedia.pub/entry/56095
Song, Yang, et al. "Lightning-Induced Wildfire Modeling." Encyclopedia. Web. 11 March, 2024.
Copy Citation
Wildfire causes environmental, economic, and human problems or losses.
lightning strike
ignition
wildfires
climate and weather
1. Lightning-Induced Wildfire Modeling Methods
Some of the methods used to analyze lightning-induced wildfire occurrences are briefly discussed. Generally, wildfire occurrences and forecasting in different geographical locations are mostly analyzed using satellite-recorded data. The satellite data are mainly processed and evaluated using statistical analysis. Different statistical analyses are used depending on the accuracy of the method and the author’s preference. Numerous models have been developed to analyze wildfires, including quantitative and qualitative statistical models, Bayesian-based models, time-series tests, linearity models, etc. [1][2]. The models mostly use regression analysis to evaluate the occurrence of wildfires. Although classical or traditional statistical methods have been long used to analyze wildfires, recently, advanced technologies such as machine-learning and artificial intelligence techniques have been incorporated into classical statistical models to accurately and effectively determine and forecast wildfires [3][4][5][6][7][8][9]. Some of the machine-learning and artificial intelligence techniques include support vector machine classifier, random forests, multilayer perception neural network, neuro-fuzzy models, etc. [10][11][12][13][14][15]. These models have their advantages and disadvantages. For instance, the support vector machine can use a small dataset to predict wildfire incidences and produce high-accuracy results [1]. Some researchers in the fire science community have also contended that the accuracy of the random forest model is higher [10]. That is, the random forest model can simulate complex interactions between input models, and it is efficient for large datasets. In summary, factors such as the fire weather conditions and topography are considered inputs in these various models to predict wildfires. However, in recent years, deep-learning methods have mostly been used by the forest and fire science communities to investigate wildfires due to their high accuracy.
2. Lightning-Induced Investigations
Recently, there has been a lot of focus on assessing and understanding lightning-induced wildfires. Researchers thus endeavored to model or investigate lightning-induced fires at different geographical locations using different modeling techniques. These studies were aimed at investigating and understanding the prevalence of lightning-induced fires in various geographical settings and how such wildfires can be managed. Here, some of these studies in the different geographical regions are presented and discussed. The studies were conducted using satellite-recorded data over a period, and the various models discussed in Section 1 were used to analyze the data. The discussions focus on the different lightning-caused investigations in South and North America, Europe, Asia, and Australia.
2.1. South and North America
Schumacher et al. [16] used satellite-detected or recorded data to study lightning-induced fires in Central Brazil within the span of 4 years, i.e., from 2015 to 2019. The cloud-to-ground and cloud-to-ground dry-lightning recorded data were used for the investigations. Meteorological characteristics, polarity, and peak current of lightning were used to simulate lightning-induced forest fires. As the findings revealed, low precipitation, moderate relative humidity, high temperatures, and low wind speed influenced the lightning-caused forest fires in Central Brazil. Forest fires occurred due to cloud-to-ground dry lightning when the precipitation was less than 1 mm and the relative humidity was lower, whereas the reverse was true for cloud-to-ground lightning-caused forest fires. The lightning current intensity for ignition was lower than 20 kA. The author’s results contradicted the idea that negative lightning strikes are less likely to cause ignition. That is, they observed that negative lightning strokes can cause active ignition and lightning-induced fires. Menezes and collaborators [17] looked into the lightning-caused fires in the Pantanal wetland in Brazil. Remote sensing data like VIIRS active fires, MODIS burned areas, and STARNET lightning observations from 2001 to 2017 were used in the research. Although it was found that the highest lightning occurred in December to February (summer) and the lowest in June to August (winter), lightning strikes caused only 5% of the fires. Therefore, lightning-induced fires were minimal in the Pantanal wetland. Pinto Neto et al. [18] evaluated the lightning-caused fires in the Mato Grosso and Amazonas states of Brazil using wavelet analysis. It was accentuated that 26,554 fires and nearly 3 million cloud-to-ground lightning flashes occurred at Mato Grosso in the first four months of 2022, whereas 2468 fires and 3.4 million cloud-to-ground lightning occurred at the Amazonas in the same first four months of 2022. However, in 2021, 16,844 fires and almost 2.7 million cloud-to-ground lightning flashes occurred at Mato Grosso, and 1258 fires and 3.2 million cloud-to-ground lightning flashes occurred at Amazonas. Human-caused fires influence lightning-induced fires via the aerosol–cloud particle interaction.
Veraverbeke et al.’s [19] modeling studies on lightning-induced fires in North American boreal forests indicated that 55% of the forest fires that were caused by lightning ignition were closely aligned with the precipitation and temperature. Moreover, it was projected that the convective mass flux of the studied region might increase by 2050–2074, which will result in frequent lightning strikes and probably lightning-caused fires. Evett et al. [20] investigated the influence of moisture on lightning fire ignitions in southwestern North America (Arizona and New Mexico) using 16 years of lightning flashing, relative humidity, and precipitation data from a 34,800 square kilometer area. The tendency for lightning flash ignition was strongly correlated to the minimum relative humidity for a day in the form of a power law, which ranged from 0.023 on days with the least humidity to <0.0001 on days of high humidity. Furthermore, the number of lightning fires observed per day was strongly aligned with the minimum relative humidity for a day in log-normal distribution, which peaked at 4.09 fires per day at 22.1% of a day’s minimum relative humidity. When the area burned per day was correlated with the daily minimum relative humidity in log-normal form, it peaked at 53.7 ha per day at 16.5% for the daily minimum relative humidity. Hessilt et al. [21] also investigated lightning-induced fires in Alaska, the U.S.A., and the Northwest Territories, Canada, between 2001 and 2018. The denser forest areas were susceptible to lightning fires. The changes in the vegetation and fire weather enhanced the lightning efficiency by 14 ± 9% in Alaska and 31 ± 28% in the Northwest Territories. Krawchuk and Cumming [22] simulated the lightning wildfires in western Canada’s boreal forest regions from 1994 to 2001. Their model showed that standing harvest residuals act as a channel for lightning to strike harvested stands, where there is enough dry and fine fuel to combust. Calef et al. [23] studied wildfire occurrences in Alaska from 1943 to 2016, as shown in Figure 1. The lightning-induced forest and burned areas in Alaska were high and have increased over the years.
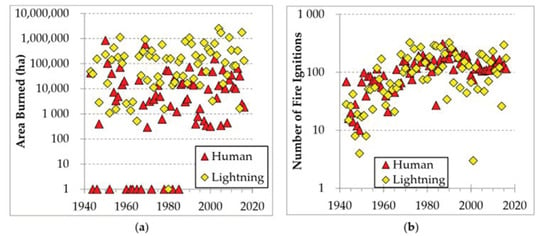
Figure 1. Lightning-ignition wildfires in interior Alaska from 1943 to 2016 [23]. (a) is the annual burned area, and (b) is the number of annual fire ignitions.
MacNamara et al. [24] analyzed the lightning-induced wildfires in western U.S.A. from May to October 2017. They used satellite-recorded information to perform the analysis and aimed to examine the lightning flash density, polarity, 2 min rainfall rate, and 24 h precipitation at the location of the lightning flash that initiates the fire. Also, they sought to understand the precipitation rate at the onset of a lightning flash. The study disclosed that negative cloud-to-ground lightning flashes caused 89% of the forest fires. However, single-stroke flashes triggered 66% of the fire. Li et al. [25] examined the lightning-ignition fires in western U.S.A. national forests and parks in the mid- and late 21st century. They modeled the smoke pollution emitted by lightning-induced fires. The researchers found that in the late 21st century, lightning-ignition wildfire smoke increased by almost 53%. About 93% of lightning fires occurred in Alberta, and there were frequent wildfires with high- and low-frequency lightning [26]. Cha et al. [26] argued that 94% of the annual lightning that occurred in Alberta, Canada, was during the warm months; hence, this could increase lightning-ignition wildfires in that area. The wildfire modeling investigations in California reported by Chen and Jin [27] showed that lightning-caused fires were larger in the Sierra Nevada and North Interior. Also, as reported by Coogan et al. [28], lightning wildfires increased from 1959 to 2018. The number of days with lightning-induced fires also increased. Nonetheless, lightning-ignition wildfires were predominant in the boreal Shield West. Abatzoglou et al. [29] investigated the controls on the interannual variability in lightning wildfires in western U.S.A. from 1992 to 2013. They reported that overall, lightning caused 40% of the wildfires and contributed to 69% of the burned area. As shown in Figure 2, lightning ignited most of the wildland. However, in western U.S.A., lightning ignited 54% and 61% of the wildfires in July and August, respectively. Also, lightning ignited 19%, 35%, and 40% of the wildfires in April, May, and September, respectively.
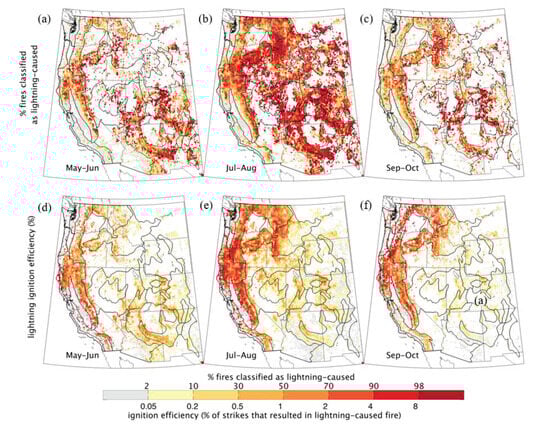
Figure 2. Lightning-ignition fires in western U.S.A from 1992 to 2013 [29]. (a–c) represent the percent of lightning-induced fires, and (d–f) is the lightning ignition efficiency.
Pérez-Invernón et al. [30] also studied global lightning wildfires. They analyzed 5858 lightning-ignited wildfires. By using the 10 km radius and 14-day spatiotemporal criteria, lightning caused 90% of the wildfires. Furthermore, the study showed a future increase in lightning strikes on the west coast of North America, indicative of possible frequent lightning-ignited forest fires in this geographical location. A different study by Pérez-Invernón et al. [31] showed that the lightning-ignition efficiency was high in coniferous forests like Arizona and New Mexico ponderosa pine. Using extensive data from 1897 to 2017, Fill et al. [32] investigated lightning-caused wildfires in southeast U.S.A. According to Fill et al., the dry season in southeast U.S.A. has increased by 156 days, or almost 130%, over 120 years. This has increased lightning-ignited wildfires and wildfire risks. Prestemon et al.’s [33] investigations on lightning wildfires in the southeast of the U.S.A. also indicated that the median annual burned area due to lightning strikes will increase by 34% by the years 2056–2060 when compared to the years 2016–2020. Schultz et al. [24] sought to understand all the lightning-initiated wildfires reported in the U.S.A. from 2012 to 2015. They analyzed 1158 lightning-started wildfires. Negative cloud-to-ground flashes contributed to 90% of the wildfires, whereas positive cloud-to-ground flashes caused 10% of the wildfires. According to the fixed and fire search analyses, 81–88% of the wildfires corresponded to lightning flashes within 14 days. Moreover, most of the lightning flash densities were lower than 0.41 flashes km−2. As reported by Brey et al. [34] in Figure 3, the lightning-ignition wildfires between 1992 and 2015 in the western region of the U.S.A. were higher than the lightning-induced wildfires that occurred in the southeast region of the U.S.A.
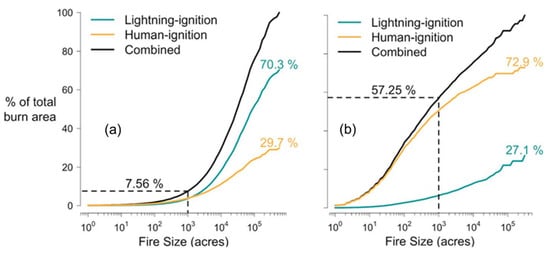
Figure 3. Wildfires in the western and southeastern parts of the U.S.A. [34]. In (a), approximately 70.3% and 29.7% of the burned area were caused by lightning and human ignitions, respectively, in the western part of the U.S.A. In (b), almost 27.1% and 72.9% of the burned area were caused by lightning and human ignitions, respectively, in the southeastern part of the U.S.A.
Aftergood and Flannigan [35] examined the lightning-caused fires in western Canada over 38 years, that is, from 1981 to 2018. They aimed to identify the areas in western Canada that experience continuous lightning fire clustering events. Northern Alberta, some parts of Saskatchewan, and British Columbia had persistent lightning fire clustering activity, with an increase in the clustering of lightning wildfires in northern Alberta. The clustering of lightning was observed in August and July in British Columbia and June and July in northern Alberta. In their study on the wildfires in Canada from 1959 to 2018, Coogan et al. [28] contended that lightning-ignition fires in Canada peaked from June to August (summer) when temperatures were high, and the weather was warmer.
2.2. Europe
Pineda et al. [36][37][38][39] have performed several studies to understand the lightning-induced wildfires in Catalonia. The authors found that conifer forests covered half of the burned area. These researchers [37] also observed that 80% of the wildfires that occurred in Catalonia occurred from June to September (summer). Therefore, the holdover duration of lightning wildfires was prolonged in the late afternoon. In Pineda et al. [36], 500 lightning-ignition datasets from 2004 to 2009 were utilized for the analysis. It was ascertained that the holdover time was shorter when the lightning flashes occurred in weather conditions suitable to cause wildfires. Moreover, evening and night ignitions smolder until the next day. In Pineda et al.’s paper [38], they reported that, whereas 25% of the lightning-ignited wildfires had no precipitation, 40% and 90% had less than 2 mm and 10 mm of precipitation, respectively.
Ordóñez et al. [40] used the spatial linear model to investigate lightning-induced wildfires in Leon, in the northwest of Spain. They used 78,256 lightning strike data in their analysis. Lightning-induced wildfires mostly occurred in the east and west of the province. Nevertheless, the altitude in the region did not significantly influence the lightning-caused wildfires. Likewise, the topography did not sustain the lightning-induced fires, but wooded areas and dry-storm days significantly influenced the survival of the lightning-caused fires. The positive lightning strikes caused the wildfires. Amatulli et al.’s [8] studies on the prediction of lightning-induced wildfires in the region of Aragon in the northeast of Spain over 19 years indicated that lightning-caused fires were few in that region. The lightning-caused wildfires occurred in large wildland patterns. The lightning-caused wildfires occurred mostly in mountainous areas. The fuel characteristics, including moisture and bio/necro-mass, significantly influenced lightning-induced wildfires. Vecín-Arias et al. [41] assessed the lightning-induced wildfires in the central plateau of the Iberian Peninsula in Spain using logistic regression and random forest analysis. Whereas lightning-induced wildfires decreased with increased altitudes, lightning-caused wildfires increased with the percentage of coniferous and mixed woodlands as well as the mean peak current of negative cloud-to-ground lightning flashes.
Müller et al.’s [42] data analysis of lightning strikes in Austria showed that lightning strikes caused 15% of wildfires. The lightning-induced fires mostly occurred in the summer. Approximately 40% of the lightning-induced fires occurred from June to August. The lightning-caused fires were predominant in the south and east of Austria. The lightning fires mostly occurred in areas with higher altitudes, owing to frequent thunderstorms and enhanced lightning density. Müller and Vacik [43] studied lightning-induced wildfires in Austria. They analyzed 351 lightning-induced wildfires using lightning strength, polarity, and multiplicity as the evaluation indices. The burned area or surface was larger when the lightning strikes ignited the vegetation during the daytime or hours. Also, lightning-induced fires were dominant at higher altitudes with southerly or western exposition. Moris and his research team [44] used 267 lightning-induced wildfire data reports from 2000 to 2018 in Switzerland to understand the relationship between lightning and natural wildfires. Most of the lightning was detected within 1 km of the starting point of the fire and before 24 h. Positive lightning strikes mostly contributed to the ignition of the forest. Sari’s [45] study of Turkey’s Mediterranean coast wildfires showed that 30.2% of the wildfires in that area were caused by lightning strikes.
2.3. Asia and Australia
Liu et al. [46] investigated the wildfire trend in the boreal forest of northeast China from 1965 to 2009 using satellite-recorded data. The writers aspired to understand the factors that influence lightning wildfires in the boreal forest. Nonetheless, lightning fires were higher in coniferous forests than in meadow forests. Also, lightning fires occurred frequently on the ridgetop. The overall conclusions of the study asserted that the key contributing factors to the lightning wildfires in the boreal forest were the type of vegetation and its moisture content, lightning intensity, slope, and temperature. Zong et al. [47] used the k-means algorithm to evaluate satellite-recorded data from 2000 to 2020 to determine the frequency of lightning-induced wildfires in China. Most of the wildfires occurred in the southern part of China; however, lightning strikes triggered 4.3% of the total number of wildfires. The Great Xing’an Mountains in Inner Mongolia are one of the most wildfire-prone areas in China; because of that, researchers have sought to understand lightning-induced wildfires in this region. Considering this, Zhang et al. [48] showed that lightning-caused wildfires were frequent from June to August in the Great Xing’an Mountains of Inner Mongolia. The air moisture content, slope, maximum surface air temperature, wind direction, and surface pressure significantly dictated the occurrence of lightning-induced wildfires. Also, the study by Hu et al. [49] used simple linear regression and second-order polynomial regression to investigate lightning-induced wildfires in the same Great Xing’an Mountains. The lightning-induced wildfires in this region have increased over time; however, the climate condition is the main cause of the increase in lightning-caused wildfires in this area. Using statistical analysis, Touge et al. [50] studied the lightning-caused wildfires in Japan. They analyzed 55,863 wildfires for a total burned area of 289.91 km2 from 1995 to 2020. The study findings revealed that lightning strikes caused only 1.23% of the wildfires.
Bates et al. [51] evaluated the lightning-strike ignition wildfires in the Warren region of Australia from 1976 to 2016. In total, 76% of the lightning strikes that ignited trees were on or close to trees. The study observed seasonal cycles and long-term patterns in lightning ignitions. Bates et al. [52] used the Bayesian network as a framework to assess climate variability in lightning-induced wildfires, and unlike the lightning ignitions, the climate modes were allied to the fire weather conditions. Dorph et al.’s [53] study in Victoria, Australia, also indicated that lightning-caused wildfires are steered by weather conditions. Clarke et al. [54] developed fire models to investigate lightning-induced wildfires in southeastern Australia, specifically Victoria, South Australia, and Tasmania. The fire weather conditions were incorporated into the model, and they constituted 57% of the lightning-ignition wildfires. Whereas 157 lightning ignitions were detected in South Australia, 472 lightning ignitions were recorded in Tasmania. In addition, the frequency of lightning-induced ignitions in Tasmania was 1.4%, 2.9% in South Australia, and 11% in Victoria. Moreover, the topography and elevation influenced the probability of lightning ignitions in the study areas. Also, Read et al. [55] studied the lightning-induced wildfires in Victoria, Australia, by fitting logistic regression models. They used lightning-strike data from February 2009 and 2010, and January 2011. Although the logistic regression could not predict well the occurrence of wildfires by lightning strikes in their research, a significant number of wildfires in Victoria were caused by lightning ignitions. Nampak et al. [56] studied lightning-induced wildfires in southeast Australia from January 2011 to June 2019. The study revealed that the annual number of lightning strikes and the ratio of negative to positive lightning were different between the years. However, lightning ignitions were found to be 70%. Lightning ignitions mostly occurred in the summer; the average lightning-ignition efficiency was 0.24% ignition per lightning stroke.
In short, various studies in different geographical locations have shown that lightning significantly contributes to the number of wildfires. Lightning-caused fires are due to severe changes in the climate and weather. The lightning-flash intensity and efficiency have increased with changes in the weather and climate in various locations, leading to severe wildfires. Though recorded lightning-ignited fire datasets have been used to simulate lightning-induced fires to assess the severity of the fires, the various works studied the severity without suggesting mitigation measures to reduce lightning-strike wildfires. Table 1 summarizes lightning wildfire studies in different geographical areas.
Table 1. Summary of studies on lightning-induced wildfire influential parameters in different geographical areas.
| Authors | Lightning Data (Years) | Geographical Location | Observations |
|---|---|---|---|
| South and North America |
|||
| Schumacher et al. [16] | 2015–2019 | Central Brazil | Wildfires occurred when precipitation was less than 1 mm and relative humidity was lower. Negative cloud-to-ground lightning flashes significantly caused wildfires. |
| Menezes et al. [17] | 2001–2017 | Brazil | Lightning caused only 5% of wildfires. |
| Veraverbeke et al. [19] | 1975–2074 | Northwest and Alaska | Lightning flashes caused 55% of wildfires. |
| Evett et al. [20] | 1990–2005 | Arizona and New Mexico | Relative humidity strongly influenced lightning-induced wildfires. |
| Hessilt et al. [21] | 2001–2018 | Alaska and northwest | Lightning flashes significantly ignited dense forests. |
| Krawchuk and Cumming [22] | 1994–2001 | Canada boreal forest | Standing harvest residuals served as a medium for lightning wildfires. |
| Calef et al. [23] | 1943–2016 | Alaska | Lightning-induced fires have dramatically increased over the years. |
| Macnamara et al. [24] | 5–10/2017 | Western U.S.A. | Negative cloud-to-ground lightning strikes caused 89% of wildfires. |
| Li et al. [25] | 1801–2100 | Western U.S.A. | Lightning-induced wildfire smoke increased by 53%. |
| Cha et al. [26] | 2010–2014 | Alberta | High- and low-frequency lightning caused 93% of lightning-related wildfires. |
| Chen and Jin [27] | 1992–2015 | California | Lightning wildfires were predominant in the Sierra Nevada. |
| Coogan et al. [28] | 1959–2018 | Canada | Lightning wildfires were high at the boreal Shield West. |
| Abatzoglou et al. [29] | 1992–2013 | Western U.S.A. | Lightning caused 40% of wildfires and 69% of burned acreage. |
| Macnamara et al. [24] | 2012–2015 | U.S.A. | In total, 90% and 10% of the lightning flashes were due to negative and positive cloud-to-ground lightning strikes, respectively. |
| Aftergood and Flannigan [35] | 1982–2018 | Western and northern Canada | Lightning wildfires increased in north Alberta. |
| Perez-Invernon et al. [30] | Up to 2090 | North America | Lightning wildfires were forecast to increase on the west coast of North America. |
| Perez-Invernon et al. [31] | 1998–2014 | Arizona and New Mexico | Coniferous forests and ponderosa pine were more susceptible to lightning fires. |
| Prestemon et al. [33] | 2011–2060 | Southeast, U.S.A. | Lightning fires will increase by 34% by the years 2056–2060. |
| Fill et al. [32] | 1897–2017 | Southeast, U.S.A. | Increased lightning fires and risks. |
| Brey et al. [34] | 1992–2015 | Southeast and western, U.S.A. | Lightning wildfires in the western part of the U.S.A. were higher than those in the southeast part of the U.S.A. |
| Europe | |||
| Pineda et al. [57] | 2003–2018 | Catalonia | Coniferous forests were more prone to lightning fires. |
| Pineda et al. [36] | 2004–2009 | Catalonia | Holdover time was shorter in weather conditions that favor wildfires. |
| Pineda and Rigo [38] | 2009–2014 | Catalonia | There was no precipitation for 25% of lightning fires, and 40% and 90% of wildfire occurrences had precipitation less than 2 mm and 10 mm, respectively. |
| Pineda et al. [39] | 2005–2020 | Catalonia | Short waves at 500 hPa caused lightning fires. |
| Ordóñez et al. [40] | 2002–2007 | Leon, Spain | Negative lightning strikes mainly ignited the forest vegetation. |
| Amatulli et al. [8] | 1983–2001 | Aragon, Spain | Lightning-caused wildfires occurred mostly in mountainous areas |
| Vecín-Arias et al. [41] | 2000–2010 | Spain | Lightning-induced wildfires increased with an increase in negative cloud-to-ground lightning strikes. |
| Muller et al. [42] | 1993–2010 | Austria | Lightning strikes initiated 15% of the wildfires. |
| Muller and Vacik [43] | Up to 2016 | Austria | Lightning-induced fires mostly occurred at higher altitudes. |
| Moris et al. [44] | 2000–2018 | Switzerland | Positive cloud-to-ground lightning flashes started lightning wildfires. |
| Sari [45] | 2013–2020 | Turkey | Lightning flashes started 30.2% of the wildfires. |
| Asia and Australia | |||
| Liu et al. [46] | 1965–2009 | Northeast China | Coniferous forests were more susceptible to lightning wildfires. |
| Zong et al. [47] | 2000–2020 | China | Lightning strikes initiated 4.3% of the total number of wildfires. |
| Zhang et al. [48] | 1986–2020 | China | Lightning-induced wildfires were rampant from June to August. |
| Hu et al. [49] | 1967–2006 | China | Climate condition is the main cause of lightning strike wildfires. |
| Touge et al. [1] | 1995–2020 | Japan | Lightning strikes caused 1.23% of the total number of wildfires. Air moisture content, slope, maximum surface air temperature, wind direction, and surface pressure significantly influenced the ignition and survival of wildfires. |
| Bates et al. [51] | 1976–2016 | Warren region, Australia | In total, 76% of lightning strikes that ignited were on or close to trees. |
| Bates et al. [52] | 41 years | Southwest Australia. | Lightning wildfires were not influenced by climate conditions. |
| Dorph et al.’s [53] | 2000–2019 | Victoria | Weather conditions enhanced lightning strikes ignition. |
| Clarke et al. [54] | 1997–2016 | Victoria, Tasmania, and South Australia | The frequency of lightning-induced ignitions in Tasmania was 1.4%, 2.9% in South Australia, and 11% in Victoria. |
| Read et al. [55] | February 2009, 2010, and January 2011 | Victoria | Lightning strikes caused a significant number of wildfires. |
| Nampak et al. [56] | January 2011–June 2019 | Southeast Australia | Lightning ignition was 70%. |
References
- Touge, Y.; Shi, K.; Nishino, T.; Sun, C.; Sekizawa, A. Spatial-temporal characteristics of more than 50,000 wildfires in Japan from 1995 to 2020. Fire Saf. J. 2024, 142, 104025.
- Oliveira, S.; Oehler, F.; San-Miguel-Ayanz, J.; Camia, A.; Pereira, J.M. Modeling spatial patterns of fire occurrence in Mediterranean Europe using multiple regression and random forest. For. Ecol. Manag. 2012, 275, 117–129.
- Jiao, Z.; Zhang, Y.; Xin, J.; Mu, L.; Yi, Y.; Liu, H.; Liu, D. A deep learning based forest Fire detection approach using UAV and YOLOv3. In Proceedings of the 2019 1st International Conference on Industrial Artificial Intelligence (IAI), Shenyang, China, 23–27 July 2019; pp. 1–8.
- Jain, P.; Coogan, S.C.P.; Subramanian, S.G.; Crowley, M.; Taylor, S.W.; Flannigan, M.D. A review of machine learning applications in wildfire science and management. Environ. Rev. 2020, 28, 478–505.
- Bera, B.; Shit, P.K.; Sengupta, N.; Saha, S.; Bhattacharjee, S. Forest fire susceptibility prediction using machine learning models with resampling algorithms, Northern part of Eastern Ghat Mountain range (India). Geocarto Int. 2022, 37, 11756–11781.
- Alkhatib, R.; Sahwan, W.; Alkhatieb, A.; Schütt, B. A brief review of machine learning algorithms in forest fires science. Appl. Sci. 2023, 13, 8275.
- Virupaksha Gouda, R.; Anoop, R.; Sameerna, J.; Basha, A.; Gali, S. Forest fire prediction using machine learning. Int. J. Res. Appl. Sci. Eng. Technol. 2023, 11, 792–797.
- Pourghasemi, H.R.; Beheshtirad, M.; Pradhan, B. A comparative assessment of prediction capabilities of modified analytical hierarchy process (M-AHP) and Mamdani fuzzy logic models using Netcad-GIS for forest fire susceptibility mapping. Geomat. Nat. Hazards Risk 2016, 7, 861–885.
- Amatulli, G.; Peréz-Cabello, F.; de la Riva, J. Mapping lightning/human-caused wildfires occurrence under ignition point location uncertainty. Ecol. Model. 2007, 200, 321–333.
- Saleh, A.; Zulkifley, M.A.; Harun, H.H.; Gaudreault, F.; Davison, I.; Spraggon, M. Forest fire surveillance systems: A review of deep learning methods. Heliyon 2024, 10, e23127.
- Singh, S.S.; Jeganathan, C. Using ensemble machine learning algorithm to predict forest fire occurrence probability in Madhya Pradesh and Chhattisgarh, India. Adv. Space Res. 2023, 73, 2969–2987.
- Arpaci, A.; Malowerschnig, B.; Sass, O.; Vacik, H. Using multi variate data mining techniques for estimating fire susceptibility of Tyrolean forests. Appl. Geogr. 2014, 53, 258–270.
- Barmpoutis, P.; Stathaki, T.; Dimitropoulos, K.; Grammalidis, N. Early fire detection based on aerial 360-degree sensors, deep convolution neural networks and exploitation of fire dynamic textures. Remote Sens. 2020, 12, 3177.
- Rodrigues, M.; De la Riva, J. An insight into machine-learning algorithms to model human-caused wildfire occurrence. Environ. Model. Softw. 2014, 57, 192–201.
- Lin, H.; Liu, X.; Wang, X.; Liu, Y. A fuzzy inference and big data analysis algorithm for the prediction of forest fire based on rechargeable wireless sensor networks. Sustain. Comput. Informatics Syst. 2018, 18, 101–111.
- Schumacher, V.; Setzer, A.; Saba, M.M.; Naccarato, K.P.; Mattos, E.; Justino, F. Characteristics of lightning-caused wildfires in central Brazil in relation to cloud-ground and dry lightning. Agric. For. Meteorol. 2022, 312, 108723.
- Menezes, L.S.; de Oliveira, A.M.; Santos, F.L.; Russo, A.; de Souza, R.A.; Roque, F.O.; Libonati, R. Lightning patterns in the Pantanal: Untangling natural and anthropogenic-induced wildfires. Sci. Total. Environ. 2022, 820, 153021.
- Neto, O.P.; Pinto, I.R.C.A.; Junior, O.P.; Williams, E.R. Evidence of a link between Amazon fires and lightning. J. Atmos. Sol. Terr. Phys. 2023, 249, 106095.
- Veraverbeke, S.; Rogers, B.M.; Goulden, M.L.; Jandt, R.R.; Miller, C.E.; Wiggins, E.B.; Randerson, J.T. Lightning as a major driver of recent large fire years in North American boreal forests. Nat. Clim. Chang. 2017, 7, 529–534.
- Evett, R.R.; Mohrle, C.R.; Hall, B.L.; Brown, T.J.; Stephens, S.L. The effect of monsoonal atmospheric moisture on lightning fire ignitions in southwestern North America. Agric. For. Meteorol. 2008, 148, 1478–1487.
- Hessilt, T.D.; Abatzoglou, J.T.; Chen, Y.; Randerson, J.T.; Scholten, R.C.; van der Werf, G.; Veraverbeke, S. Future increases in lightning ignition efficiency and wildfire occurrence expected from drier fuels in boreal forest ecosystems of western North America. Environ. Res. Lett. 2022, 17, 054008.
- Krawchuk, M.A.; Cumming, S.G. Disturbance history affects lightning fire initiation in the mixed wood boreal forest: Observations and simulations. For. Ecol. Manag. 2009, 257, 1613–1622.
- Calef, M.P.; Varvak, A.; McGuire, A.D. Differences in human versus lightning fires between urban and rural areas of the boreal forest in interior Alaska. Forests 2017, 8, 422.
- MacNamara, B.R.; Schultz, C.J.; Fuelberg, H.E. Flash characteristics and precipitation metrics of western U.S. lightning-initiated wildfires from 2017. Fire 2020, 3, 5.
- Li, Y.; Mickley, L.J.; Liu, P.; Kaplan, J.O.; Paulson, J.A. Trends and spatial shifts in lightning fires and smoke concentrations United States. Atmos. Chem. Phys. 2020, 20, 8828–8838.
- Cha, D.; Wang, X.; Kim, J.W. Assessing lightning and wildfire hazard by land properties and cloud to ground lightning data with association rule mining in Alberta, Canada. Sensors 2017, 17, 2413.
- Chen, B.; Jin, Y. Spatial patterns and drivers for wildfire ignitions in California. Environ. Res. Lett. 2022, 17, 055004.
- Coogan, S.C.P.; Cai, X.; Jain, P.; Flannigan, M.D. Seasonality and trends in human-and lightning-caused wildfires ≥ 2 ha in Canada, 1959–2018. Int. J. Wildland Fire 2020, 29, 473–485.
- Abatzoglou, J.T.; Kolden, C.A.; Balch, J.K.; Bradley, B.A. Controls on interannual variability in lightning-caused fire activity in the western US. Environ. Res. Lett. 2016, 11, 045005.
- Pérez-Invernón, F.J.; Gordillo-Vázquez, F.J.; Huntrieser, H.; Jöckel, P. Variation of lightning-ignited wildfire patterns under climate change. Nat. Commun. 2023, 14, 739.
- Pérez-Invernón, F.J.; Huntrieser, H.; Moris, J.V. Meteorological conditions associated with lightning ignited fires and long-continuing-current lightning in Arizona, New Mexico and Florida. Fire 2022, 5, 96.
- Fill, J.M.; Davis, C.N.; Crandall, R.M. Climate change lengthens southeastern USA lightning-ignited fire seasons. Glob. Chang. Biol. 2019, 25, 3562–3569.
- Prestemon, J.P.; Shankar, U.; Xiu, A.; Talgo, K.; Yang, D.; Dixon, E.; McKenzie, D.; Abt, K.L. Projecting wildfire area burned in the south-eastern United States, 2011–2060. Int. J. Wildland Fire 2016, 25, 715–729.
- Brey, S.J.; Barnes, E.A.; Pierce, J.R.; Wiedinmyer, C.; Fischer, E.V. Environmental conditions; ignition type, and air quality impacts of wildfires in the Southeastern and Western United States. Earth’s Futur. 2018, 6, 1442–1456.
- Aftergood, O.S.R.; Flannigan, M.D. Identifying and analyzing spatial and temporal patterns of lightning-ignited wildfires in Western Canada from 1981 to 2018. Can. J. For. Res. 2022, 52, 1399–1411.
- Pineda, N.; Montanyà, J.; van der Velde, O.A. Characteristics of lightning related to wildfire ignitions in Catalonia. Atmos. Res. 2014, 135–136, 380–387.
- Pineda, N.; Altube, P.; Alcasena, F.J.; Casellas, E.; Segundo, H.S.; Montanyà, J. Characterising the holdover phase of lightning-ignited wildfires in Catalonia. Agric. For. Meteorol. 2022, 324, 109111.
- Pineda, N.; Rigo, T. The rainfall factor in lightning-ignited wildfires in Catalonia. Agric. For. Meteorol. 2017, 239, 249–263.
- Pineda, N.; Peña, J.C.; Soler, X.; Aran, M.; Pérez-Zanón, N. Synoptic weather patterns conducive to lightning-ignited wildfires in Catalonia. Adv. Sci. Res. 2022, 19, 39–49.
- Ordóñez, C.; Saavedra, A.; Rodríguez-Pérez, J.; Castedo-Dorado, F.; Covián, E. Using model-based geostatistics to predict lightning-caused wildfires. Environ. Model. Softw. 2012, 29, 44–50.
- Vecín-Arias, D.; Castedo-Dorado, F.; Ordóñez, C.; Rodríguez-Pérez, J.R. Biophysical and lightning characteristics drive lightning-induced fire occurrence in the central plateau of the Iberian Peninsula. Agric. For. Meteorol. 2016, 225, 36–47.
- Müller, M.M.; Vacik, H.; Diendorfer, G.; Arpaci, A.; Formayer, H.; Gossow, H. Analysis of lightning-induced forest fires in Austria. Theor. Appl. Clim. 2013, 111, 183–193.
- Müller, M.M.; Vacik, H. Characteristics of lightnings igniting forest fires in Austria. Agric. For. Meteorol. 2017, 240–241, 26–34.
- Moris, J.V.; Conedera, M.; Nisi, L.; Bernardi, M.; Cesti, G.; Pezzatti, G.B. Lightning-caused fires in the Alps: Identifying the igniting strokes. Agric. For. Meteorol. 2020, 290, 107990.
- Sari, F. Identifying anthropogenic and natural causes of wildfires by maximum entropy method-based ignition susceptibility distribution models. J. For. Res. 2022, 34, 355–371.
- Liu, Z.; Yang, J.; Chang, Y.; Weisberg, P.J.; He, H.S. Spatial patterns and drivers of fire occurrence and its future trend under climate change in a boreal forest of Northeast China. Glob. Chang. Biol. 2012, 18, 2041–2056.
- Zong, X.; Tian, X.; Liu, J. A fire regime zoning system for China. Front. For. Glob. Chang. 2021, 4, 717499.
- Zhang, Q.; Homayouni, S.; Yao, H.; Shu, Y.; Li, M.; Zhou, M. Joint analysis of lightning-induced forest fire and surface influence factors in the Great Xing’an Range. Forests 2022, 13, 1867.
- Hu, T.; Zhou, G. Drivers of lightning- and human-caused fire regimes in the Great Xing’an Mountains. For. Ecol. Manag. 2014, 329, 49–58.
- Lecina-Diaz, J.; Alvarez, A.; Retana, J. Extreme fire severity patterns in topographic, convective and wind-driven historical wildfires of Mediterranean pine forests. PLoS ONE 2014, 9, e85127.
- Bates, B.C.; McCaw, L.; Dowdy, A.J. Exploratory analysis of lightning-ignited wildfires in the Warren Region, Western Australia. J. Environ. Manag. 2018, 225, 336–345.
- Bates, B.C.; Dowdy, A.J.; McCaw, L. A Bayesian approach to exploring the influence of climate variability modes on fire weather conditions and lightning-ignited wildfires. Clim. Dyn. 2021, 57, 1207–1225.
- Dorph, A.; Marshall, E.; Parkins, K.A.; Penman, T.D. Modelling ignition probability for human- and lightning-caused wildfires in Victoria, Australia. Nat. Hazards Earth Syst. Sci. 2022, 22, 3487–3499.
- Clarke, H.; Gibson, R.; Cirulis, B.; Bradstock, R.A.; Penman, T.D. Developing and testing models of the drivers of anthropogenic and lightning-caused wildfire ignitions in south-eastern Australia. J. Environ. Manag. 2019, 235, 34–41.
- Read, N.; Duff, T.J.; Taylor, P.G. A lightning-caused wildfire ignition forecasting model for operational use. Agric. For. Meteorol. 2018, 253–254, 233–246.
- Nampak, H.; Love, P.; Fox-Hughes, P.; Watson, C.; Aryal, J.; Harris, R.M.B. Characterizing spatial and temporal variability of lightning activity associated with wildfire over Tasmania, Australia. Fire 2021, 4, 10.
- Marino, E.; Dupuy, J.-L.; Pimont, F.; Guijarro, M.; Hernando, C.; Linn, R. Fuel bulk density and fuel moisture content effects on fire rate of spread: A comparison between FIRETEC model predictions and experimental results in shrub fuels. J. Fire Sci. 2012, 30, 277–299.
More
Information
Subjects:
Meteorology & Atmospheric Sciences
Contributors
MDPI registered users' name will be linked to their SciProfiles pages. To register with us, please refer to https://encyclopedia.pub/register
:
View Times:
921
Revisions:
2 times
(View History)
Update Date:
12 Mar 2024
Table of Contents


Notice
You are not a member of the advisory board for this topic. If you want to update advisory board member profile, please contact office@encyclopedia.pub.
OK
Confirm
Only members of the Encyclopedia advisory board for this topic are allowed to note entries. Would you like to become an advisory board member of the Encyclopedia?
Yes
No
${ textCharacter }/${ maxCharacter }
Submit
Cancel
Back
Comments
${ item }
|
${ item.createdUser.fullName }
${ item.createdAt }
${ item.vote }
${ item.reply }
Delete
${ reply.createdUser.fullName }
${ reply.createdAt }
${ reply.vote }
Delete
There is no reply to this comment~
${ item.replyTextCharacter }/${ item.replyMaxCharacter }
Submit
Cancel
More
No more~
There is no comment~
${ textCharacter }/${ maxCharacter }
Submit
Cancel
${ selectedItem.replyTextCharacter }/${ selectedItem.replyMaxCharacter }
Submit
Cancel
Confirm
Are you sure to Delete?
Yes
No