1. Test and Measurement Methods for Air Distribution Uniformity in a Large-Scale CFB Boiler
Primary air not only provides the original power for fluidizing the bed material inside the furnace but also serves as the initial oxidizer for the combustion reaction of coal. The uniformity of primary air distribution is crucial in ensuring the fluidization quality within the furnace of a CFB boiler. Numerous cold-state model tests and simulation calculations have shown that the uniformity of primary air distribution in CFB boilers is influenced by the resistance of the air distribution plate [1], as well as the method of air inlet [2][3]. The formation of a recirculation zone inside the air chamber is identified as a major factor causing uneven air distribution [4], while the air velocity distribution is relatively less affected by temperature [5]. However, there has been limited research on this topic from field tests. Meng et al. [6], analyzed the issue of low air velocity on both sides of the air chamber and excessive air volume in the central part for a 300 MW CFB boiler with air inlet on the short sides. They pointed out that the uneven static pressure distribution in the air chamber was the main cause of uneven primary air distribution and proposed a modification plan to achieve uniform air distribution by increasing the resistance of the air cap in the central region. Zhang et al. [7] and Li et al. [8] reflected the unevenness of air distribution from the perspective of bed pressure fluctuation. They mainly analyzed the instability of lateral movement of bed material on a large bed surface and the impact of return ash on bed pressure fluctuations.
Yan et al. [9][10] conducted cold-state measurements on the primary air distribution uniformity of the air distribution plates in a 600 MW supercritical CFB boiler. The boiler features a “pant-leg” furnace structure with a single furnace chamber and dual air distribution plates. Each side of the air distribution plate is 4 m wide and 27.9 m deep. Due to the influence of the “pant-leg” structure, there is a 72° tilt angle on the inner wall. The air is supplied through the rear wall, and a recirculation zone is prone to occur in the rear wall section, leading to uneven air distribution along the depth direction of the furnace.
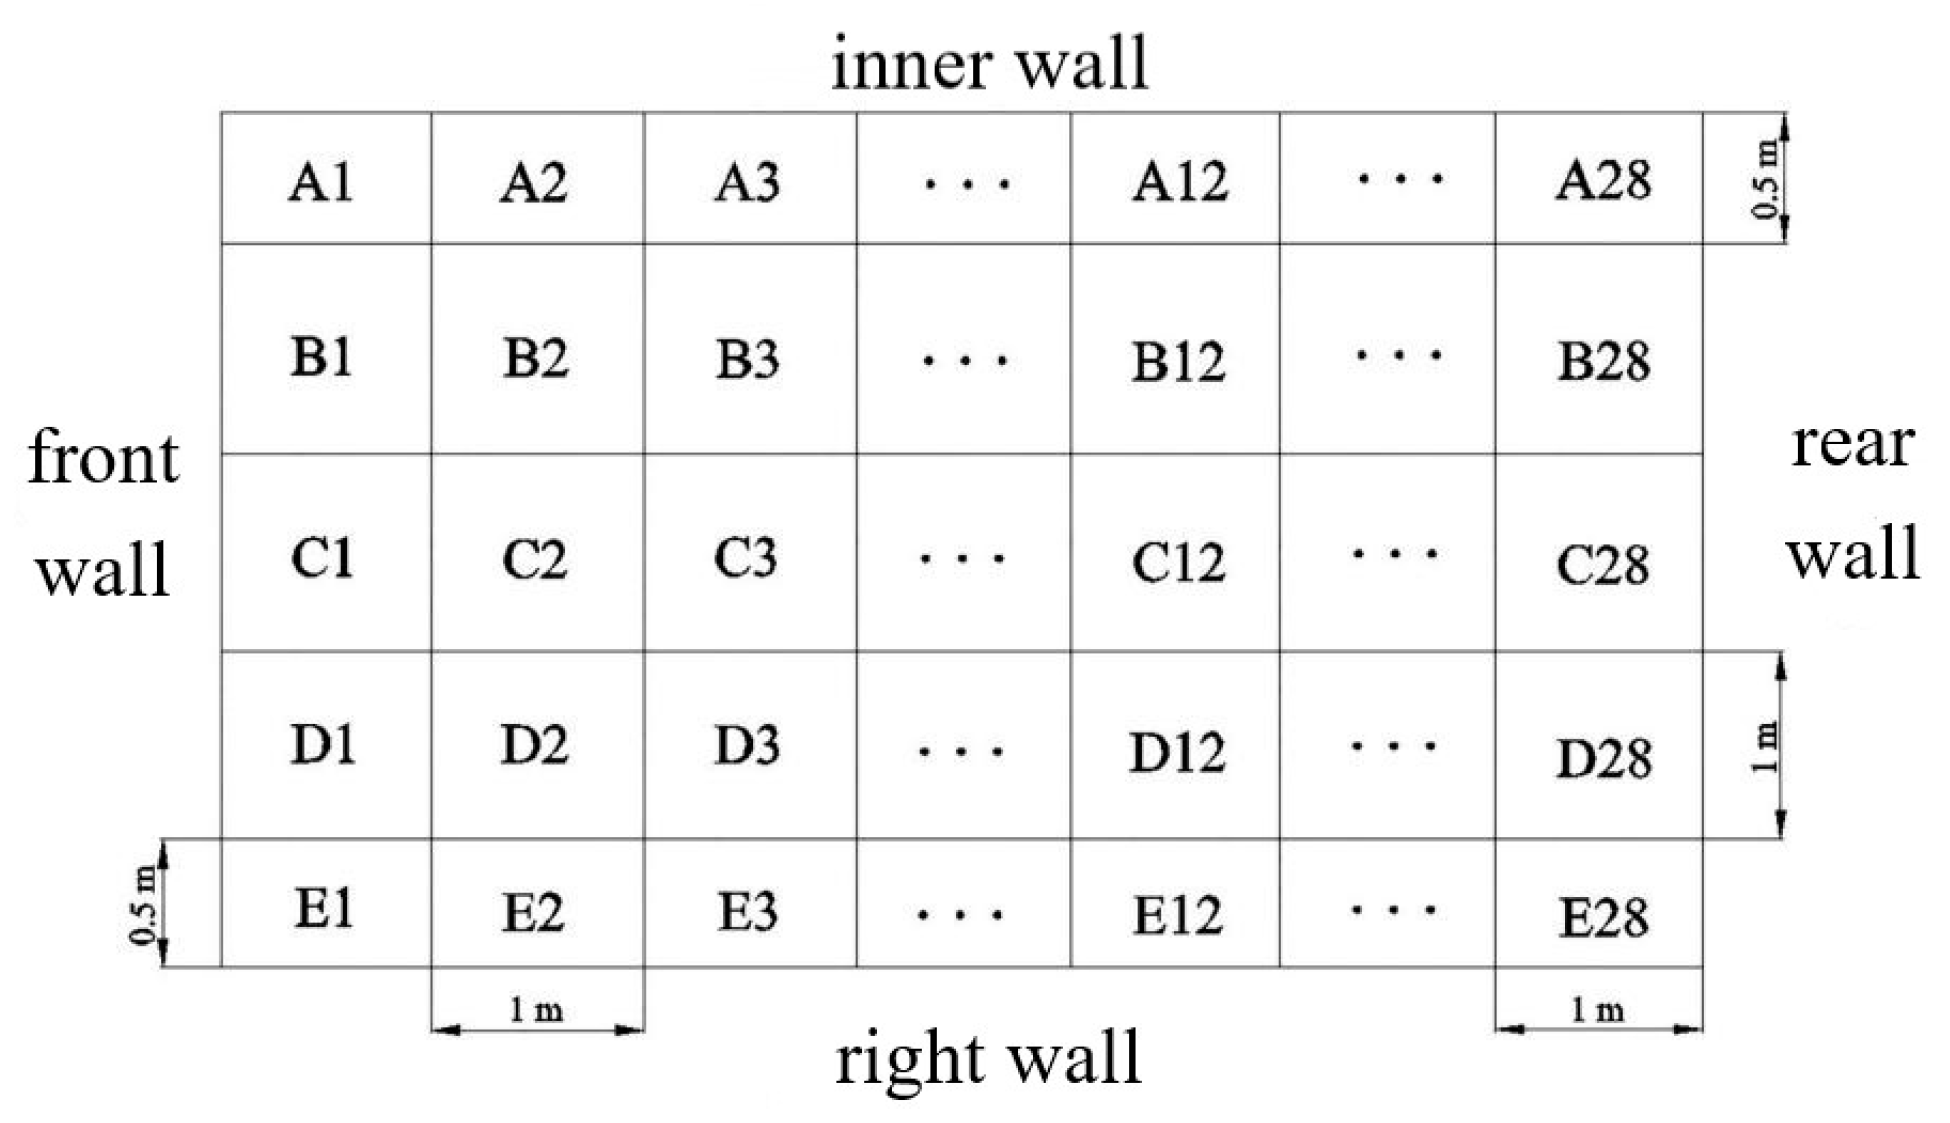
During the measurement, each air distribution plate was uniformly divided into 5 × 28 rectangular sections using a grid method. Each grid was approximately 1 m × 1 m (with a width of 0.5 m on both sides). The grids were numbered sequentially along the width of the furnace from A to E and along the depth direction from the front wall to the rear wall from 1 to 28, as shown in Figure 1. The measurement points were located at the center of each grid, 1.2 m away from the air distribution plate. Five measurements were taken at each point, and the average value was calculated. For the measurements, iron rods of appropriate length were used to fix the measuring instrument at the measurement height. The KA23 thermal anemometer was selected as the measuring instrument, with a measurement range of 0 to 50 m/s and a measurement accuracy of 0.01 m/s. The uniformity of primary air distribution was measured under fans output loads of 100%, 85%, and 70% in the cold state.
Figure 1. Generation of the air distributor in the right furnace of the 600 MW CFB boiler, with each mesh corresponding a measuring point
[9].
Figure 2 presents the velocity contour maps of the left and right air distribution plates in the cross-section of the 600 MW supercritical CFB boiler under measurement conditions. It can be observed that the low-speed area at the rear of the air chamber was more extensive than the front, and there were random points with relatively high wind speeds.
Figure 2. Contours of velocity magnitude over the left and right air distributor plates under various air volumes. (
a) Left—100% load; (
b) right—100% load; (
c) right—85% load; (
d) right—70% load
[10].
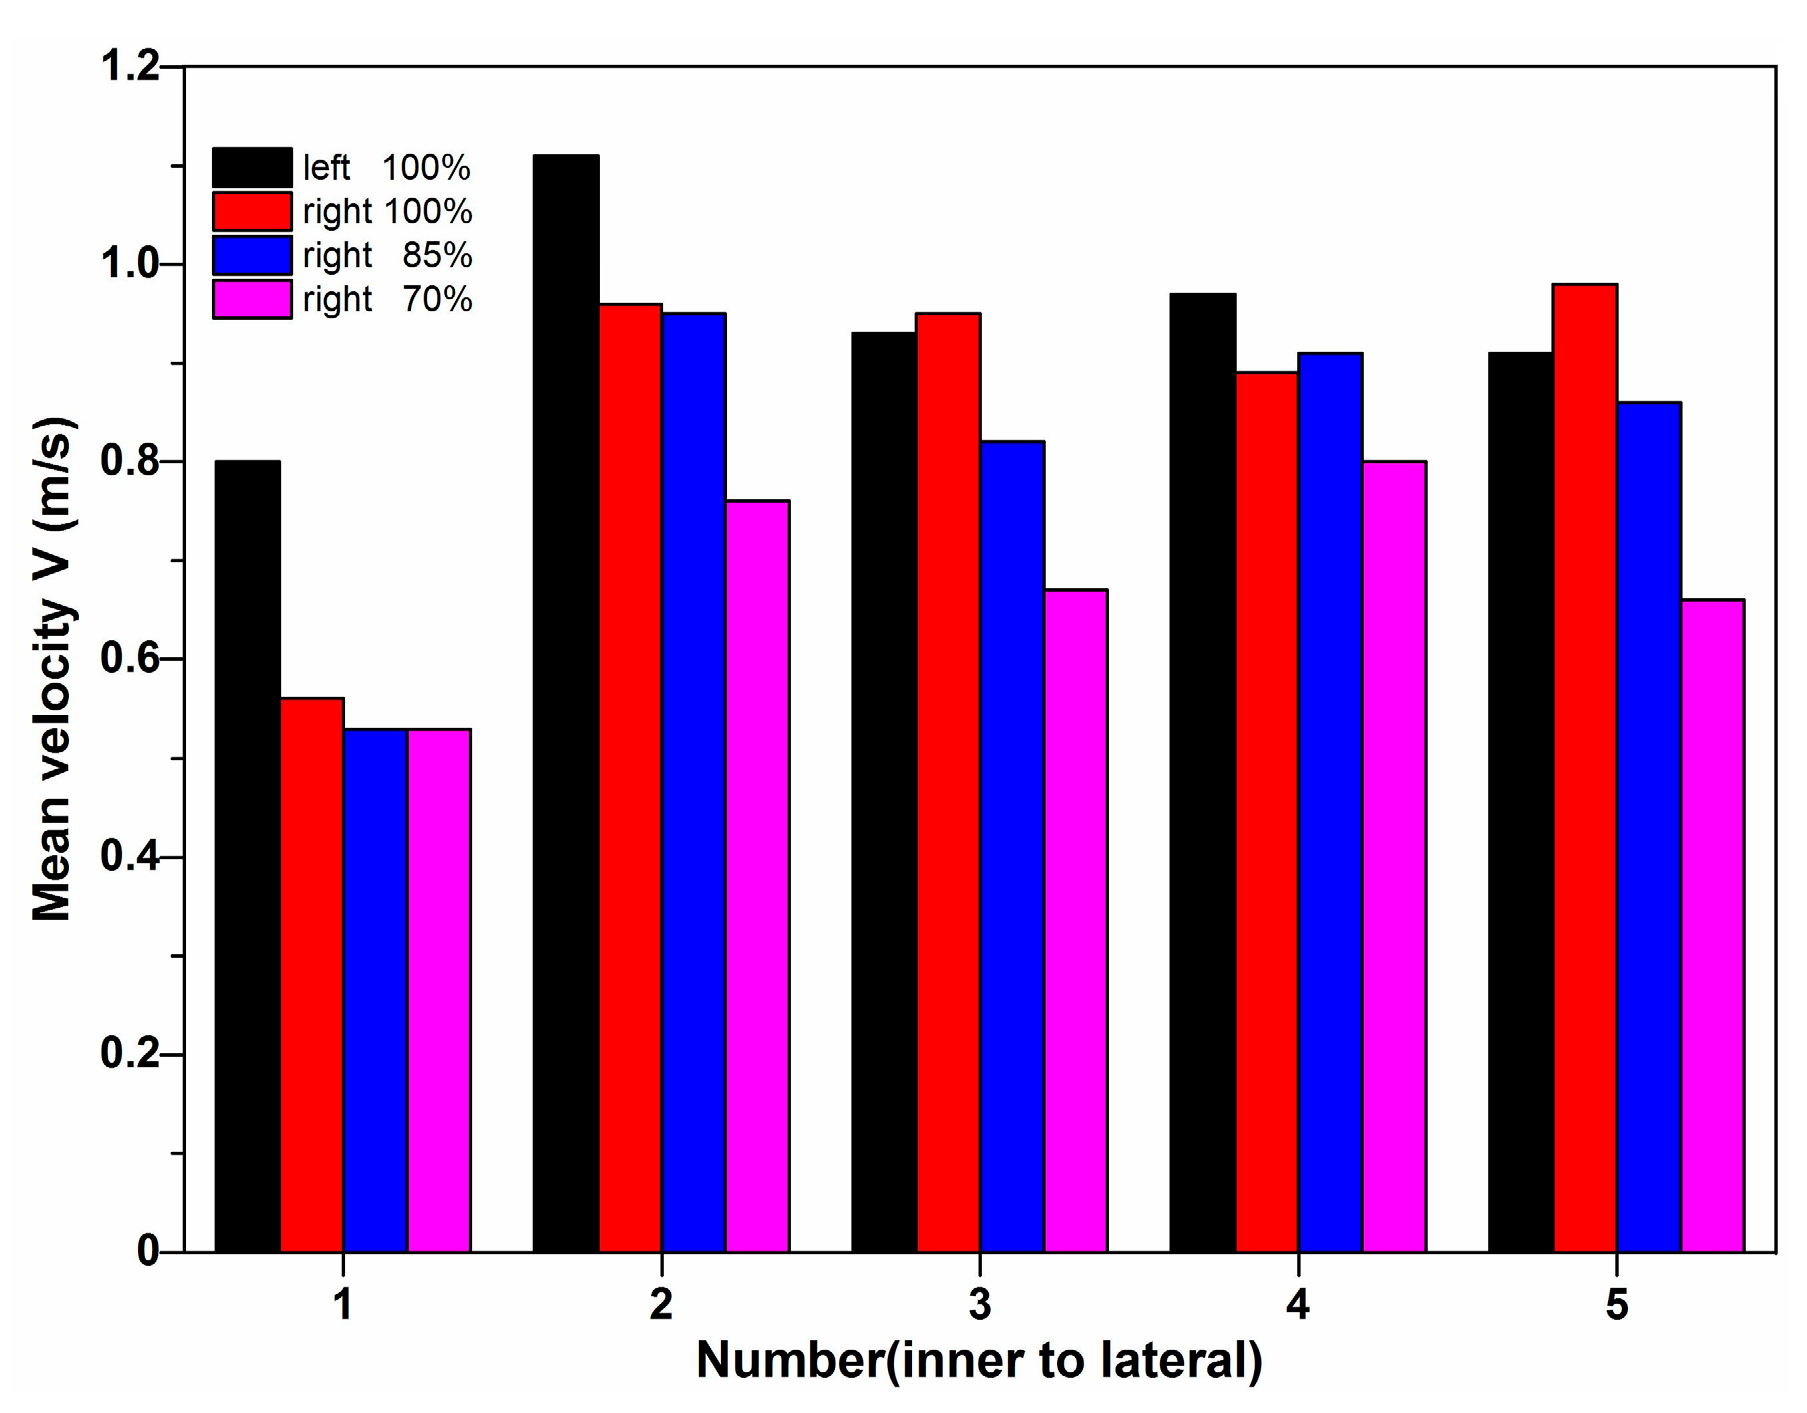
Figure 3 reflects the velocity distribution in the width direction of the air chamber under different loads corresponding to fluidization air volume. The inclination of the inner wall and the distance between the first row of air caps and the inner wall resulted in lower velocities near the inner wall.
Figure 3. Air velocity distributions along the air chamber width [10].
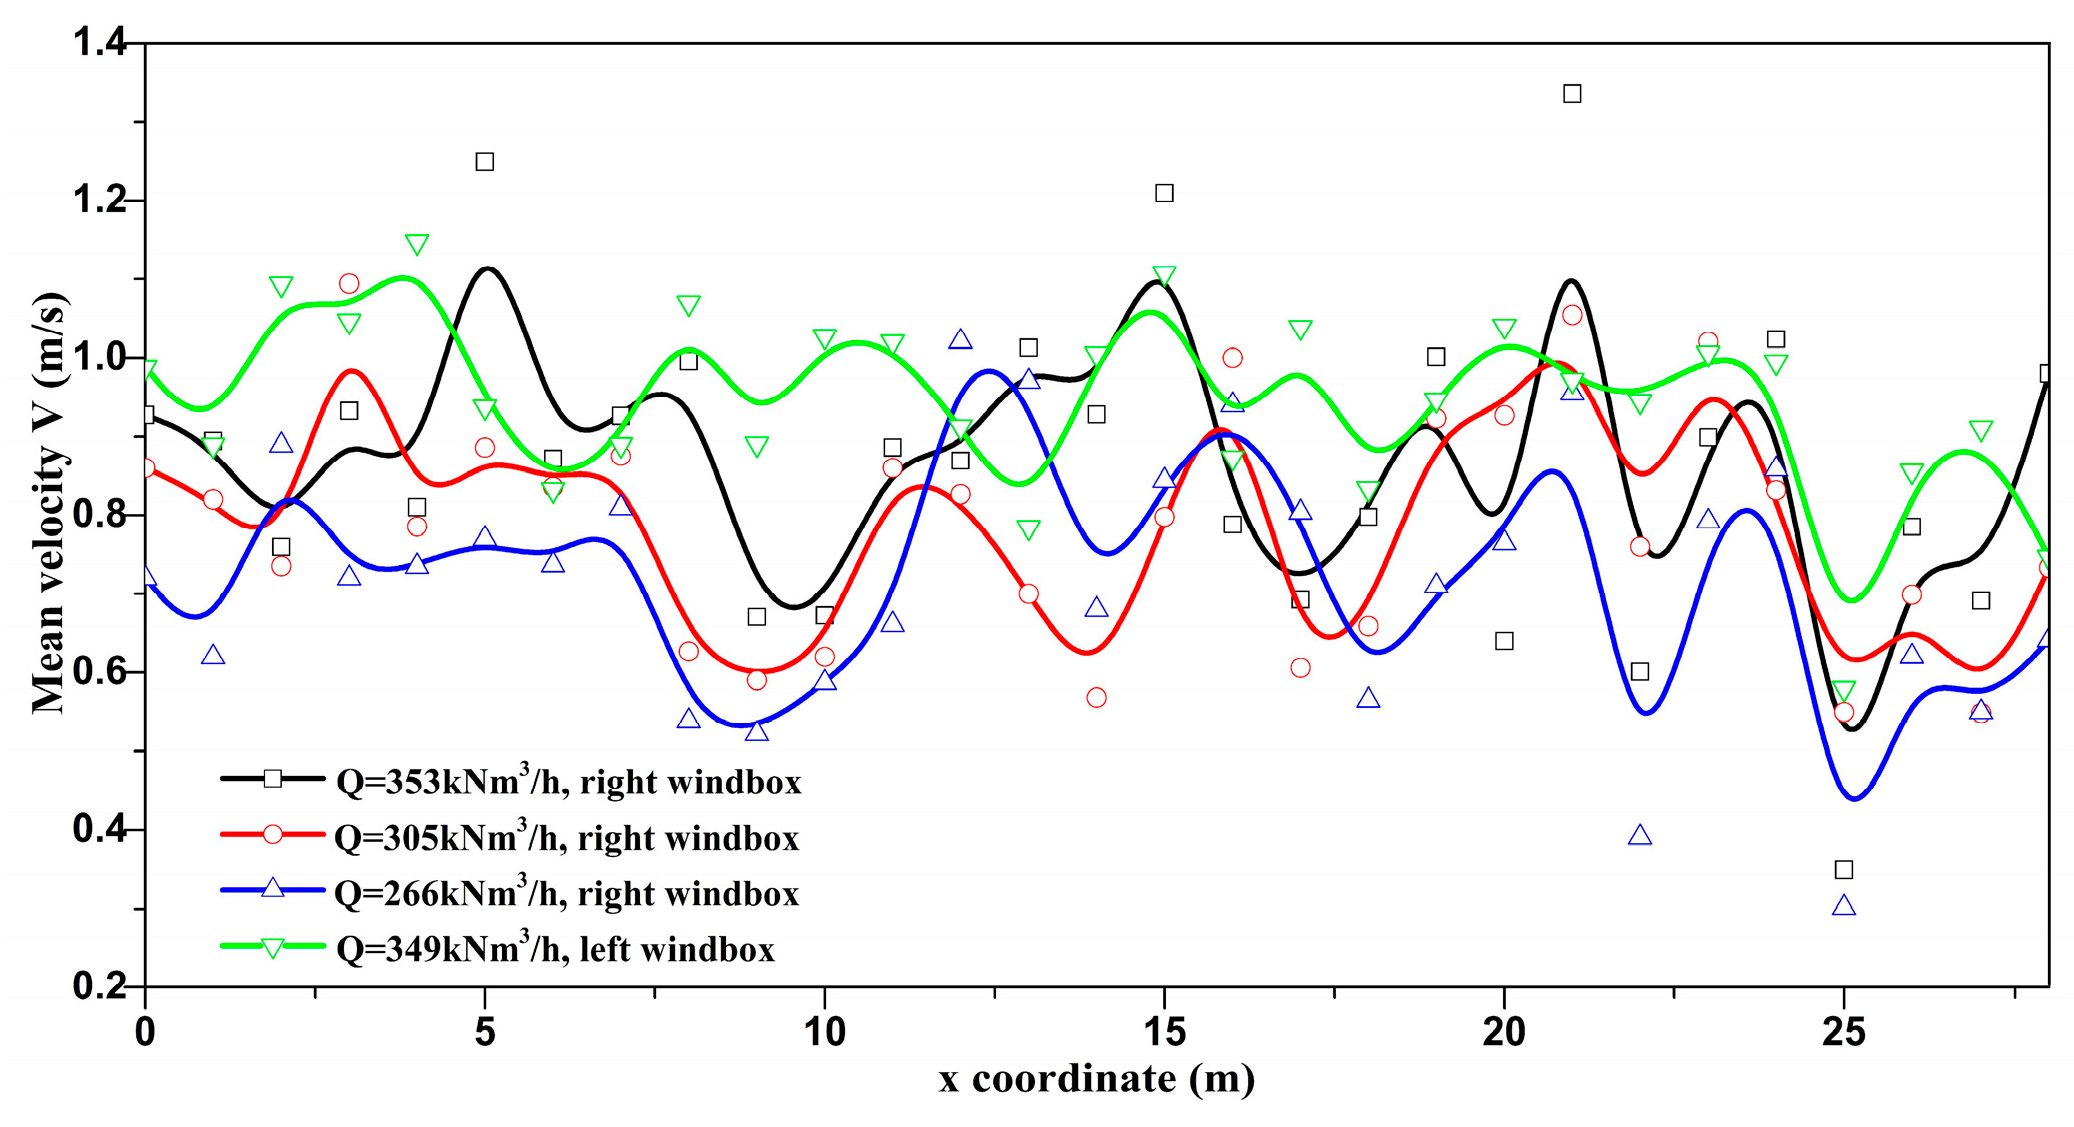
Figure 4 illustrates the velocity distribution along the length direction of the air chamber, showing similar and fluctuating velocity distributions under different operating conditions. This was speculated to be due to the replacement of some air caps after long-term operation and maintenance, resulting in differences in the integrity of each air cap.
Figure 4. Air velocity distributions along the air chamber depth
[10].
In addition, utilizing capacitance probe detection technology to measure the solid suspension density in specific regions of the furnace is an effective method for conducting uniformity experiments on CFB boilers
[11][12]. The dielectric constant of the local region in the two-phase flow can be obtained through the capacitance measurement system. This dielectric constant is related to the void fraction. Werther and Molerus
[13] were among the pioneers in using needle-type capacitance probes to measure bubble characteristics in fluidized beds. However, traditional capacitance measurement systems, influenced by the capacitance between the probe and cables, may lead to system instability. Riley and Louge
[14] introduced a guard electrode to shield external capacitance interference, significantly enhancing the sensitivity and stability of capacitance probes. With the maturation of capacitance probe detection technology, it has found widespread application in measuring cold-state and full-scale experimental solid concentrations in specific regions of CFB reactors.
Guo et al.
[15] used capacitance probes to compare the impact of high-pressure drop air caps and low-pressure drop air caps on the voidage in the riser in a laboratory-scale CFB reactor. Chen et al.
[16] employed a similar method to determine the fluidization range of the air cap in actual large-scale CFB boilers. Sun et al.
[17][18] borrowed from similar principles and conducted uniformity tests on the cold dense phase zone in the external heat exchanger beds of a 600 MW CFB boiler using a self-made resistance probe. They found that wall surface roughness had a significant impact on fluidization quality. An area of poor fluidization quality was identified near the rough wall surface.
Hage at el.
[11] reported a water-cooled needle-type capacitance probe measurement system designed for in situ measurements in a full-scale setting, illustrated in
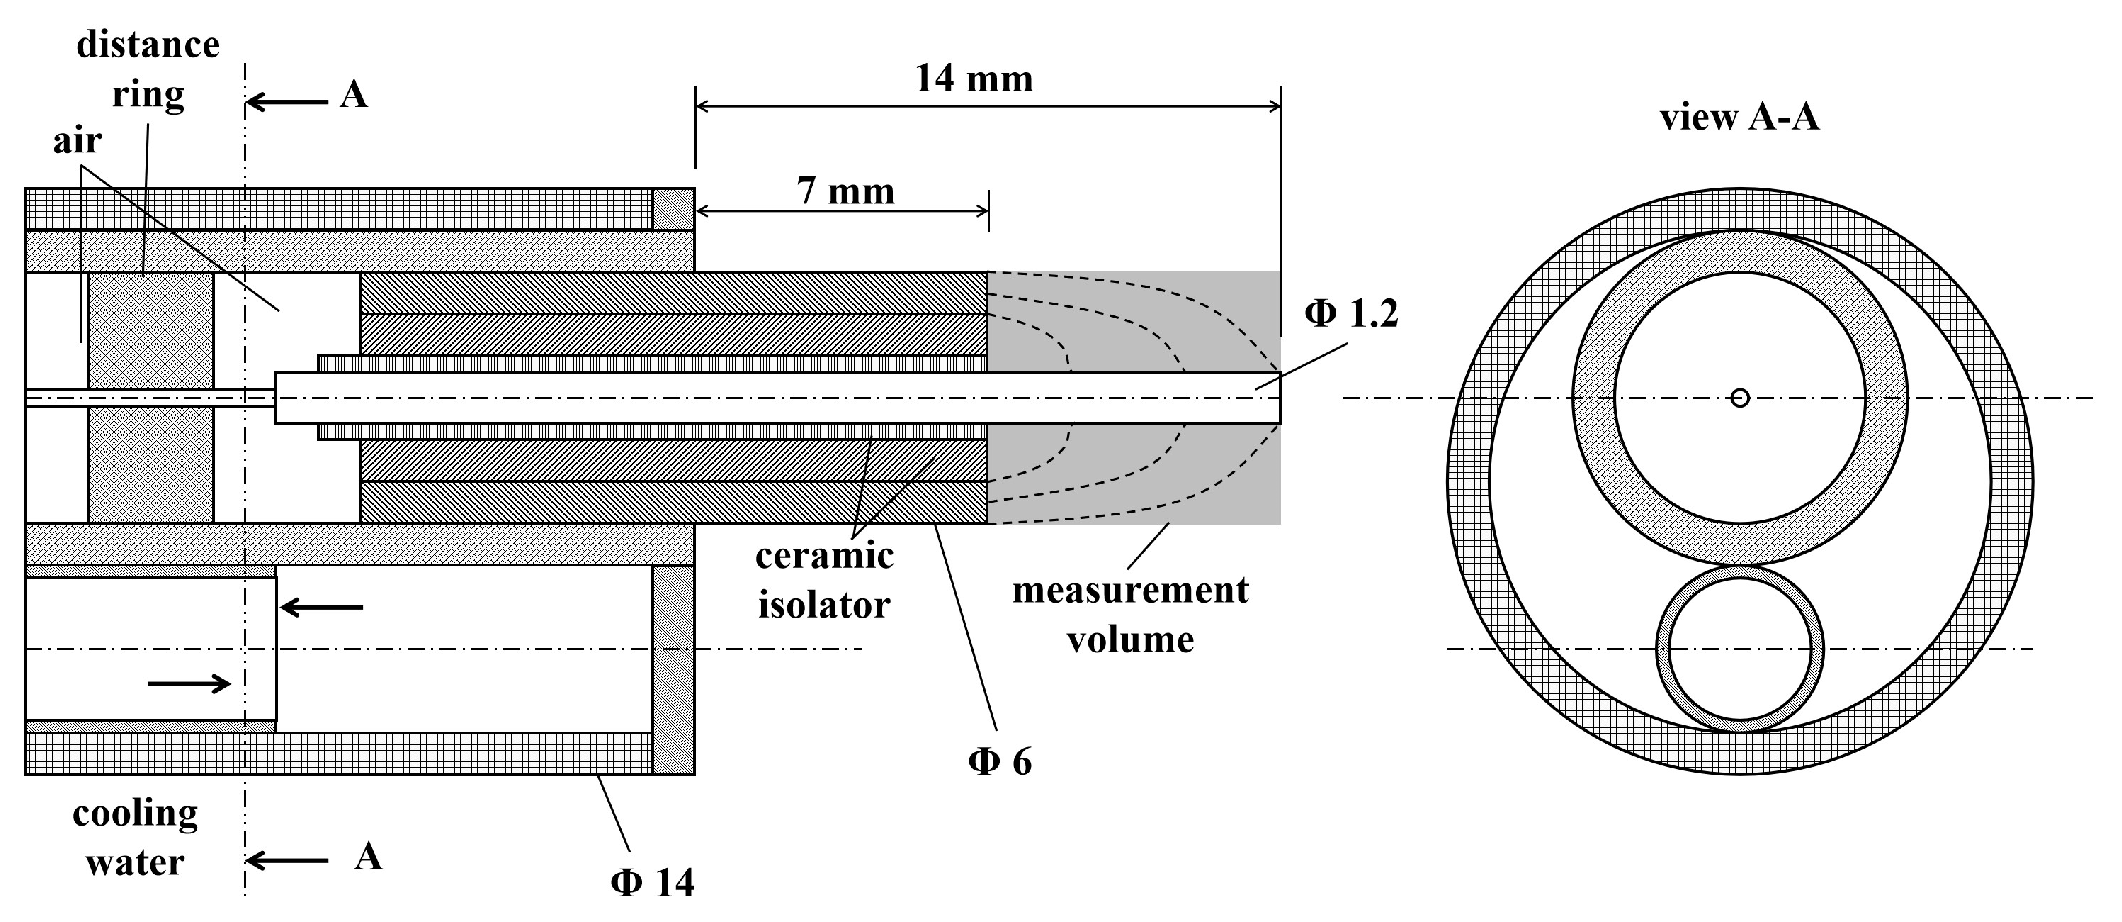
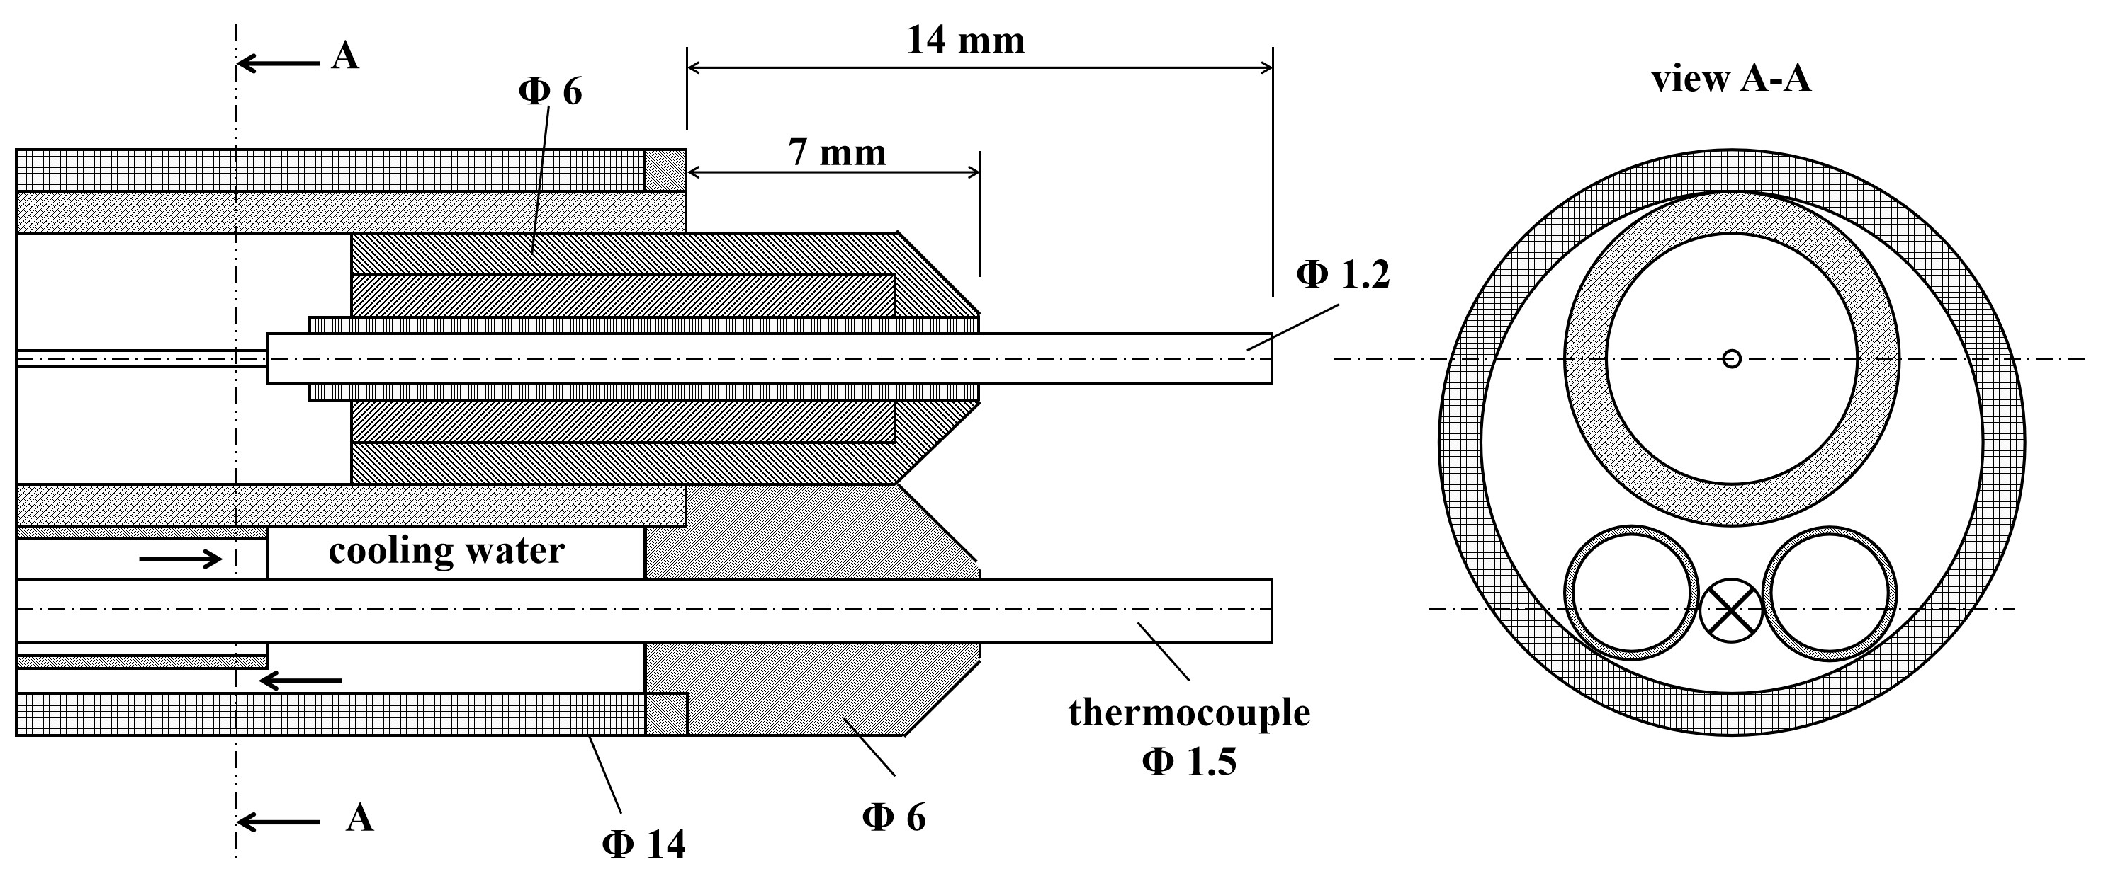
Figure 5. The main body of the water-cooled capacitance probe was constructed from stainless steel with an outer diameter of 14 mm. The probe extended 14 mm beyond the water-cooled sleeve to prevent the probe from reaching too low temperatures, which could lead to ash deposition during the in situ measurement process. The measurement area of the probe was a cylindrical region with the same length (7 mm) as the exposed probe electrode and the same diameter (6 mm) as the ring electrode. A coaxial steel pipe was added between the probe electrode and the ground ring electrode as a protective device, and a ceramic tube was used to maintain electrical insulation between the electrodes. During capacitance probe measurements, the results were significantly influenced by the temperature of the measurement area. Therefore, obtaining real-time temperature information for the measurement area is crucial. Hage also introduced a water-cooled needle-type capacitance probe with a thermocouple, as depicted in
Figure 6. Calibration of this testing system was conducted on a pilot-scale CFB experimental platform.
Figure 5. Water-cooled capacitance probe schematic diagram
[11].
Figure 6. Water-cooled capacitance probe with thermocouple schematic diagram
[11].
Hage and Werther
[19] conducted field tests on a 109 MW CFB boiler using a water-cooled needle-type capacitance probe measurement system similar to that shown in
Figure 5. In the full-scale test, there were slight modifications to the capacitance probe structure compared to
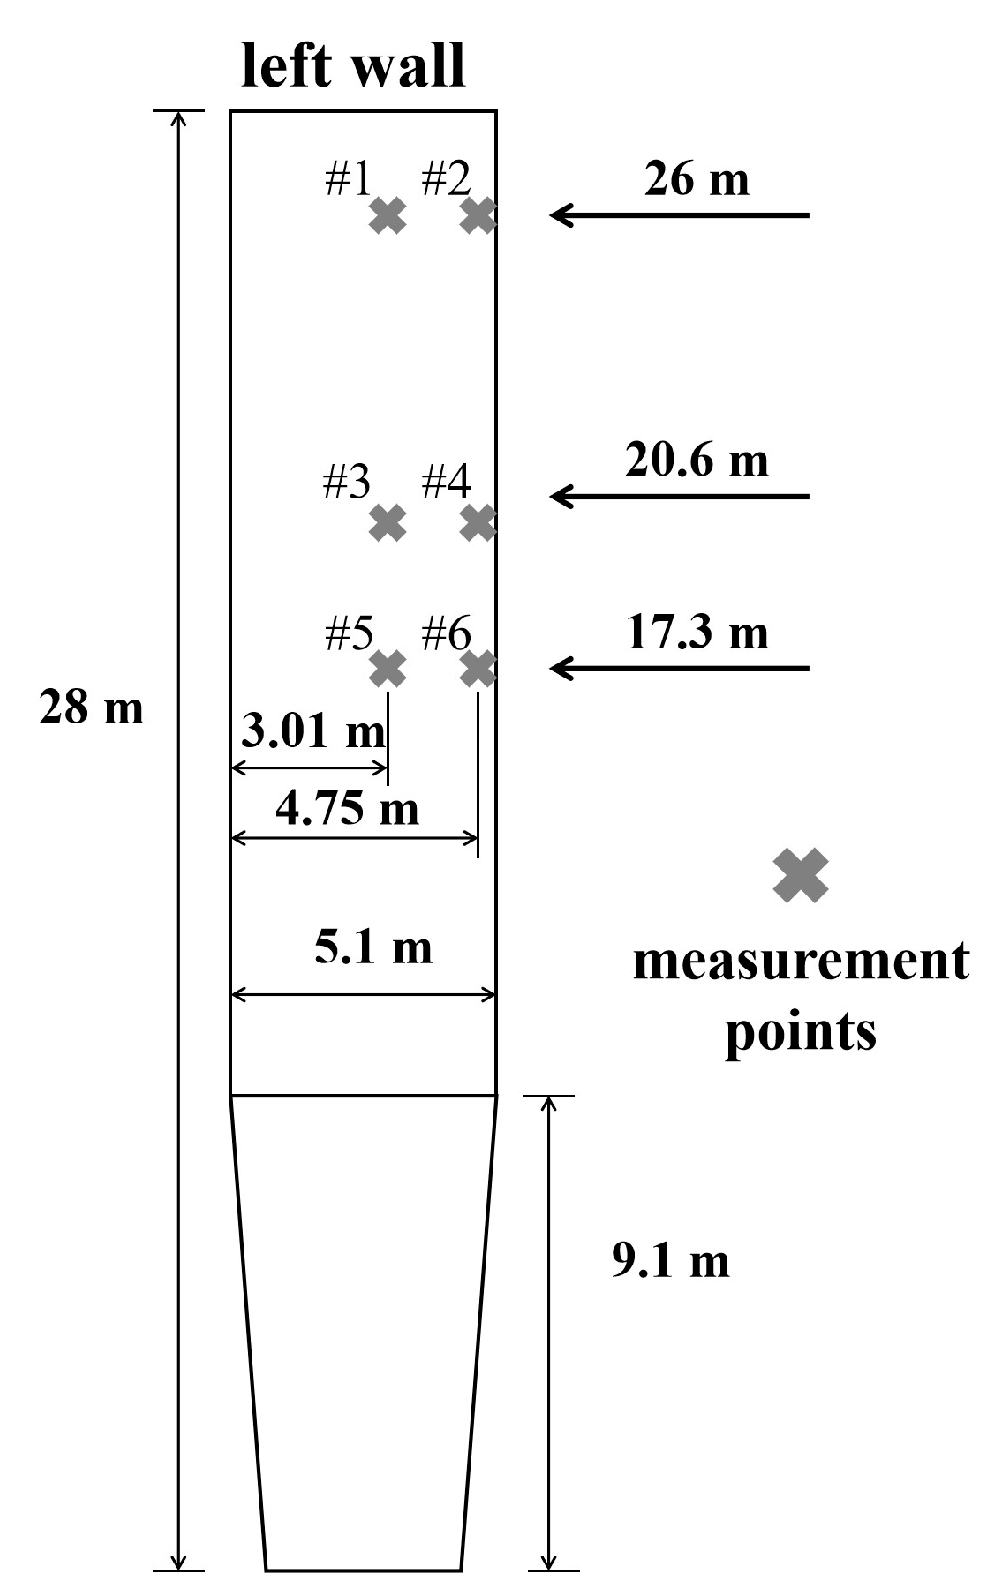
Figure 5. To ensure the strength of the capacitance probe, the outer diameter of the water-cooled sleeve was increased to 22 mm, and the exposed probe electrode length was reduced to 5 mm to prevent probe bending. The 109 MW CFB boiler had a height of 28 m, a width of 4.74 m, and a depth of 5.1 m. During the experiment, six measurement points were set in three layers on the left wall of the boiler, with a maximum measurement depth of 1 m at each point. The schematic diagram of the measurement point locations is shown in
Figure 7. Relevant field tests were conducted under 100% boiler maximum continuous rating (BMCR) load conditions.
Figure 7. Schematic diagram of measurement point locations on the 109 MW CFB boiler
[19].
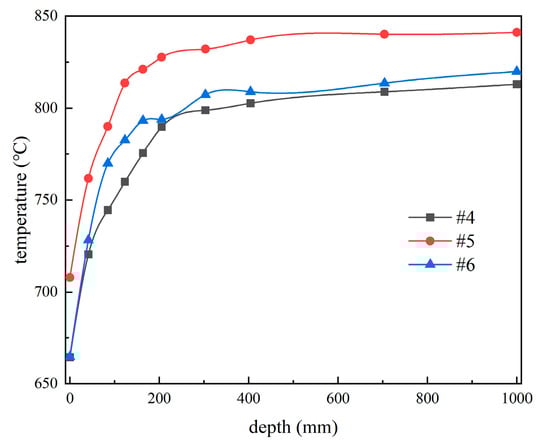
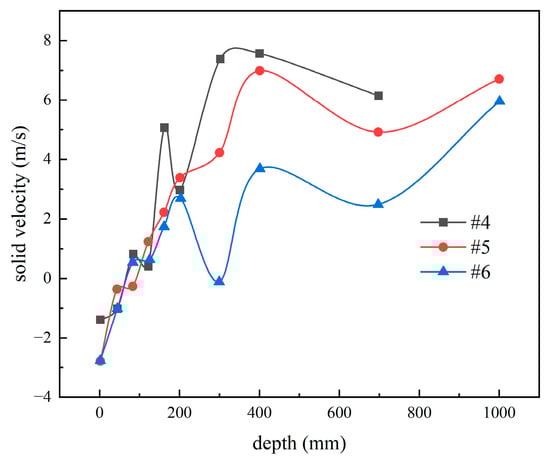
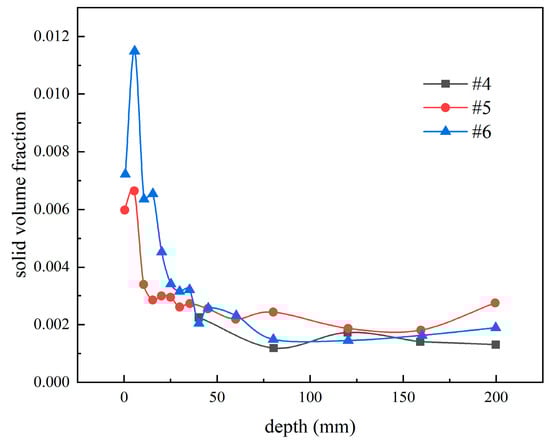
The relevant study reported variations in furnace temperature, solid particle velocity, and solid particle volume fraction at different depths near the water-cooled wall at measurement points #4, #5, and #6, as depicted in Figure 8, Figure 9 and Figure 10. In the near-wall region within a 1 m range, the temperature variation trend is shown in Figure 8. A temperature boundary layer with significant changes was observed within the 0–400 mm thickness range, exhibiting a temperature difference of approximately 150 °C. As illustrated in Figure 9, a rapid change region in solid velocity was present within the 0–400 mm range. With increasing depth, the solid velocity quickly increased from −3~−1.5 m/s to 4~7 m/s and remained relatively stable. The region of rapid change in furnace temperature coincided with the region of rapid change in solid particle velocity.
Figure 8. Relationship between furnace temperature and measurement depth
[19].
Figure 9. The relationship between solid particle velocity and measurement depth varies
[19].
Figure 10. The relationship between the variation of solid particle volume fraction and measurement depth
[19].
The trend of solid volume fraction variation in the near-wall region at 0–200 mm is shown in Figure 10. It was observed that the solid volume fraction values at different measurement points were similar, with consistent trends. Within the 0–50 mm range, the solid volume fraction decreased rapidly and eventually stabilized around 0.0015. The results of the relevant field tests validated the existence of a “core-annular” structure in industrial CFB boilers, and the range of particle clusters in the downflow near the wall was approximately 0–100 mm.
Wiesendorf et al.
[20][21] further introduced various capacitance probes, including non-water-cooled ones, capacitance probe testing systems with zirconia probes (to measure the impact of oxygen content in the measurement area), dual-probe capacitance probes, and more. These variations aimed to address the challenges posed by complex and dynamic field test scenarios. Conducting field tests at the bottom of a 250 MW CFB boiler, they compared the test results with those from laboratory-scale cold-model experiments. The comparison demonstrated that even under the complex gas–solid flow conditions in an industrial-scale CFB boiler, capacitance probe testing technology can achieve good results in experiments on the fluidization uniformity of local regions.
2. Secondary Air Injection Range and Influencing Characteristics in a Large-Scale CFB Boiler
CFB boilers often have secondary air nozzles arranged at the boundary between the dilute phase and dense phase in a furnace, which significantly influences the fluidization construction of the dilute phase fast fluidized bed and the formation of the “core-annular flow”. On the other hand, the secondary air plays a crucial role in staged combustion, contributing to the boiler’s combustion efficiency and pollution control. The impact of secondary air on gas–solid flow and the combustion process is closely related to the penetration performance and influence range of the jet. Current research on secondary air jets is mostly limited to laboratory-scale cold-model test devices using tracer methods. Ersoy et al.
[22] studied the influence of the secondary air rate on particle velocity. Kim and Shakourzadeh
[23], and Marzocchella and Arena
[24] investigated the impact of secondary air jets on particle concentration in the adjacent region. Li et al.
[25] and Ji et al.
[26] examined the influence of nozzle shape on secondary air jets from different perspectives. Due to the differences in dimensions between actual boilers and cold-model test devices, as well as a wide range of bed material particle size distribution in actual boilers, there are certain discrepancies in the diffusion characteristics of the secondary air jets between the cold-state test device and the actual boiler. However, corresponding studies on full-scale boiler field tests are limited. Wang et al.
[27][
42] conducted a detailed air distribution adjustment for a 440 t/h CFB boiler in a power plant. By adjusting the air volume ratio of secondary air at different heights and using the temperature field and carbon content of fly ash as criteria, they investigated the impact of air distribution on combustion efficiency inside the furnace.
Yan et al.
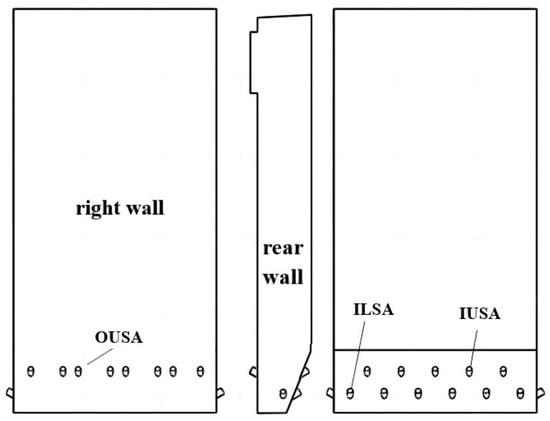
[10][28] conducted a systematic study on the secondary air system air distribution uniformity, penetration range, and influence area of a 600 MW supercritical CFB boiler using a sampling device adapted for high-temperature positive pressure dust-containing flue gas inside the furnace. The secondary air system of the 600 MW supercritical CFB boiler was symmetrically arranged on the left and right, with the air distribution shown in
Figure 11. The boiler was equipped with two layers comprising a total of 42 secondary air nozzles. The lower layer was called the internal lower secondary air (ILSA), located about 2.5 m from the air distribution plates. The higher layer was divided into internal upper secondary air (IUSA) and outside upper secondary air (OUSA), located about 5.5 m from the air distribution plates. To extend the range of secondary air injection, all the nozzles were inclined 30° downward horizontally. To investigate the penetration range and influence characteristics of the secondary air, the air velocity of each secondary air nozzle was initially balanced in the cold state. Pre-installation and calibration of venturi tubes for measuring the secondary air velocity were carried out on the anticipated measurement branches of the secondary air pipes. The cold-state measurement results were corrected for air temperature and specific volume to obtain the velocity of each secondary air nozzle in the hot state.
Figure 11. Drawings of the secondary air nozzles in 600 MW CFB boiler
[10].
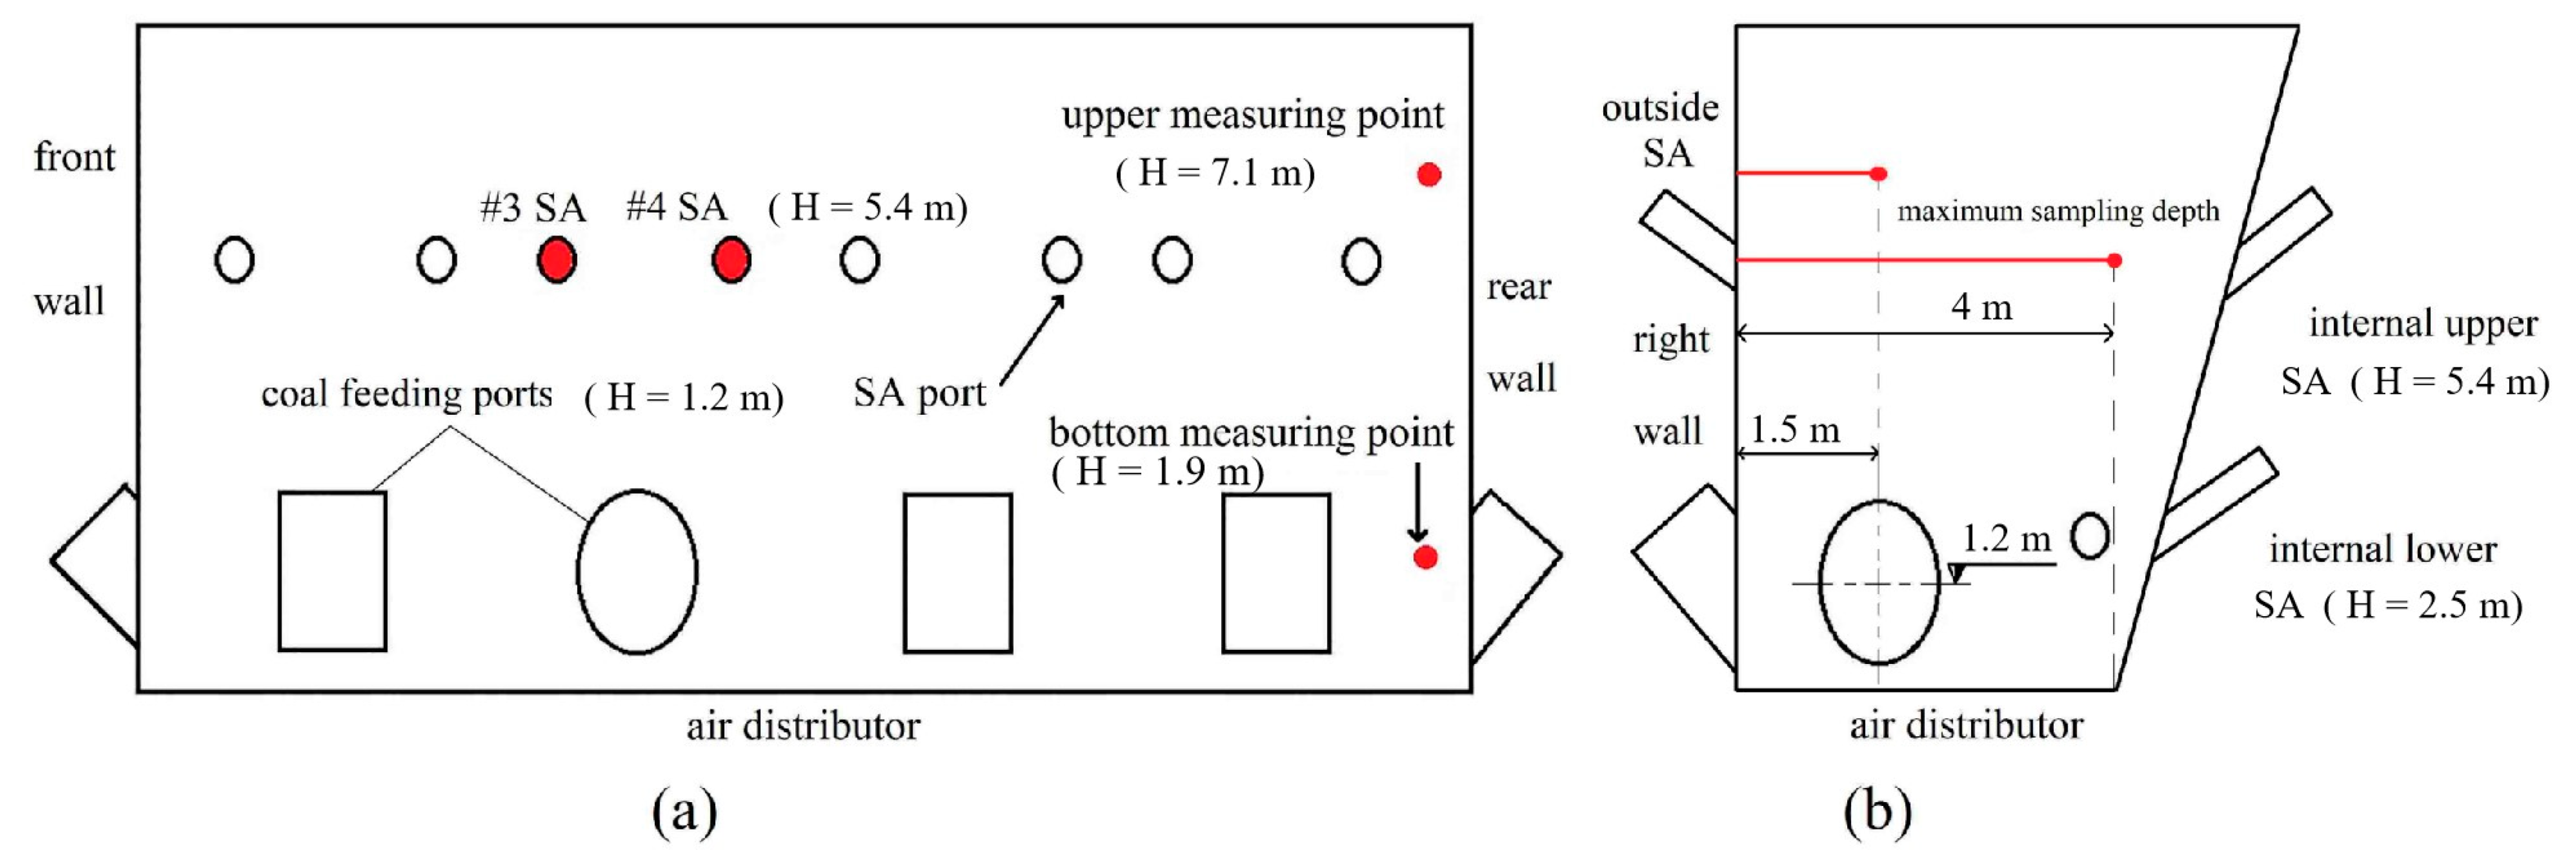
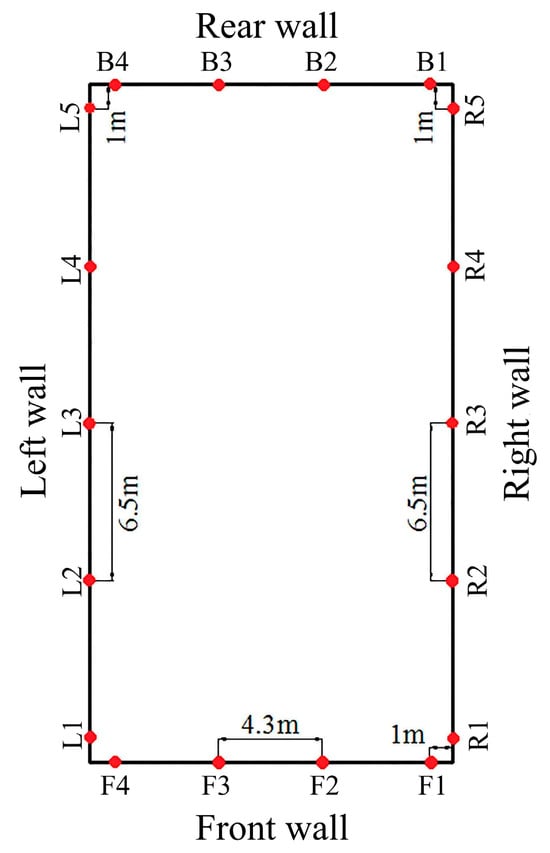
Under the boiler’s thermal operating conditions, flue gas sampling devices were installed on the #3 OUSA and #4 OUSA pipes on both sides of the boiler, and flue gas was extracted point by point along the horizontal axis through the center of the secondary air nozzles for component analysis. Due to the special design of the ash return ports and coal feeding ports for this boiler, four flue gas sampling points were added at the corners on both sides of the boiler’s rear wall. The schematic diagram of the measurement point layout is shown in Figure 12. The lower measurement points and upper measurement points in the corners of the rear wall were composed of sleeves and sealed ball valves, with distances of 1.93 m and 7.5 m from the air distributor plates, approximately 2.1 m from the #8 OUSA, and about 0.5 m from the rear wall. The lateral and longitudinal diffusion characteristics of the secondary air were reflected based on the distribution of oxygen concentration.
Figure 12. Layout of measurement points of secondary air jet characteristics test in 600 MW CFB boiler. (
a) Right wall; (
b) rear wall
[10].
For the measuring points arranged on the secondary air nozzles on both sides of the wall, the maximum sampling depth was 4 m; for the measuring points in the corners of the rear wall, the maximum sampling depth was 1.5 m.
The characteristics of the secondary air injection were measured for the 600 MW supercritical CFB boiler under 60% and 100% BMCR loads.
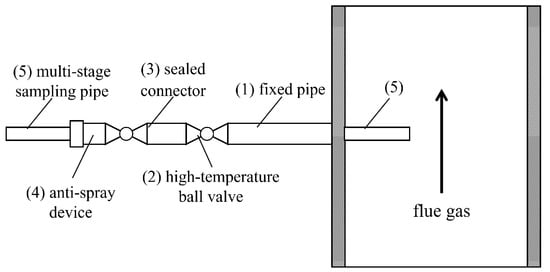
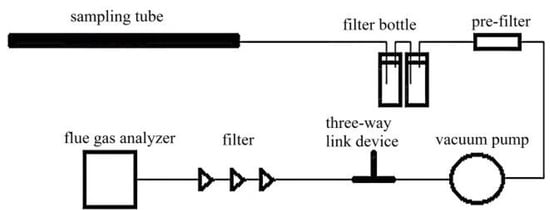
Due to the intense combustion near the height of the secondary air nozzles and the high pressure in the upper part of the dense phase zone of a CFB boiler, where strong gas–solid mixing occurs, the safety and accuracy of the tests were challenging. To address the challenges, a sampling device designed to adapt to the high-temperature positive-pressure dust-containing flue gas inside the furnace (obtained a Chinese invention patent) was employed during the field test process. The schematic diagram of the sampling device is shown in Figure 13. The sampling device included a fixed pipe (1), a high-temperature ball valve (2), a sealed connector (3), an anti-spray device (4), and a multi-stage sampling pipe (5). The fixed pipe was welded to the furnace wall. The sealed connector consisted of a connecting pipe and a sealed ball valve, and the anti-spray device was composed of a connecting pipe and a perforated end cap connected by threads. The sampling pipe was manufactured in multiple sections and connected by threads. The flue gas treatment process is shown in Figure 14, mainly composed of the sampling tube, filter bottle, vacuum pump, and flue gas analyzer.
Figure 13. Schematic diagram of high-temperature positive-pressure dust-containing flue gas sampling device
[10].
Figure 14. Flow chart of flue gas sampling
[10].
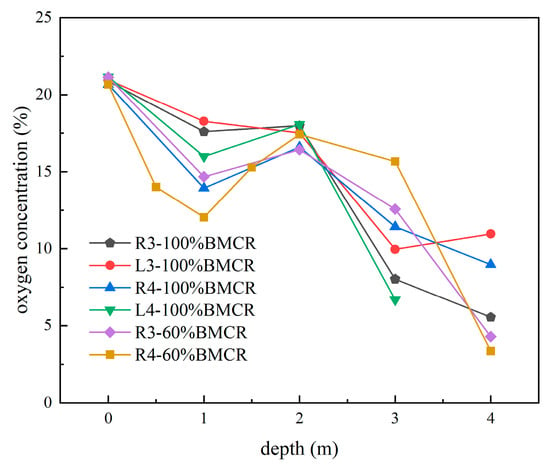
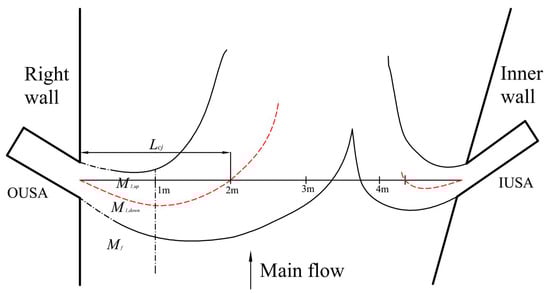
The distribution of oxygen concentration in the flue gas measured during the full-scale tests of secondary air injection is shown in Figure 15. Regardless of the load, the oxygen concentration in the furnace showed a distribution trend of “decrease–increase–decrease.” Since the oxygen concentration along the axis of the secondary air nozzles did not monotonically decrease, it indicated that under the condition of a 30° downward inclination of the secondary air nozzles, the trajectory of the jets must first bend downward and then curl upward, as shown in Figure 16. According to the measurement curves, it can be inferred that the oxygen content decreased in the range of 0–1 m, indicating a downward trend in the jet trajectories, and the measurement points deviated from the jet axis. However, at a distance of 2 m from the furnace wall, the oxygen content in the flue gas reached maximum values, indicating that the central axis of the jets rose again to the measurement points 2 m from the furnace wall. This position was referred to as the core jet depth.
Figure 15. Distributions of oxygen concentration along the horizontal line into the furnace through the #3 and #4 OUSA measurement points on both sides at 100% and 60% BMCR loads
[10].
Figure 16. The schematic diagram of the SA jet trajectories
[10].
From Figure 15, it can be seen that at 60% BMCR load, the oxygen content in the flue gas at a distance of 4 m from the front wall was significantly lower than the oxygen content at 100% BMCR load. This indicated that at low loads, jet trajectories were unlikely to reach the central area of the furnace due to the low secondary air velocities. Conversely, at nearly 100% BMCR load, although the pressures in the furnace at the location of the secondary air nozzles were relatively high (equivalent to the back pressure of the secondary air nozzles), the secondary air jets could still basically reach the central area of the furnace.
From Figure 15, it can also be observed that even under hot conditions, the air velocities of each secondary air nozzle were generally similar. However, under 100% BMCR load, there were still significant differences in oxygen concentrations at the same measurement depth for each secondary air nozzle. This difference was closely related to the unevenness in the coal feeding process and fluidization inside the furnace. Specifically, the varying horizontal distances of different secondary air nozzles from nearby coal feeding ports, along with certain deviations in the coal feeding rates for each coal feeding port, contributed to the differences in oxygen concentration distribution.
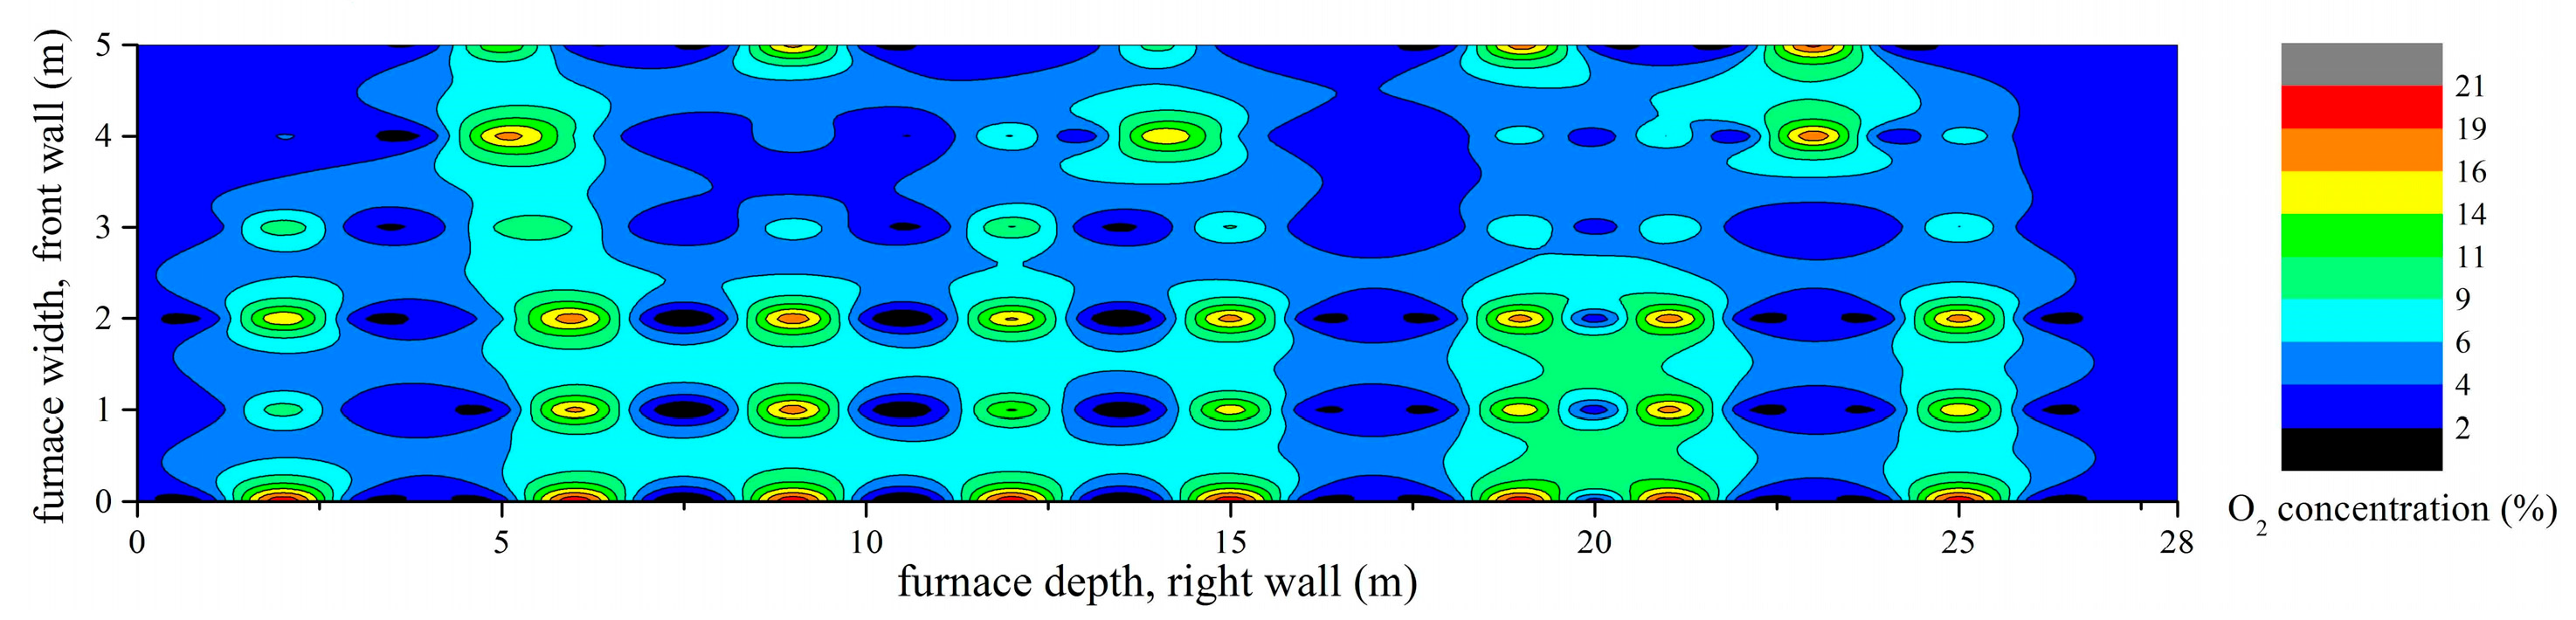
As the boiler underwent optimization for the uniformity of primary and secondary air before the test, it can be assumed that the air distribution in the furnace was uniform. Therefore, it can be considered that the oxygen concentration distribution trends in various regions of each secondary air nozzle were similar. The distribution of oxygen concentration in the furnace was also influenced by coal and return ash. The measurement points in the #3, #4, and rear wall corner were at different distances from the return loop’s return ports and external heat exchanger’s return ports. By comparing the oxygen concentration measurement differences at these three points, the distribution of oxygen concentration in the furnace was adjusted, and the oxygen concentration distribution map of the horizontal plane of the upper secondary air nozzle could be obtained, as shown in Figure 17. From Figure 17, it can be observed that even under 100% BMCR load, there were oxygen-deficient zones between adjacent secondary air nozzles. Additionally, on the horizontal plane of the upper secondary air nozzle, the impact range of the internal and outer secondary air jets did not cover the entire width of the furnace.
Figure 17. Distributions of oxygen concentration in the horizontal plane of 5.5 m above the right air distributor at 100% BMCR load
[10].
3. Spatial Distribution Characteristics of Oxygen Consumption and Combustion Reactions in a Furnace
With the development of large-scale CFB boilers, the cross-sectional area of a furnace has relatively increased, while the effective heating surface area has decreased. To ensure the heat absorption by the working medium, a large number of high-temperature heat exchange platens have been arranged in the dilute phase zone of a furnace in the form of wing wall platens. The heat exchange of the wing wall platen is influenced by the gas-solid flow characteristics and fuel combustion characteristics in the upper part of a furnace.
To assess the uniformity of the mixture of air and coal and the combustion situation in the upper part of a furnace, Liu et al.
[29] conducted field tests of flue gas composition for a 50 MW CFB boiler using a self-made water-cooled sampling tube with a diameter of 32 mm and a length of about 3.7 m. Measurement points were arranged in three layers above the secondary air nozzles at 1.4 m, 10.4 m, and 15 m, respectively. It was found that there was a triangular oxygen-deficient zone in the central area of the furnace, and with the increase in height, the oxygen concentration gradually increased, and the CO concentration gradually decreased.
Yan et al.
[9][30] conducted sampling and measurements of oxygen concentration in the flue gas at near-wall locations in the dilute phase zone and at the inlet and outlet of the cyclone separators in a 600 MW supercritical CFB boiler under 60% and 100% BMCR loads. The furnace of the boiler was approximately 55 m high, and six cyclone separators were symmetrically arranged on the left and right sides of the furnace. The outlets of the separators on one side were arranged in parallel. Sampling points in the dilute phase zone were arranged in two layers: the first layer was located at the coal-feeding machine platform, about 25 m from the air distributor plates. The second layer was located at the upper part of the entrance of superheater platens, about 38 m from the air distributor plates. The sampling points were evenly distributed on each side, as shown in
Figure 18.
Figure 18. Schematic diagram of the sampling points of 25 m/38 m above air distributor plates
[10].
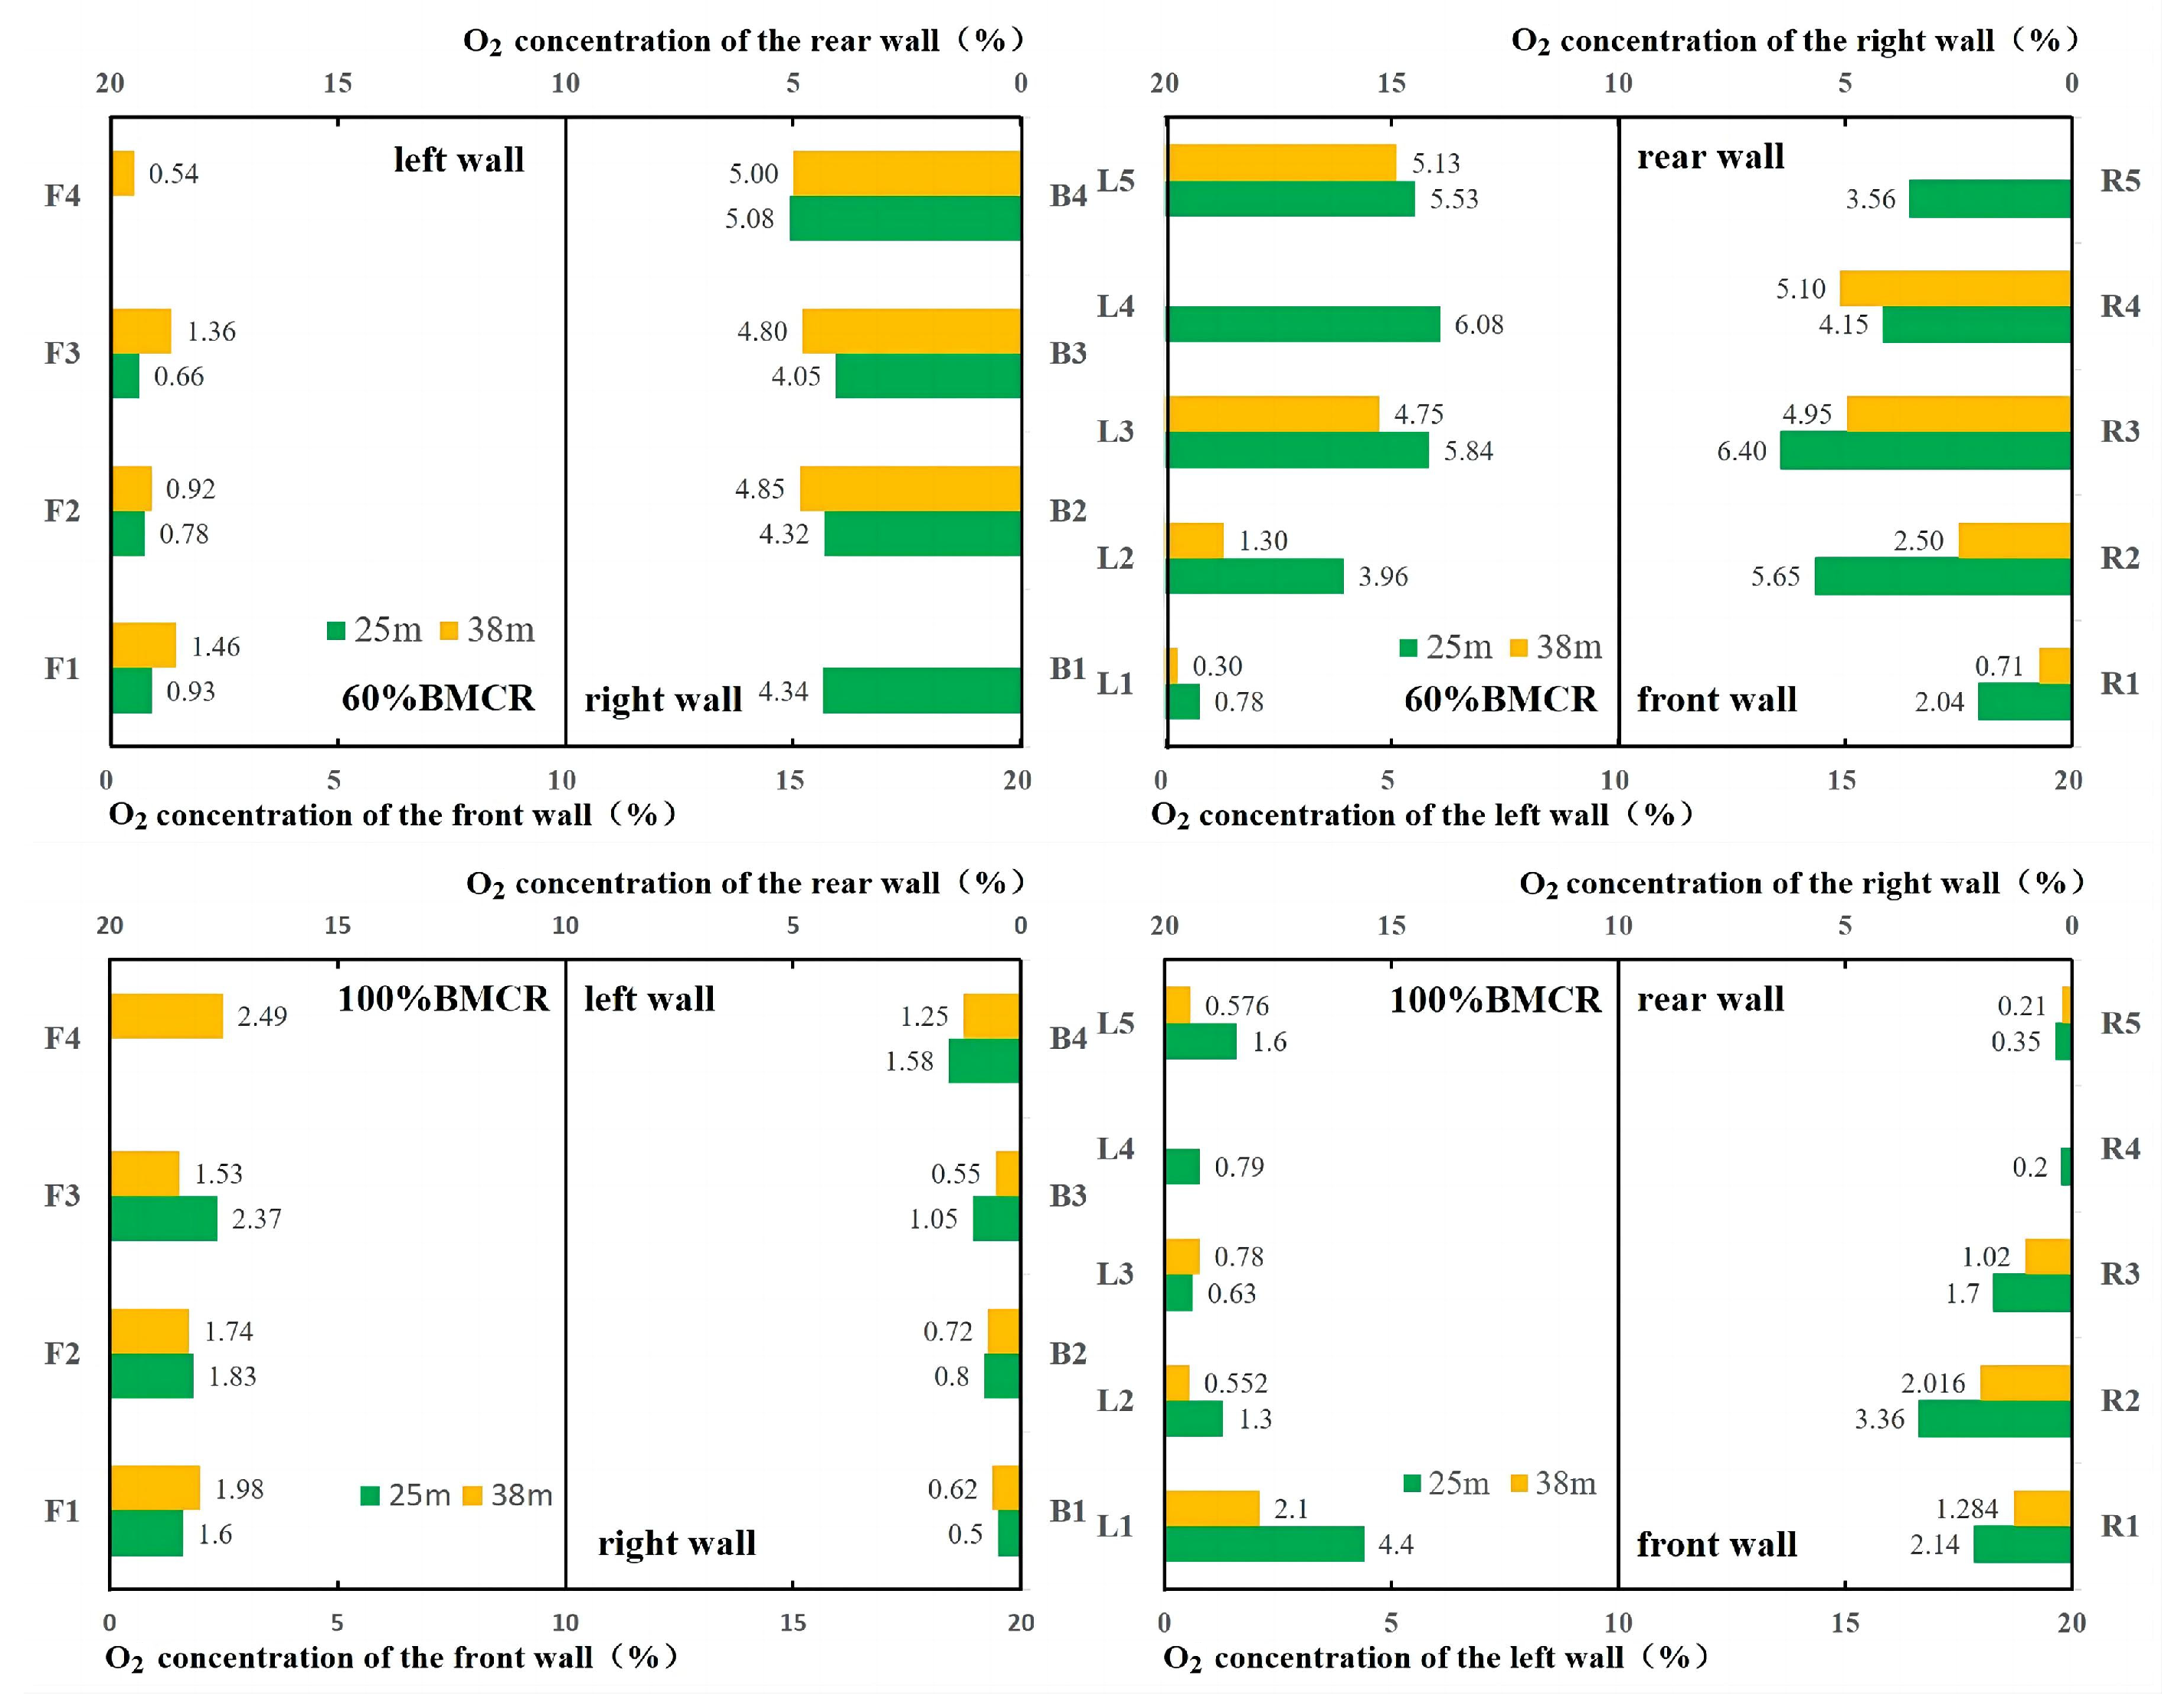
Under 60% and 100% BMCR loads, the oxygen concentration distribution near the furnace wall at heights of 25 m and 38 m from the air distributor plates is shown in Figure 19. Due to blockages, a few points had no measurement data. It can be seen from the figure that the oxygen concentrations at corresponding positions on the left and right walls of the furnace at the same height were similar, while the difference in oxygen concentrations in the same side wall area was large. The uneven distribution of oxygen concentration in the dilute phase zone was mainly reflected in the depth direction of the furnace.
Figure 19. Oxygen distributions 25 m and 38 m above the air distributors of 600 MW CFB boiler at 60% and 100% BMCR loads
[10].
Under 60% BMCR load, the oxygen concentrations at the front wall at 25 m were all less than 1%, indicating an oxygen-deficient atmosphere, while the average oxygen concentration at the rear wall was close to 5%. The reason was that it was crucial to ensure the outlet steam temperature of the final-stage reheater at low loads. The final-stage high-temperature reheaters of this boiler were arranged in external heat exchangers on the front wall side. Therefore, under low-load conditions, it was necessary to add more coal to the front wall side to maintain a higher flue gas temperature at the furnace outlet on the front wall side as much as possible. This was to ensure that the high-temperature circulating ash entering the external bed on the front wall side had sufficient heating capacity. This also indicated that, to ensure a boiler had good internal gas–solid flow, combustion, and heat transfer characteristics during operation, the heating surfaces, coal feeding ports, and ash return ports should be designed as uniformly as possible during boiler design.
As the gas–solid flow rose to 38 m, the oxygen concentrations at the front wall slightly increased, indicating the lateral diffusion of flue gas. However, the average oxygen concentrations at the rear wall did not change significantly. Compared with low load, under 100% BMCR load, the oxygen concentrations at the two layers of measurement points were significantly lower, but the distribution patterns of the front and rear walls were exactly opposite, with the rear wall area showing obvious oxygen deficiency.
As the flue gas ascended from 25 m to 38 m, the combustion intensity (oxygen consumption) varied with the load. At 100% BMCR load, the average decrease in oxygen was 0.530%, while at 60% BMCR load, the average decrease was 0.386%. This indicates that the combustion intensity was higher in the fast fluidized bed state (100% BMCR load) than in the dilute phase pneumatic transport state (60% BMCR load). The reason was that in the fast fluidized bed state, the bed material concentration in the dilute phase zone was higher, and the unburned carbon in the bed material consumed more oxygen. The combustion intensity was also influenced by temperature; at 100% BMCR load, the temperature in the dilute phase zone of the furnace was higher.
4. Field Test Methods for the Distribution of Pollutant Generation in a Furnace
Due to the uneven distribution of primary air, coal feeding, secondary air, and return material in large-scale CFB boilers, the combustion and heat transfer processes within the furnace become uneven. Uneven combustion inside the furnace can cause local deviations in oxygen concentration and temperature from the optimal range for pollutant control, leading to excessive pollutant generation in specific areas. Adjusting boiler operating parameters based on the distribution of flue gas pollutants within the furnace may be the most effective and economical means of emission reduction. Therefore, it is crucial to measure the distribution of pollutants inside large-scale CFB boilers. However, due to the large furnace space in large-scale CFB boilers, it is very difficult to directly measure pollutant concentration distribution inside a furnace.
Hartge et al.
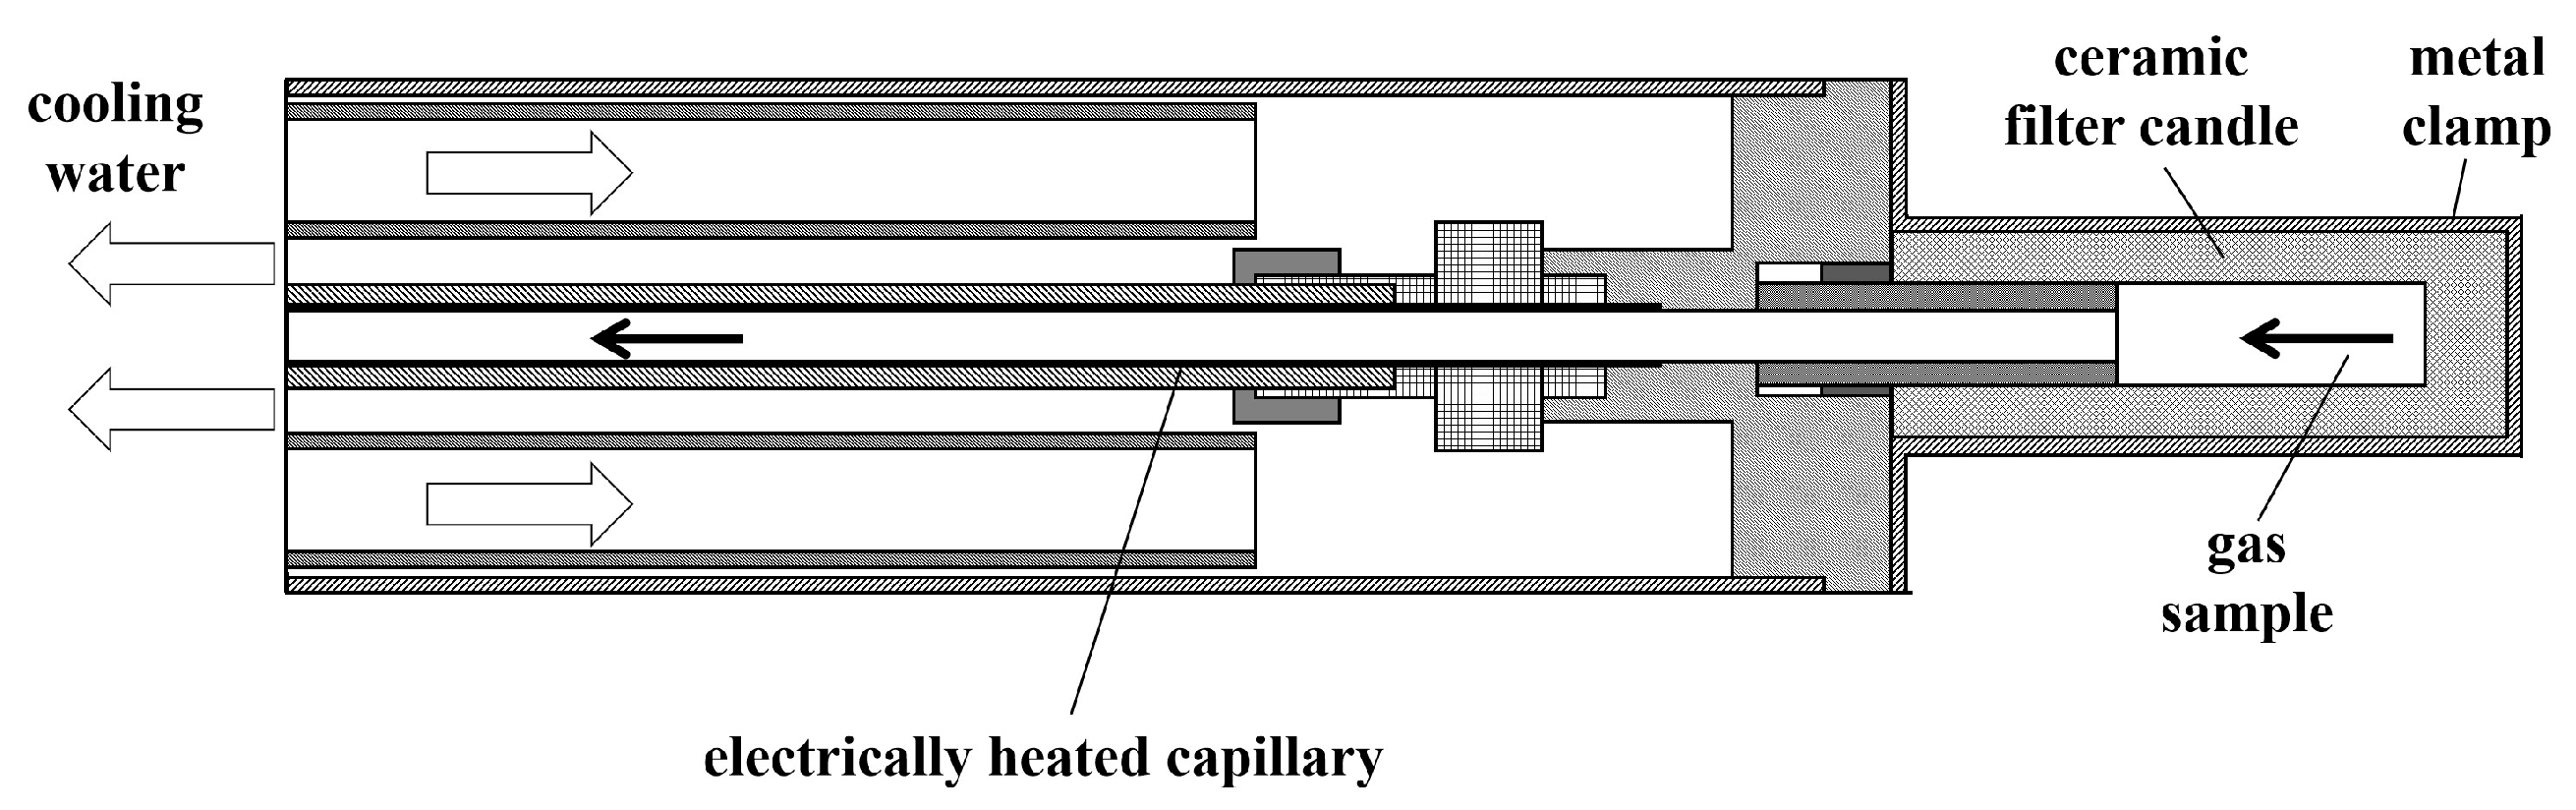
[31] conducted field tests on a 235 MW CFB boiler to measure flue gas composition using a water-cooled flue gas sampling device. The water-cooled flue gas sampling device used in the test is illustrated in
Figure 20. To prevent ash deposition caused by local low temperatures, the flue gas sampling port protrude from the water-cooled sleeve. Additionally, a ceramic filter candle is placed outside the sampling port to filter solid particles in the flue gas, and a metal clamp is used to secure the ceramic filter candle. To prevent distortion in the analysis of flue gas composition due to the flue gas being too cold during sampling, an electric heating layer is added outside the flue gas sampling tube within the water-cooled sleeve. Under the action of the suction pump, the flue gas is filtered after passing through the water-cooled sampling tube and finally enter the flue gas analyzer for real-time measurement.
Figure 20. Schematic diagram of water-cooled flue gas sampling probe
[31].
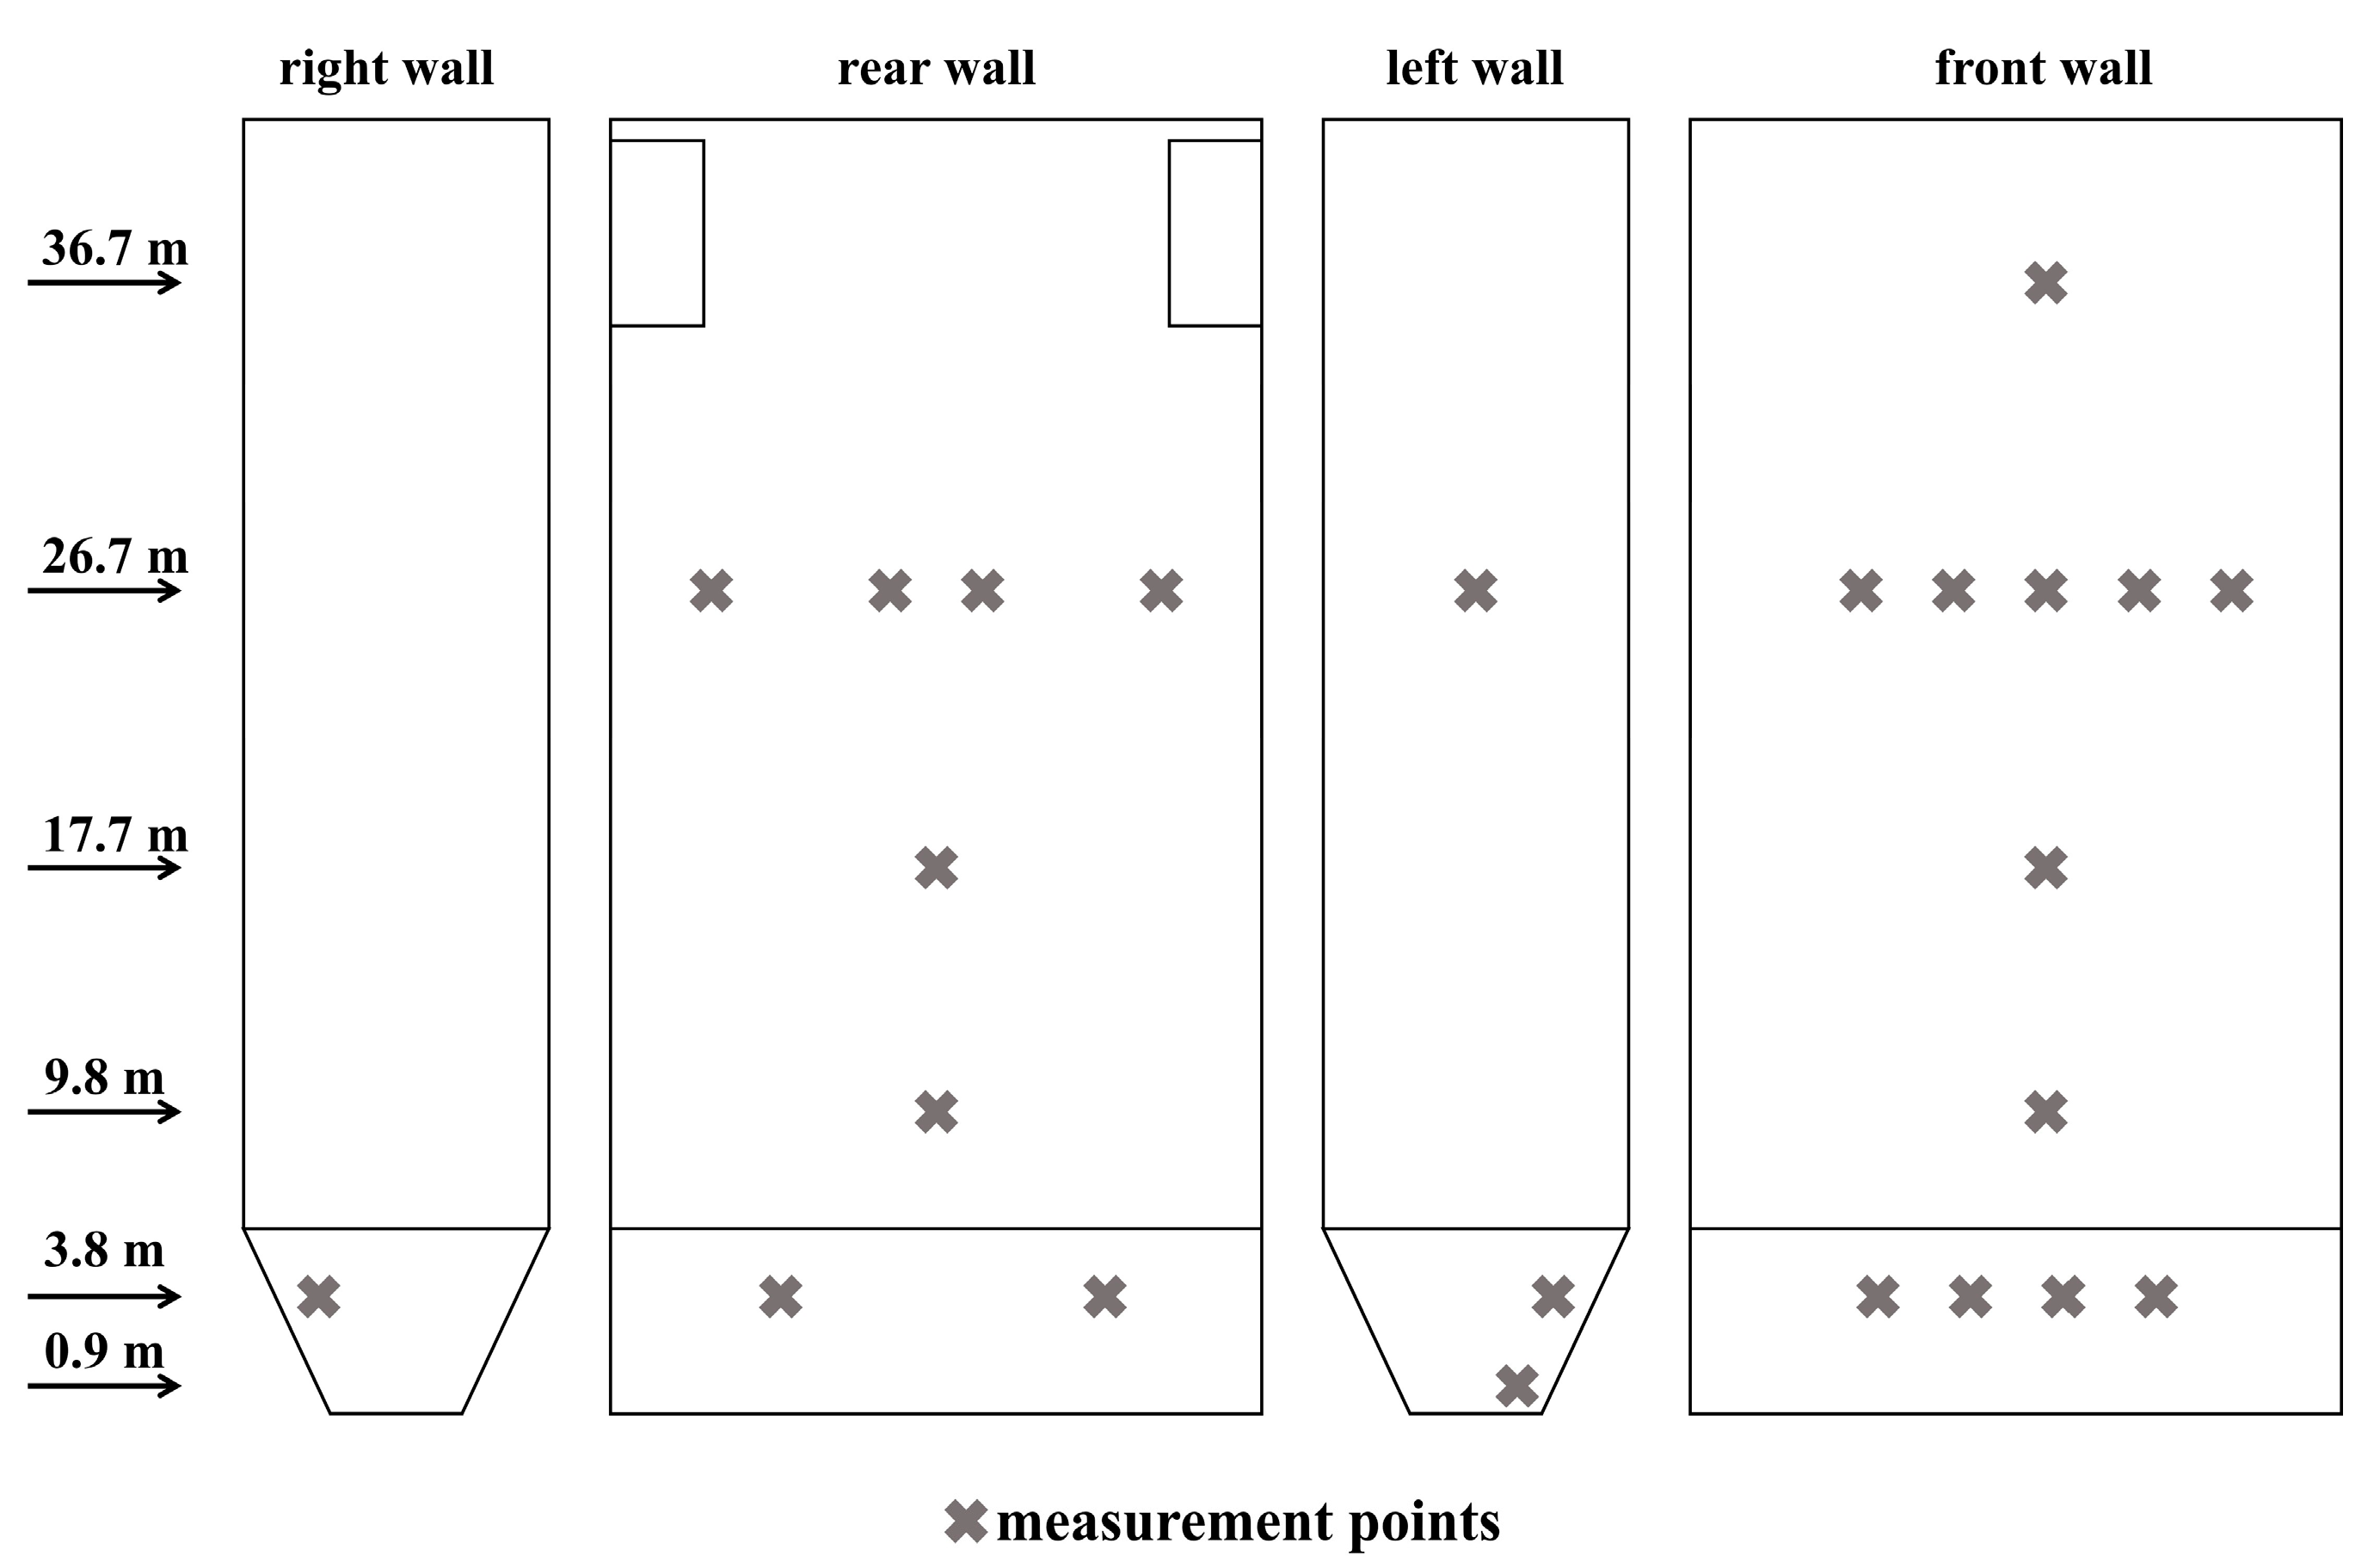
The 235 MW CFB boiler adopts an M-type structure with a furnace height of 42 m, width of 21.1 m, and depth of 9.9 m. It has two separators arranged on the boiler’s rear wall side, with each separator equipped with two return pipes. Coal is supplied through four coal feeding ports evenly distributed at the front wall and four return pipes at the rear wall. In the process of the field tests, a total of 24 flue gas sampling points were arranged in six layers on the water-cooled wall. The distribution schematic of the flue gas sampling points is depicted in Figure 21. Throughout the tests, the boiler was maintained at 100% BMCR load operation.
Figure 21. Schematic diagram of measurement points of the 235 MW CFB boiler
[31].
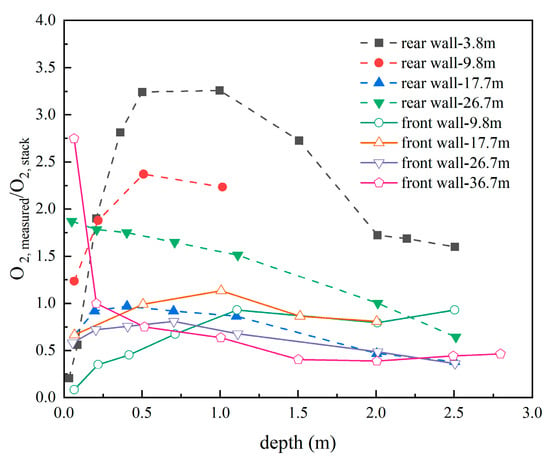
Due to significant differences in the time intervals for flue gas sampling measurements at various points, Hartge normalized the measured flue gas concentrations. This normalization allowed for the comparison of flue gas component concentrations at different points during different operating times. The specific data processing methods were detailed in the original text. Due to space constraints, this research selectively reported data from points near the centerlines of the front and rear walls within the furnace height range of 3.8–36.7 m. The corresponding distribution curves for flue gas components are shown in Figure 22, Figure 23, Figure 24 and Figure 25.
Figure 22. The trend of O
2 concentration with varying measurement depth
[31].
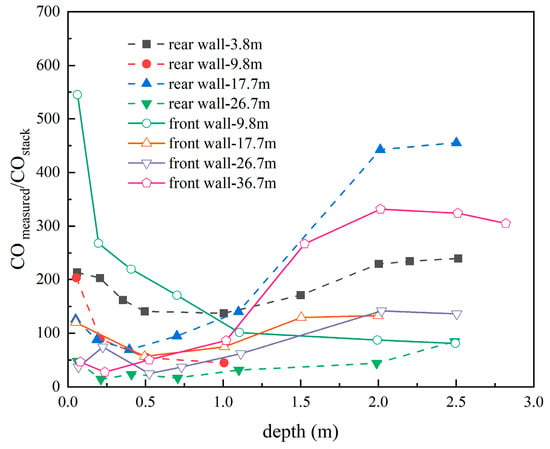
Figure 23. The trend of CO concentration with varying measurement depth
[31].
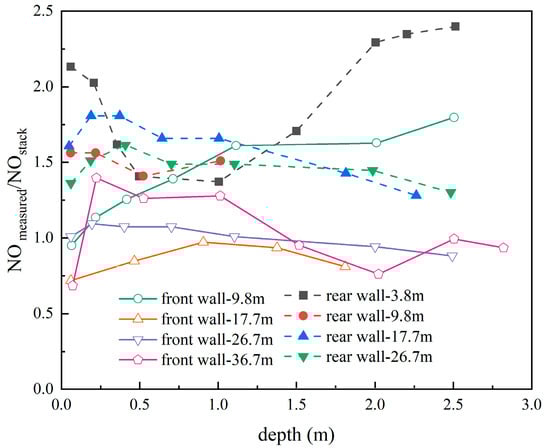
Figure 24. The trend of NO concentration with varying measurement depth
[31].
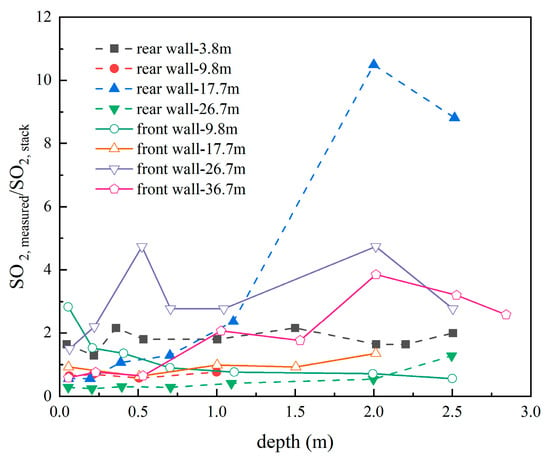
Figure 25. The trend of SO
2 concentration with varying measurement depth
[31].
Figure 22 illustrates the variation trend of oxygen content along the measurement depth at the centerlines of the front and rear walls inside the furnace at different heights. An oxygen-depleted zone of approximately 0.5 m thickness was observed near the water-cooled wall surface. As the measurement depth increased, CO concentration decreased in the 0–0.5 m range, remained relatively stable in the 0.5–1 m range, and then started to rise, as shown in Figure 23. The changing trend in CO concentration confirmed the existence of the oxygen-depleted zone, suggesting the presence of an oxygen-deprived environment even at the center of the furnace.
Simultaneously, it was noticeable that at the same measurement height, the concentrations of O2 and NO in the rear wall region were generally significantly higher than those in the front wall region. Conversely, the concentrations of CO and SO2 in the front wall region were generally higher than those in the rear wall region, as shown in Figure 24 and Figure 25. This suggested that the rear wall region exhibited a stronger oxidizing atmosphere. The uneven distribution of pollutants in the front and rear wall regions was presumed to be related to coal diffusion. In the region near the rear wall of the furnace, coal particles were introduced into the return pipes and, along with circulating ash, entered the furnace. This resulted in stronger coal diffusion near the rear wall, allowing it to be transported to areas closer to the center of the combustion chamber. In contrast, coal particles in the front wall region were fed through coal feeding ports at the front wall, and the coal particles introduced through these ports had relatively weaker diffusion capabilities. As a result, more coal particles tended to be concentrated near the front wall region. This resulted in greater oxygen consumption near the front wall, creating a stronger reducing atmosphere. The reducing atmosphere in the front wall region inhibited the generation of nitrogen oxides, and the lower oxygen content made it more challenging for SO2 to react with limestone. This ultimately led to lower NO concentration and relatively higher SO2 concentration near the front wall.
The results of the field tests on the 235 MW CFB boiler also confirmed the relatively weak lateral diffusion ability of flue gas in industrial-scale CFB boilers. The uneven distribution of pollutants in the dense phase region of the furnace due to uneven coal distribution persisted all the way to the top of the furnace.
Taking advantage of the previously analyzed feature of low lateral mixing intensity in the upper furnace flue gas, the distribution of flue gas components (including pollutant components) inside the furnace can be indirectly inferred by measuring the distribution of flue gas composition along the height of the horizontal section at the inlet of the separators.
Yan et al.
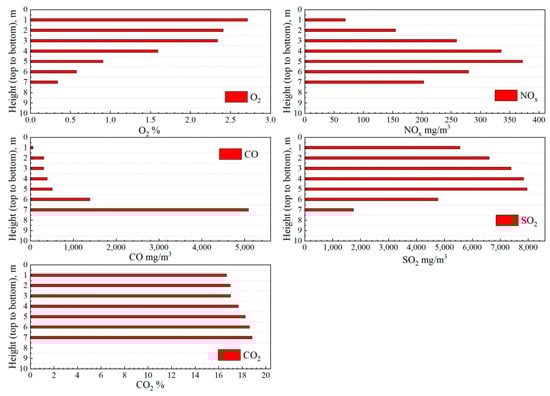
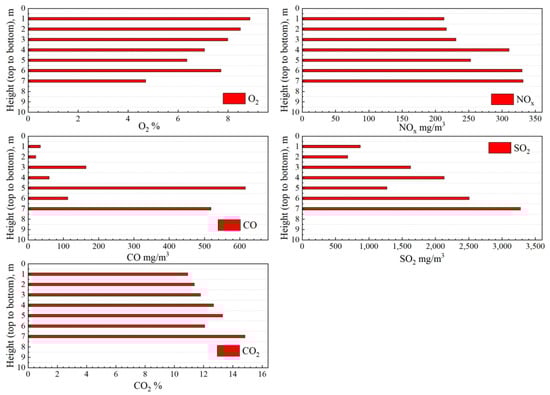
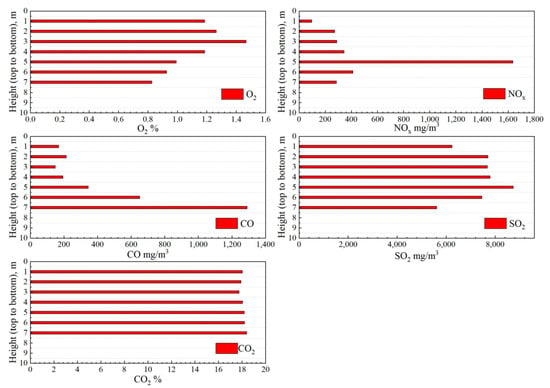
[10][32] conducted field tests of flue gas pollutants components in the dilute phase zone and the horizontal flue of a 300 MW subcritical CFB boiler. The boiler used an “M-shaped” arrangement with a single furnace and a single air distribution plate structure. The furnace was 28.3 m wide, 9.8 m deep, and approximately 40 m high, with three evenly equipped cyclone separators on the rear wall side. The arrangement of flue gas measurement points is shown in
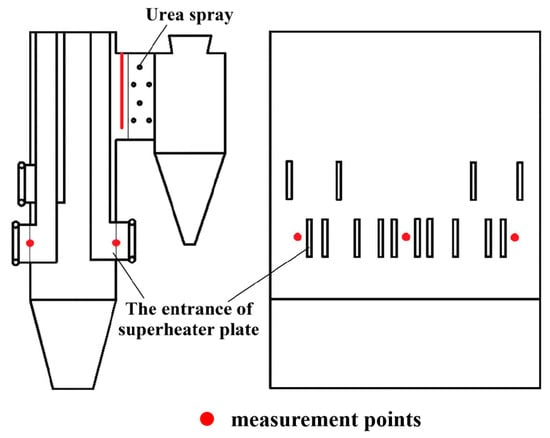
Figure 26, with measurement points located at the entrance of the superheater platens on the front and rear walls of the furnace. The bottom of the superheater plates was approximately 20 m from the air distribution plate. Six measurement points were evenly arranged on both the front and rear walls, and the flue gas sampling devices were similar to the secondary air jet tests, with a maximum sampling depth of 5 m. The points were numbered from the left wall to the right wall as #1–#3, and the furnace was simultaneously divided into three regions. A flue gas sampling point was arranged at the inlet of each separator’s horizontal flue. Due to the height of the horizontal flue reaching approximately 10 m, the sampling tube was suspended from the top into the flue for measurement, with a maximum sampling depth of 8 m. To eliminate the influence of the urea injection nozzles, the measurement points were set in front of the urea injection nozzles. The boiler maintained stable operation at 90% BMCR load during the field tests.
Figure 26. Schematic diagram of measurement points of 300 MW CFB boiler
[10].
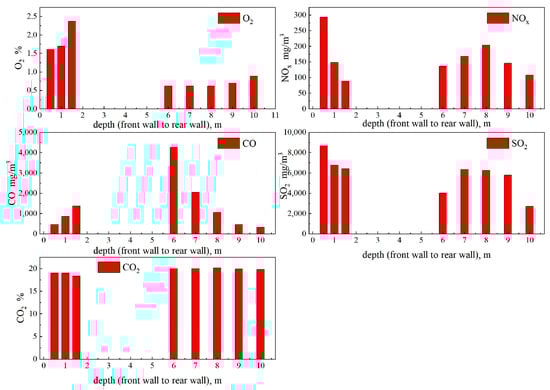
The distribution of flue gas components concentrations in the furnace’s dilute phase zone along the depth direction is shown in Figure 27, Figure 28 and Figure 29.
Figure 27. Summary of flue gas composition in #1 region of dilute phase zone
[10].
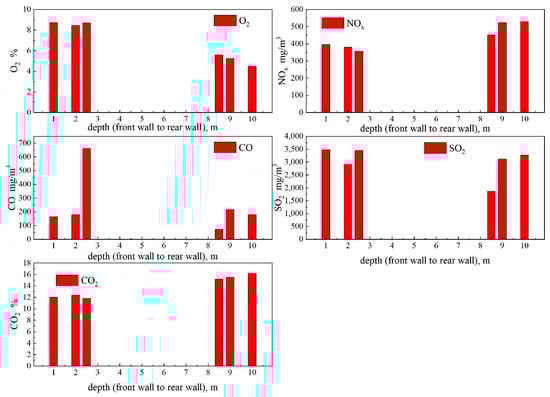
Figure 28. Summary of flue gas composition in #2 region of dilute phase zone
[10].
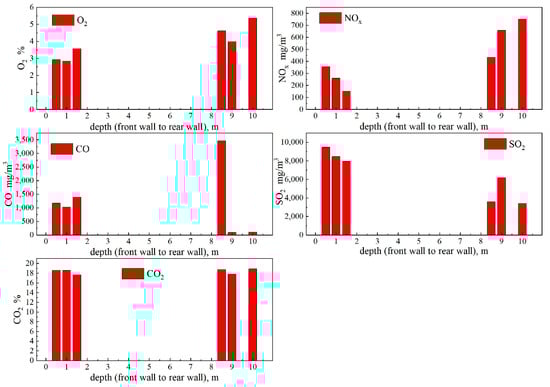
Figure 29. Summary of flue gas composition in #3 region of dilute phase zone
[10].
It can be observed that in the #1 region, the average oxygen concentration within 1.5 m of the front wall was close to 2%, and the oxygen concentration distribution was uniform within 5 m of the rear wall, with an average of about 0.5%, which was approximately 1% lower than the front wall. The NOx concentrations at the front wall gradually decreased, while the NOx concentration distribution at the rear wall was relatively uniform. The high CO concentration in the central area of the furnace, to some extent, inhibited the generation of NOx.
Due to the adoption of wet flue gas desulfurization in the boiler and the absence of limestone injection into the furnace, the distribution of SO2 concentration in the furnace to some extent reflected the coal distribution. Experimental results revealed that the coal distribution in this boiler was not very uniform.
In the #2 region, the average oxygen concentration was significantly higher than in the #1 and #3 regions, and the average SO2 concentration was only half of that in the #1 region, indicating an overall lower coal feeding rate in the #2 region. Additionally, the #2 region had a higher oxygen concentration at the front wall, suggesting a situation where there was less coal distributed on the front wall side and more on the rear wall side.
In the #3 region, the SO2 concentration at the front wall was close to twice that on the rear wall side, indicating a smaller coal feeding air in the #3 region, with more coal gathering in the front wall area. The higher coal concentration at the front wall created a reducing atmosphere on the front wall side, suppressing the generation of NOx on the front wall side.
Combining the cold-state test results of coal distribution characteristics, it can be found that the initial distribution of coal in the dilute phase zone did correspond to the distribution characteristics of flue gas components.
The distribution of flue gas components along the height direction of the horizontal flue at the inlet of the separators is shown in Figure 30, Figure 31 and Figure 32. Due to the location of the furnace outlet flue windows on the rear wall, it can be inferred based on this characteristic that the flue gas at the top of the horizontal flue was mainly affected by the front wall side flue gas, the bottom area was mainly affected by the rear wall side flue gas, and the middle area was affected by the flue gas in the central area of the furnace.
Figure 30. Flue gas composition along height direction of #1 horizontal flue
[10].
Figure 31. Flue gas composition along height direction of #2 horizontal flue
[10].
Figure 32. Flue gas composition along height direction of #3 horizontal flue
[10].
From the measurement data of the #1 horizontal flue, it was observed that the oxygen concentrations decreased linearly from 2.7% at the top to 0.37% downward, aligning with the trend of oxygen concentrations distribution depicted in Figure 27.
The NOx concentrations distribution showed an increasing trend followed by a decreasing trend, and the average NOx concentration was higher than the corresponding NOx concentration in the dilute phase zone, indicating the continuous generation of NOx between the dilute phase zone measurement points and the outlet flue windows.
In the #2 horizontal flue, the highest average oxygen concentration reached 7.32%. The oxygen concentrations showed a decreasing trend from top to bottom, consistent with the distribution in the corresponding dilute phase zone. Due to the relatively large amount of coal feeding in the rear wall area and the relatively sufficient oxygen content in the #2 region, the NOx concentration at the bottom of the horizontal flue was higher.
The results of these tests indicated that the uneven distribution of air distribution and coal feeding in large-scale CFB boilers had a significant impact on the distribution of flue gas pollutants, and this effect persisted at least to the inlet of the horizontal flue of the separators. Therefore, ensuring the uniformity of combustion in the secondary air region was crucial for the safety, economy, and environmental compliance of a boiler operation. By measuring the distribution of flue gas components at the inlet of the separators, the characteristics of flue gas components distribution inside a furnace can be indirectly determined.
5. Field Test Methods for Hydrodynamic Uniformity and Heat Transfer Characteristics in a Large-Scale CFB Boiler Furnace
During the rapid load change process, the variation characteristics of key operating parameters such as hydrodynamics play a crucial role in the safe operation of the units. Especially in supercritical CFB boilers using Benson vertical tube technology, the lower mass flow rate inside the water-cooled wall tubes raised concerns regarding hydrodynamic safety. The hydrodynamic characteristics of CFB boilers are not only related to the arrangement of heating surface structures but also have a direct connection with combustion and heat transfer within the furnace. Therefore, conducting relevant field test research to obtain the actual heat transfer situation inside a large CFB boiler is crucial.
The heat transfer coefficient on the furnace side of a CFB boiler is influenced by factors such as the void fraction inside the furnace, the particle diameter of solid particles, and other related factors. Xu et al.
[33] conducted studies using a cold-state CFB experimental setup with a riser height of 60 m. This experimental setup was installed within the framework of a 600 MW CFB boiler. Laser fiber probes were employed to measure various parameters at 30 measurement points distributed along the height of the riser. These parameters included gas–solid concentration changes, variations in average particle size, and the downward velocity of particle clusters along the wall. Leckner and Andersson
[34][35] conducted experiments on a laboratory-scale CFB reactor, obtaining variations in particle suspension density along the furnace height and obtaining heat transfer coefficients. However, Johansson et al.’s
[36] report also indicated that due to the significant differences in height-to-width ratios between actual boilers and laboratory-scale CFB reactors, empirical correlations obtained from laboratory-scale reactors for predicting solid distribution in the furnace may differ from the actual furnace. Therefore, in large-scale CFB boilers, field tests of solid suspension density and heat flux density were essential. Hartge et al.
[37] used water-cooled probes to conduct field tests of local temperature, solid particle velocity, and solid volume concentration in a 235 MW CFB boiler. They verified the existence of the core-annular flow structure in the gas–solid two-phase flow inside the furnace.
Zhang et al.
[38] designed a momentum probe and a non-isokinetic particle sampling probe for measuring gas–solid flow and solid flow flux in CFB boiler furnaces, and they validated these designs on a 12 MW pilot-scale CFB reactor.
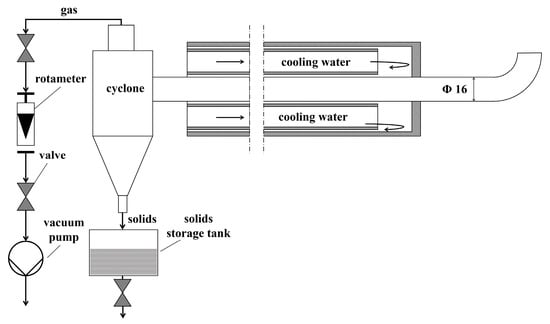
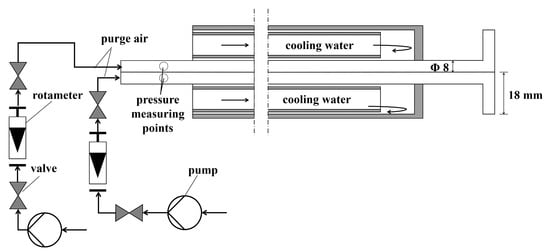
The non-isokinetic particle sampling probe is depicted in Figure 33. The probe has an inner diameter of 16 mm and a total length of 1.5 m. During operation, dust-laden flue gas is drawn into the water-cooled probe by the action of a vacuum pump. Subsequently, solid particles are separated by a cyclone separator and collected in the lower solid storage tank, which is equipped with an ash discharge valve at the bottom. A rotor flowmeter and two adjustable valves are installed between the separator and the vacuum pump to ensure a stable suction rate during the test.
Figure 33. Schematic diagram of non-isokinetic particle sampling probe
[38].
The weight of collected solid particles divided by the sampling time yields the average solid particle flux. The momentum probe is depicted in Figure 34. The momentum probe consists of two parallel tubes with an inner diameter of 8 mm each. The tubes have bent ends at right angles, pointing towards the furnace above and below. At the tail ends of both tubes, purge air is supplied to prevent blockages and improve momentum transfer between the gas and solid phases. Two sets of rotor flowmeters are used to monitor and control the purge air flows for each tube separately. Each tube’s tail end is equipped with a pressure measurement point, and before the test, the pressure difference inside the two tubes needs to be zeroed. During the test, the particle momentum flux is obtained by calculating the pressure difference between the upper and lower tubes.
Figure 34. Schematic diagram of momentum probe
[38].
Johansson et al.
[39], using the mentioned solid momentum probe, conducted field tests with a total of 25 points arranged along the centerline of the front and rear walls and at two cross-sectional heights in a 235 MW CFB boiler, obtaining expressions of the thickness of the solids wall layer. However, as the parameters of CFB boilers increase, the mass flow rate inside the water-cooled wall tubes of supercritical CFB boilers become smaller, resulting in smaller tube diameters and narrower tube spacing. This limitation restricts the in situ application of water-cooled measuring instruments with larger outer diameters.
Mickley and Fairbanks
[40] proposed a particle packet renewal model that was considered to be closer to the measured heat transfer coefficients values inside the furnace and has been widely accepted by most scholars. Subsequent modifications were made to this model
[41][42][43][44][45]. For supercritical CFB boilers, measuring furnace temperatures and solid particle suspension density at different heights in the furnace and calculating the furnace side heat transfer coefficient based on this information was considered a viable solution.
Blaszczuk et al.
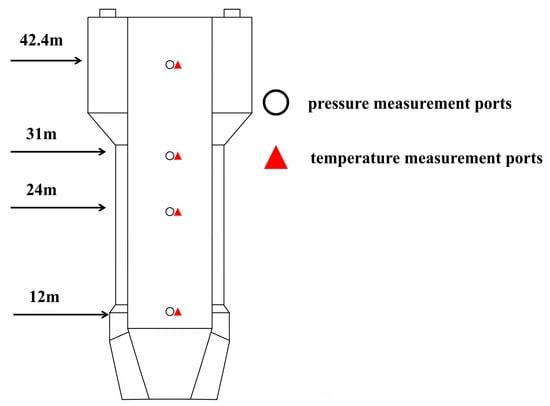
[46][47][48][49] conducted field tests on a 460 MW supercritical CFB boiler and obtained the furnace side heat transfer coefficient for this boiler based on a particle packet renewal model. The 460 MW supercritical CFB boiler featured a modular design with a furnace height of 48 m, width of 10.6 m, and depth of 27.6 m. Four temperature measurement points with pressure measurement points at the centerline of the front wall in the range of 12–42.4 m were arranged. The schematic diagram of the measurement point locations is shown in
Figure 35. Field tests were conducted at boiler loads of 100% BMCR, 80% BMCR, 60% BMCR, and 40% BMCR, respectively.
Figure 35. Schematic diagram of measurement points of 460 MW CFB boiler
[48].
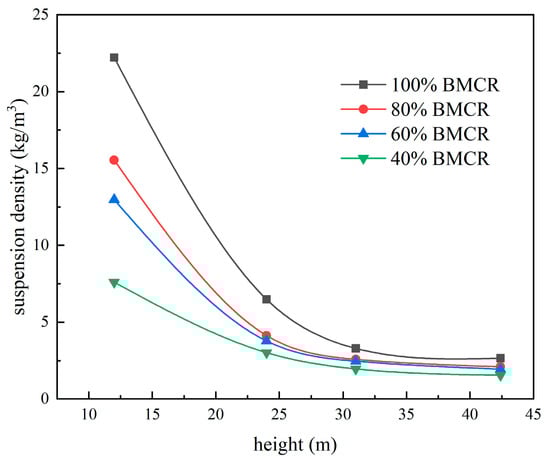
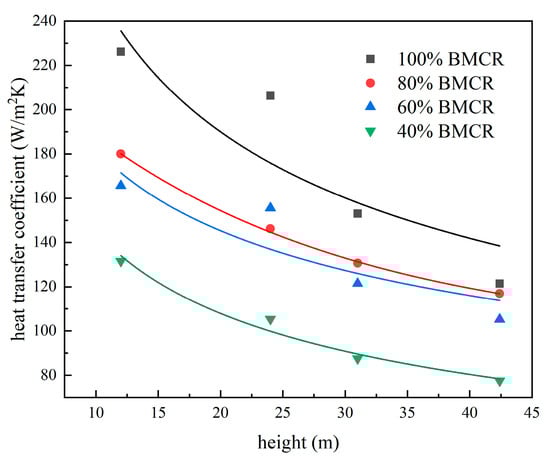
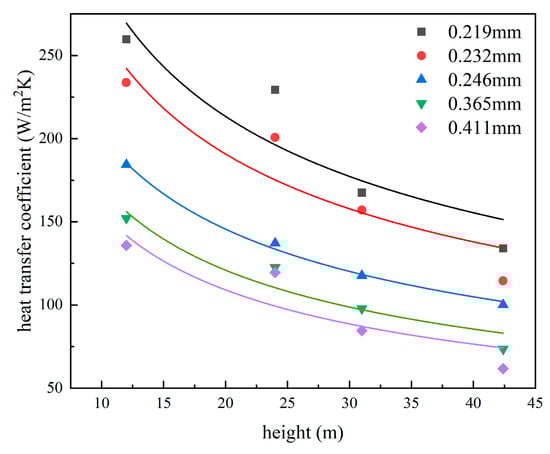
By measuring the furnace pressure differences at different heights, the average suspended solid density at each height in the furnace could be obtained, as shown in Figure 36. It can be observed that, under different loads, the trend of particle suspension density on the furnace side was consistent, decreasing exponentially with an increase in furnace height. This was because, with a decrease in boiler load, the solid particle inventory in the furnace and secondary air flow decreased, leading to a reduction in particle suspension density at the same height. The average heat transfer coefficients at different heights in the furnace under various loads were calculated based on suspended solid density and furnace side temperature, as shown in Figure 37. In the dilute phase region, the furnace side heat transfer coefficient of the boiler varied in the range of 78–228 W/(m2K). With an increase in furnace load, the furnace side heat transfer coefficient also increased. However, there was a slight increase in the heat transfer coefficient when the load increased from 60% BMCR to 80% BMCR. Figure 38 illustrates the furnace side average heat transfer coefficients at different heights in the furnace within the range of the average Sauter particle diameters from 0.219 to 0.411 mm. It was observed that the furnace side heat transfer coefficient was influenced by particle diameters, especially in the range of 0.219–0.246 mm, with smaller particle diameters leading to higher furnace side heat transfer coefficients.
Figure 36. The relationship between particle suspension density and furnace height under different loads in the 460 MW CFB boiler
[48].
Figure 37. The relationship between heat transfer coefficient and furnace height under different loads in the 460 MW CFB boiler
[48].
Figure 38. The relationship between the furnace side heat transfer coefficient and furnace height with varying particle diameters in the 460 MW CFB boiler
[47].
To study the hydrodynamic and heat transfer characteristics of the heating surface inside a 600 MW supercritical CFB boiler furnace, Chen et al.
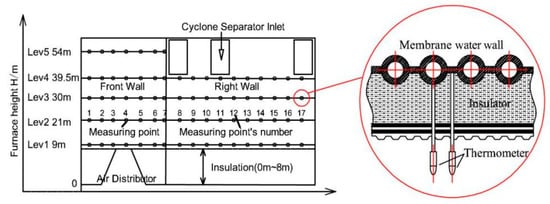
[50][51][52] conducted field tests on a 600 MW supercritical CFB boiler. During the tests, 74 temperature measurement points were divided into five layers and arranged on the backfire side of the water-cooled wall on the front and right walls of the boiler. Each measurement point consisted of two wall temperature thermocouples, installed, respectively, at the top of the backfire side of the water-cooled wall tube and at the midpoint of the fin. By utilizing the temperatures at these two points, the local heat flux density at that measurement point could be calculated. This, in turn, allowed for the determination of the gas–solid concentration distribution near the wall inside the furnace. K-type thermocouples were used for temperature measurements at each measurement point.
Figure 39 illustrates the distribution and installation schematic diagram of temperature measurement points. Wall temperature measurements were conducted for three different load conditions: 100% BMCR, 80% BMCR, and 60% BMCR.
Figure 39. Schematic diagram of the measuring point arrangement and measuring points in detail
[52].
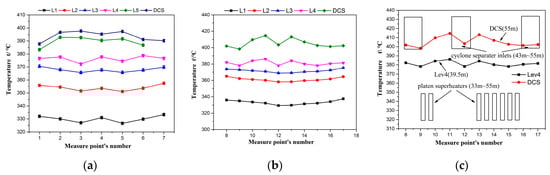
As illustrated in Figure 40, the temperature distribution of steam–water within the water-cooled wall under 100% BMCR load was determined through the measurement of water-cooled wall temperatures and subsequent heat transfer calculations. Figure 40a,b depict the temperatures distribution from the lower to the upper part of the furnace. In the lower part of the furnace, a lower temperature at various measurement points signified a greater water flow inside the tube, whereas a higher temperature indicated a smaller water flow. Conversely, in the upper part of the furnace, a higher temperature suggested increased absorption of steam heat inside the pipe, showcasing the positive flow response characteristics of the water-cooled wall. It is important to note that temperature distribution was also influenced by the arrangement of the furnace wing wall platens and outlet windows, as depicted in Figure 40b,c.
Figure 40. The temperature distribution of steam/water in the water-cooled wall in the 600 MW CFB boiler. (
a) Front wall; (
b) right wall; (
c) upper part of right wall
[52].
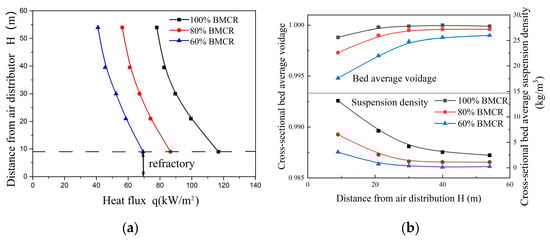
Based on the test results of hydrodynamic characteristics, the average heat flux density and average particle suspension density near the water-cooled wall inside the furnace were calculated for different loads, as shown in Figure 41. It can be observed that under various load conditions, the heat flux density in the upper part of the furnace always decreased along the height of the furnace. The downward trend was basically the same under 60% BMCR, 80% BMCR, and 100% BMCR load conditions. At 100% BMCR load, as the furnace height increased (above 40 m above the air distributor plates), the average particle suspension density near the upper water-cooled wall slightly decreased. However, at loads of 60% BMCR and 80% BMCR, there were slightly noticeable differences in the average particle suspension densities near the upper water-cooled wall.
Figure 41. Distribution of average heat flux and average suspension density in 600 MW CFB boiler. (
a) Heat flux; (
b) bed average voidage and suspension density
[52].
6. Field Test Methods for the Initial Distribution Characteristics of Coal in a Large-Scale CFB Boiler Furnace
During the operation of a CFB boiler, coal particles are typically introduced through coal feeding ports located in the dense phase zone of the boiler or fed through the return loop along with the circulating ash into the furnace. Variations in coal feeding rates among different ports and changes in the coal supply air volume under different loads will significantly impact the initial distribution of coal inside the furnace. The initial distribution of coal will affect the combustion of coal particles inside a furnace and the distribution of generated pollutants. However, current research on coal distribution characteristics was mostly limited to numerical simulations under conditions of uniform coal feeding or experimental studies and numerical simulations focusing on a single coal feeding port
[53][54][55][56][57]. There has been relatively limited research on field tests for large-scale CFB boilers.
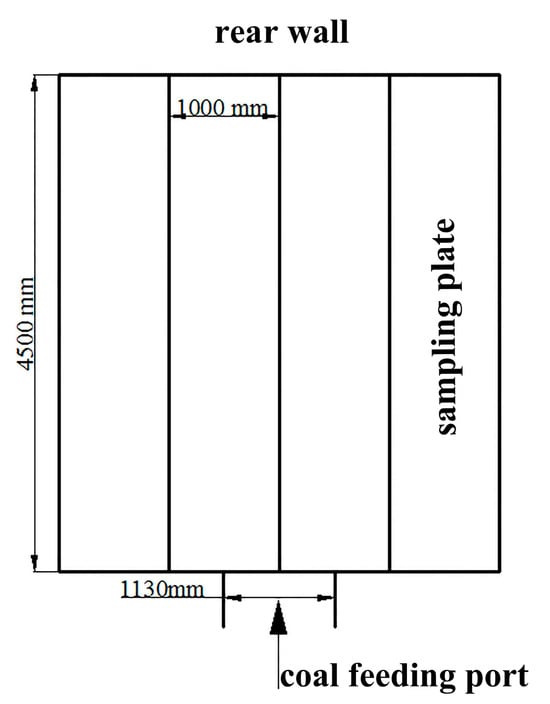
To quantitatively analyze the initial distribution of coal accumulation under cold-state conditions and its influencing factors, Yan et al.
[10][58] conducted field tests on a 300 MW subcritical CFB boiler. The structure of this boiler aligns with the description. The boiler was equipped with eight coal feeding ports, all arranged on the front wall, and coal was transported to the furnace by the coal supply air. The tests were conducted on selected coal feeding ports, specifically #1, #5, and #7. During the tests, a sampling plate was symmetrically laid on the top of the air caps in the region directly opposite the coal feeding ports. The overall width of the sampling plate was approximately 4 m, and its length was equal to the width of the air distribution plate, as shown in
Figure 42. The test procedure involved feeding coal for 1 min at the normal coal feeding rate, followed by shutting off the coal feeder. Subsequently, the sampling plate was subdivided into 40 grids, with each grid measuring 500 mm × 1000 mm. The coal samples within each grid were collected, bagged, labeled, and weighed for records.
Figure 42. Schematic diagram of the sampling plates of the coal feeding distribution test system
[10].
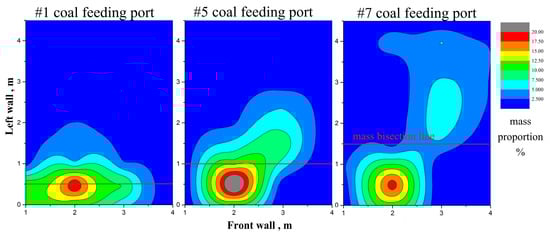
Distribution contour maps of coal mass for different operating conditions for each coal feeding port are shown in Figure 43 and Figure 44.
Figure 43. Contours of coal distribution of each coal feeding port under start-up condition
[10].
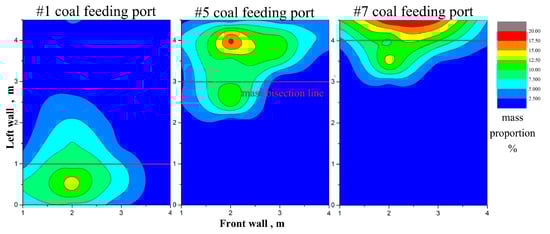
Figure 44. Contours of coal distribution of each coal feeding port under 100% BMCR condition
[10].
Under the startup conditions (the coal feeding rate and the coal injection air volume were essentially the same during the ignition), coal accumulations were observed in the inlet regions of each coal feeding port, with a shortage of coal distribution on the rear wall side. This observation provided an explanation for the coking phenomenon during the ignition and startup of the boiler.
Coal particles tended to accumulate mainly within a region within 1 m from the coal feeding ports. The location with the highest concentration was the same for all three ports, and it exhibited a monotonically decreasing concentration trend towards the surrounding areas.
Coal feeding port #7, with a coal supply air volume 35% higher than the other coal feeding ports, resulted in more coal particles being scattered to a greater distance. The unevenness in coal distribution along the width of the jet for each coal feeding port was attributed to the fact that the coal supply air did not enter the furnace vertically.
Under full load conditions, the differences in coal distribution among the three coal feeding ports were observed, stemming from variations in coal feeding rates and coal supply air volume. The coal distribution trend for coal feeding port #1 was similar to that during startup conditions, but with a smaller concentration gradient, resulting in a more uniform overall distribution.
However, for coal feeding ports #5 and #7, most of the coal was concentrated within 2 m from the rear wall, and the front wall area was only thinly covered with a layer of fine particles. This was attributed to the settling of coal particles in the air after the fan was shut down.
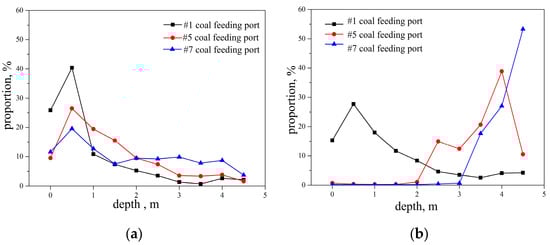
The mass of coal from each coal feeding port was summed in the same width direction to obtain the average coal distribution along the feeding direction, as shown in Figure 45.
Figure 45. Coal distributions along furnace depth. (
a) Startup condition; (
b) 100% BMCR condition
[10].
Under startup conditions, the coal concentrations were highest at a depth of 0.5 m along the furnace depth direction, quickly decreasing and exhibiting a relatively uniform distribution trend beyond 2 m from the front wall. Under full-load conditions, the coal from port #1 within 1 m from the front wall exceeded 60% of the total coal mass, with a smaller concentration gradient compared to the corresponding startup conditions. Coal feeding ports #5 and #7 accumulated over 70% and 97% of the coal mass in the rear wall region, while the coal feeding in the front wall region was almost zero.
This test provided a visual understanding of the initial distribution of coal entering the furnace, helping to identify the reasons for uneven coal feeding and take measures to address the issue. In the actual operation of boilers, the influence of fluidizing air may introduce deviations in the actual coal distribution compared to the results obtained from the cold-state field tests mentioned above.
7. Field Test and Analysis Methods for the Thermal Diffusion Characteristics of Coal in a Large-Scale CFB Boiler Furnace
As the cross-section of large-scale CFB boilers continues to increase, the issue of uneven coal distribution becomes more severe. Therefore, researching the initial distribution and lateral diffusion characteristics of coal during thermal operation is essential. Currently, studies on the particle diffusion characteristics in the dense phase zone of fluidized beds mainly involve cold-state model experiments using tracer methods and numerical simulations
[55][59]. These studies have investigated the impact of parameters such as static bed height, primary air velocity, and particle diameter on diffusion coefficients
[60][61][62]. These studies have also obtained the range of values for particle lateral diffusion coefficients
[63][64] and summarized empirical correlations for particle lateral diffusion in the dense phase zone
[62]. However, Liu et al.’s research
[65] suggested that at an industrial-scale bed width (12.8 m), the value of particle lateral diffusion was expected to be around 0.1 m
2/s, significantly higher than what was observed in laboratory-scale fluidized beds.
Li et al.
[66] studied coal distribution in a 300 MW CFB boiler, using bed temperature distribution uniformity as a criterion for coal distribution adjustment. They also compared the impact of coal feed adjustment under different loads and found that as the boiler load increased, the dependence of bed temperature changes on coal distribution weakened.
Yang et al.
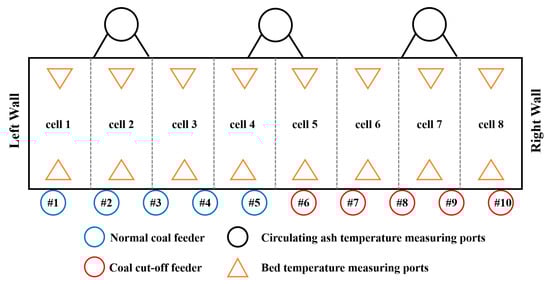
[67][68] characterized the diffusion characteristics of coal particles in the dense phase zone of a large-scale CFB boiler by adjusting the coal feeding rates of various ports and simultaneously recording the bed temperature distribution. The field tests were conducted during the operation of a 350 MW supercritical CFB boiler. The structure of this supercritical CFB boiler furnace is similar to the 300 MW subcritical CFB boiler mentioned earlier, but the furnace height exceeds 52 m. The 350 MW supercritical CFB boiler is equipped with 10 coal feeding ports on the front wall. During the experimental process, one or more coal feeding ports were intentionally cut off. Using the entering coal from the operational coal feeding ports as a tracer, a diffusion model for particles was established based on the bed temperature and ash temperature distribution in the dense phase zone before and after the coal shutdown. This enabled the determination of the diffusion coefficient of coal particles in the thermal state of the boiler.
In the dense phase zone of large-scale CFB boilers, the Fickian diffusion equation can be used to fit the transient particle concentration distribution to describe particle diffusion behavior. Since the mixing and diffusion speed of particles in the vertical direction in a fluidized bed were much higher than the lateral diffusion speed
[69][70][71], it can be assumed that there was no diffusion gradient along the vertical direction in the dense phase zone of the fluidized bed. Additionally, the width direction size of the dense phase zone in large-scale CFB boilers is much larger than the depth direction size. Under ideal conditions, it can be assumed that the distribution of coal particles in the width direction of the furnace was uniform. Based on this, the dense phase zone of the 350 MW CFB boiler was divided into eight equally sized units along the width direction of the furnace, as shown in
Figure 46.
Figure 46. Dense phase zone division of the 350 MW CFB boiler
[68].
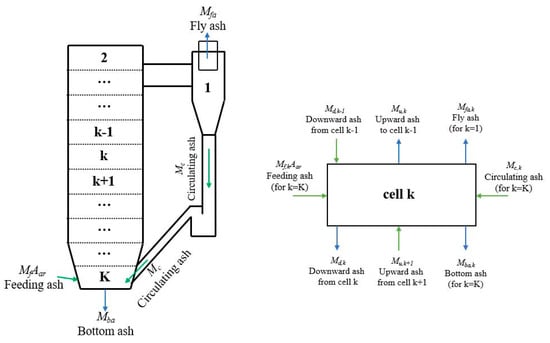
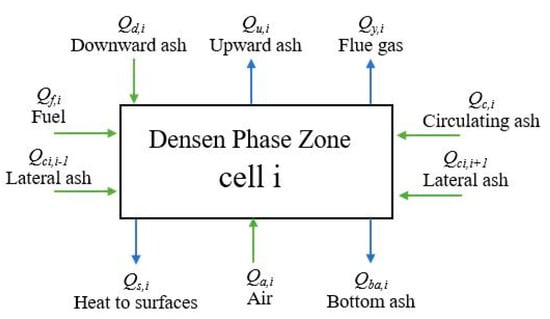
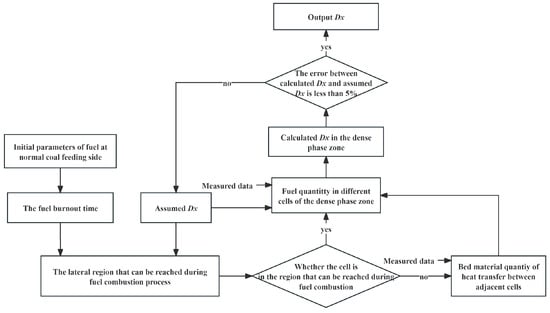
Since the temperature distribution in the dense phase zone of CFB boilers is also influenced by factors such as fluidizing air and circulating ash. Therefore, to obtain the concentration of coal particles in different regions of the dense phase zone based on the bed temperatures distribution, it is necessary to know the amount of circulating ash in different regions. In the calculation process, a cell model was used to construct the mass balance of the dense phase zone of the boiler, thereby obtaining the amount of circulating ash, as shown in Figure 47. Based on this, a thermal balance system was established within each unit of the dense phase zone, as shown in Figure 48. The specific calculation process of the diffusion coefficient in the dense phase zone is shown in Figure 49. Three different coal feeding shutdown conditions were tested during the experiment, and the corresponding coal particles lateral diffusion coefficients were obtained.
Figure 47. Illustration of boiler cell structure and ash flow into and out of cell k(DPZ)
[68].
Figure 48. Heat balance system in cell i of the dense phase zone
[68].
Figure 49. Specific calculation process of diffusion coefficients in the dense phase zone
[68].
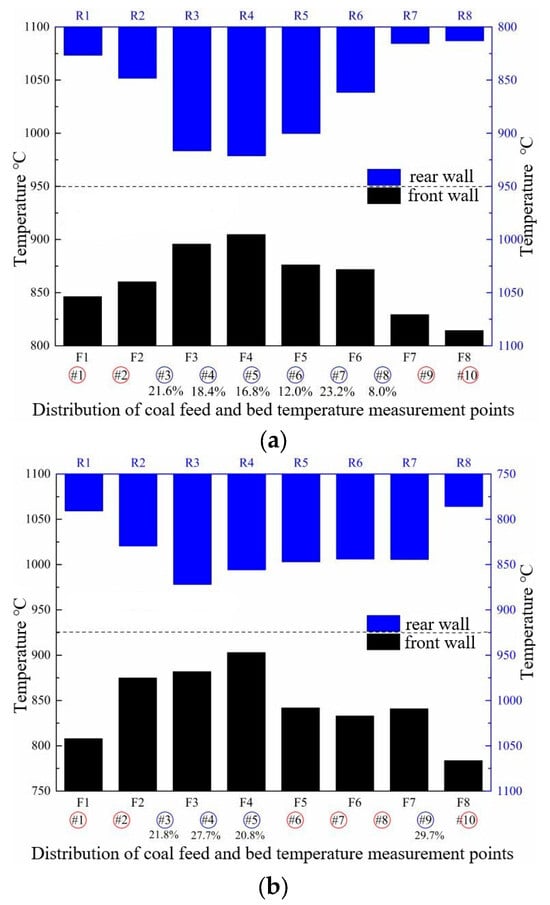
Figure 50 shows the bed temperature distribution under different coal cut-off conditions in the 350 MW CFB boiler, where the coal cut-off ports are indicated in red.
Figure 50. Bed temperature distribution under coal cut-off of 350 MW CFB boiler. (
a) Condition 1; (
b) condition 2; (
c) condition 3
[68].
Combining the three test conditions, it can be observed that the temperature distribution in the dense phase zone was closely related to the diffusion of coal particles and the number and location of operational and cut-off coal feeding ports.
Regions with higher temperatures were generally near the operational coal feeding ports, while the bed temperature near the coal cut-off ports was mainly maintained by the combustion of diffused coal, resulting in lower temperatures.
This indicated that the bed temperature distribution in the coal cut-off region was closely related to the mixing and diffusion characteristics of coal particles in the dense phase zone. Moreover, coal feed had a significant impact on bed temperature distribution in the furnace, surpassing the influence of coal particles diffusion inside the furnace. Therefore, improving coal feeding uniformity was a useful measure to ensure uniform combustion in the furnace.
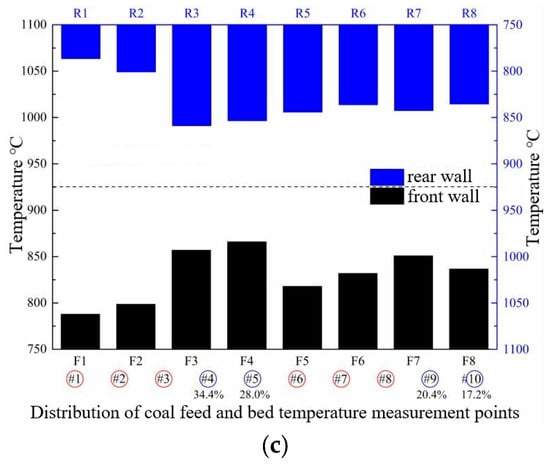
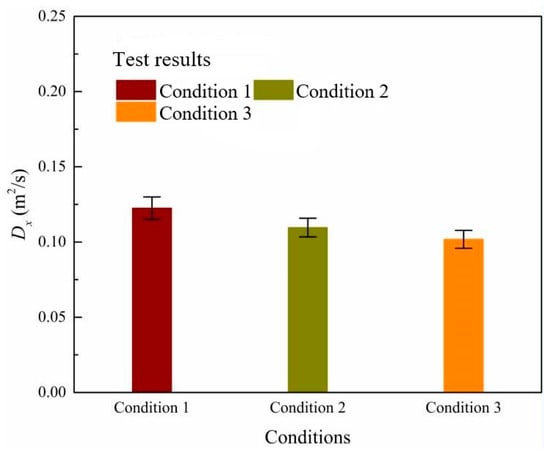
Figure 51 provides the lateral diffusion coefficient distribution of coal particles in the dense phase zone under three coal cut-off conditions in the 350 MW CFB boiler. The calculated values of the lateral diffusion coefficient fall within the range of 0.0936–0.1302 m2/s. Since this method was based on the parameter changes during coal cut-off operation to obtain the particles diffusion characteristics, the magnitude of the diffusion coefficient was related to the fuel and circulating ash amounts, as well as the fluidization airflow. It was also influenced by factors such as the surface area of coal particles and oxygen distribution.
Figure 51. Distribution of diffusion coefficients in 350 MW CFB boiler under three coal cut-off conditions
[68].
8. Engineering Research on Anti-Wear Technology for a Large-Scale CFB Boiler
In large CFB boilers, the gas–solid flow is intense and complex. The wear issue on the heating surface arises during the direct collision and cutting of solid particles with the heating surface (two-body wear) or the interaction between solid particles pressed and collided by particle clusters and the heating surface (three-body wear)
[72][73]. The material wear is primarily influenced by factors such as flue gas velocity, solid particle size, and solid particle concentration. Wear phenomena often occur at locations where the flow direction of solid particles undergoes sudden changes, such as the interface between water-cooled walls and refractory materials, protruding parts of heating surfaces, welds on water-cooled walls, and corners of the furnace
[74]. The issue of wear and tear can lead to tube bursting on the heating surface during operation, causing unplanned shutdowns and seriously affecting the safe and stable operation of CFB boiler units. In order to address the problem of wear and tear on the heating surface, a large number of anti-wear technologies have been proposed and successfully applied in the field
[75].
Some small-scale CFB boilers have chosen to use anti-wear tiles installed outside the heating surface. However, this method increases the thermal resistance of the heating surface and exacerbates wear on the upper part of the heating surface in the anti-wear tile installation area, limiting its application in large CFB boilers
[72][73]. Similarly, Maryamchik and Wietzke
[76] reported a design that reduces the tube diameter in the interface area between refractory materials and water-cooled walls. A ceramic wear-resistant tile was applied outside the small-diameter tube to enhance the wear resistance.
Laser cladding technology is also one of the effective methods to address the wear issues inside CFB boilers. High-strength anti-wear alloy materials are melted onto the metal surface of the heating surface under the action of laser, enhancing the wear resistance of the heating surface and extending its lifespan
[72][73]. However, this method currently faces challenges such as high costs and inconvenient on-site construction
[77].
High-strength alloy thermal spraying is one of the commonly used methods for addressing wear issues on the heating surfaces of large CFB boilers. The selected alloy is heated to a molten state through gas or arc heating, then atomized by high-pressure air and sprayed onto the heating surface to form a 0.3–0.8 mm metal coating, enhancing wear resistance
[77]. However, in this method, the adhesion between the coating and the heating surface is mainly mechanical, leading to easy delamination and a relatively short lifespan
[78][79].
Anti-wear beams or metal grates are widely used measures for preventing wear in CFB boilers. They work by reducing particle velocity to minimize wear
[79][80]. However, practical experience in the field has shown that adopting this method can lead to increased wear on the upper part of the anti-wear beam, reduced heat absorption on the heating surface, and a decrease in boiler output
[81]. Therefore, before on-site implementation, it is necessary to conduct research on the shape and installation method of the anti-wear beam.
Due to the multifaceted factors influencing the wear issue, the current approach often involves measuring the wear thickness of the heating surface during boiler shutdowns and overhauls to assess the anti-wear capability
[82]. Conducting relevant field tests during the operation of CFB boilers is challenging, thus, cold-state experiments and simulated calculations are commonly employed for research
[83][84][85][86].
Wang et al.
[87] developed a calculation model for the heat transfer process inside a 300 MW CFB boiler equipped with anti-wear beams. Using a heat flux meter, they measured the heat flux density in the anti-wear beam installation area during the boiler operation. By comparing experimental results with computational outcomes, they validated the accuracy of the computational model.
Li et al.
[88] conducted numerical simulations and cold-state experiments to compare the anti-wear effectiveness of different shapes of anti-wear beams. They tested the preferred anti-wear beam structure in a 330 MW CFB boiler for a half year, confirming its excellent anti-wear performance.
Xia et al.
[89] developed a wear calculation model for water-cooled wall surfaces based on computational results of gas–solid flow in 330 MW and 600 MW boilers. Using this model, they successfully predicted changes in the wear rate of water-cooled walls after the installation of anti-wear beams and proposed optimization and improvement suggestions for the installation of anti-wear beams.
 +1 credit