Your browser does not fully support modern features. Please upgrade for a smoother experience.
Submitted Successfully!
 +1 credit
Thank you for your contribution! You can also upload a video entry or images related to this topic.
For video creation, please contact our Academic Video Service.
| Version | Summary | Created by | Modification | Content Size | Created at | Operation |
|---|---|---|---|---|---|---|
| 1 | Walker Jackson | -- | 4145 | 2024-02-22 10:21:53 | | | |
| 2 | Peter Tang | + 2 word(s) | 4147 | 2024-02-23 03:15:19 | | |
Video Upload Options
We provide professional Academic Video Service to translate complex research into visually appealing presentations. Would you like to try it?
Cite
If you have any further questions, please contact Encyclopedia Editorial Office.
Jackson, W.S.; Bauer, S.; Kaczmarczyk, L.; Magadi, S.S. Selective Vulnerability to Neurodegenerative Disease. Encyclopedia. Available online: https://encyclopedia.pub/entry/55341 (accessed on 27 June 2026).
Jackson WS, Bauer S, Kaczmarczyk L, Magadi SS. Selective Vulnerability to Neurodegenerative Disease. Encyclopedia. Available at: https://encyclopedia.pub/entry/55341. Accessed June 27, 2026.
Jackson, Walker S., Susanne Bauer, Lech Kaczmarczyk, Srivathsa S. Magadi. "Selective Vulnerability to Neurodegenerative Disease" Encyclopedia, https://encyclopedia.pub/entry/55341 (accessed June 27, 2026).
Jackson, W.S., Bauer, S., Kaczmarczyk, L., & Magadi, S.S. (2024, February 22). Selective Vulnerability to Neurodegenerative Disease. In Encyclopedia. https://encyclopedia.pub/entry/55341
Jackson, Walker S., et al. "Selective Vulnerability to Neurodegenerative Disease." Encyclopedia. Web. 22 February, 2024.
Copy Citation
Neurodegenerative diseases (NDs) manifest a wide variety of clinical symptoms depending on the affected brain regions. Gaining insights into why certain regions are resistant while others are susceptible is vital for advancing therapeutic strategies. While gene expression changes offer clues about disease responses across brain regions, the mixture of cell types therein obscures experimental results.
Huntington’s disease
Alzheimer’s disease
prion disease
amyotrophic lateral sclerosis
RiboTag
bacTRAP
scRNAseq
snRNAseq
1. Introduction
Imagine the fright of finding yourself in an unknown room, surrounded by unfamiliar people with unknown intentions, with no memory of how you got there. Imagine the frustration of not being able to control your body movements enough to get dressed. Imagine feeling so tired that you hallucinate, but nonetheless cannot obtain rejuvenating sleep. People with NDs face these challenges as their health gradually declines until their premature death. NDs not only have societal and economic consequences but also bring intense personal suffering. Sadly, the search for treatments is hindered by our limited knowledge of the diseases’ underlying molecular mechanisms.
NDs are widely thought to be caused by the misfolding of specific proteins that eventually clump together into aggregates. Although the disease-causing proteins are widely expressed, they tend to damage specific regions, a phenomenon known as selective vulnerability. Some of the proposed mechanisms explaining selective vulnerability include how the misfolded proteins or aggregates spread through the brain, how brain regions are connected in neural networks, and how protective or detoxifying proteins are regionally distributed [1][2][3][4][5][6]. A better understanding of these and other mechanisms could open new avenues for therapeutic discoveries. For over two decades, researchers have investigated changes to gene expression as an indicator of how vulnerable and resistant regions respond to disease. Given the diverse cell types in each region, analyzing them individually can enhance our understanding selective vulnerability.
2. Methods for Cell Type-Specific Gene Expression Analyses
The primary CST methods are RiboTag [7] and bacTRAP [8][9]. RiboTag uses Cre recombinase to direct the expression in cell types of interest, where an HA-tagged variant of Rpl22 (large subunit ribosome protein 22) is expressed from its native location in the genome. In contrast, bacTRAP uses a bacterial artificial chromosome (BAC) vector to express a GFP-tagged Rpl10a (large subunit ribosome protein 10a) from a random location in the genome. The researchers have previously discussed the nuances between the two methods [10], but here the researchers consider them practically equivalent and collectively categorize them as CST methods.
Essentially, CST methods function by capturing epitope-tagged ribosomes using antibodies. Employing transgenic methods, ribosomes are tagged because the epitope-tagged ribosome protein integrates into ribosomes during assembly (Figure 1). Transgenesis lets researchers focus the expression of the tagged ribosomes in select cell types, where they function normally and translate mRNAs into proteins. The epitope tags facilitate the immune capture of the ribosomes and their associated mRNAs from brain homogenates (Figure 1). This design offers several advantages:
-
Tagged ribosomes are present only in target cells, providing an efficient separation of desired mRNAs from those of unwanted cell types.
-
The captured mRNAs reflect the cell’s translatome, and thus provide insights into the proteins being synthesized by the cell [11].
-
The method is compatible with frozen tissues, limiting batch variation between samples.
An alternative to CST methods is scRNAseq, where cells from a tissue are physically separated and the transcriptome of each cell is analyzed. Popular methods encapsulate cells in oil droplets, acting as micro-reaction chambers for converting mRNA to cDNA (Figure 2). The process includes the marking of each transcript (i.e., each molecule) to control for amplification artifacts, to assign each transcript to a specific cell (barcoding), and the conversion of each mRNA into cDNA (Figure 2). Due to their unique barcodes, the products from all cells are pooled before final amplification.
A key step in scRNAseq is isolating single cells, which is especially challenging for neurons in the brain, where fine processes such as dendrites and synapses are easily lost. Several dissociation methods exist that use physical or enzymatic dissociation mechanisms, but they can bias the sample quality and obscure mRNA level measurements. snRNAseq serves as a good alternative to scRNAseq, since nuclei are less prone to enzymatic and physical isolation artifacts than whole cells. Furthermore, snRNAseq has the advantage of being suitable for fixed and frozen samples, enabling studies of archived postmortem human brain samples, which are not possible with scRNAseq where fresh tissue is required. Several studies have shown significant similarity in transcriptomic analyses between scRNAseq and snRNAseq [12][13][14][15], although microglial activation genes were depleted in snRNAseq compared to scRNAseq studies in AD [16]. Furthermore, a comparison of different tissue dissociation protocols found differences in cell composition and further demonstrated the potential for biases in scRNAseq and snRNAseq [17]. For example, twice the number of genes per cell were detected with snRNAseq compared to scRNAseq [17]. A systematic analysis comparing different tissue dissociation protocols, cell lysis, sequencing, and data analysis led to the establishment of a toolbox that provides guidelines for customizing sc/snRNAseq protocols [18].
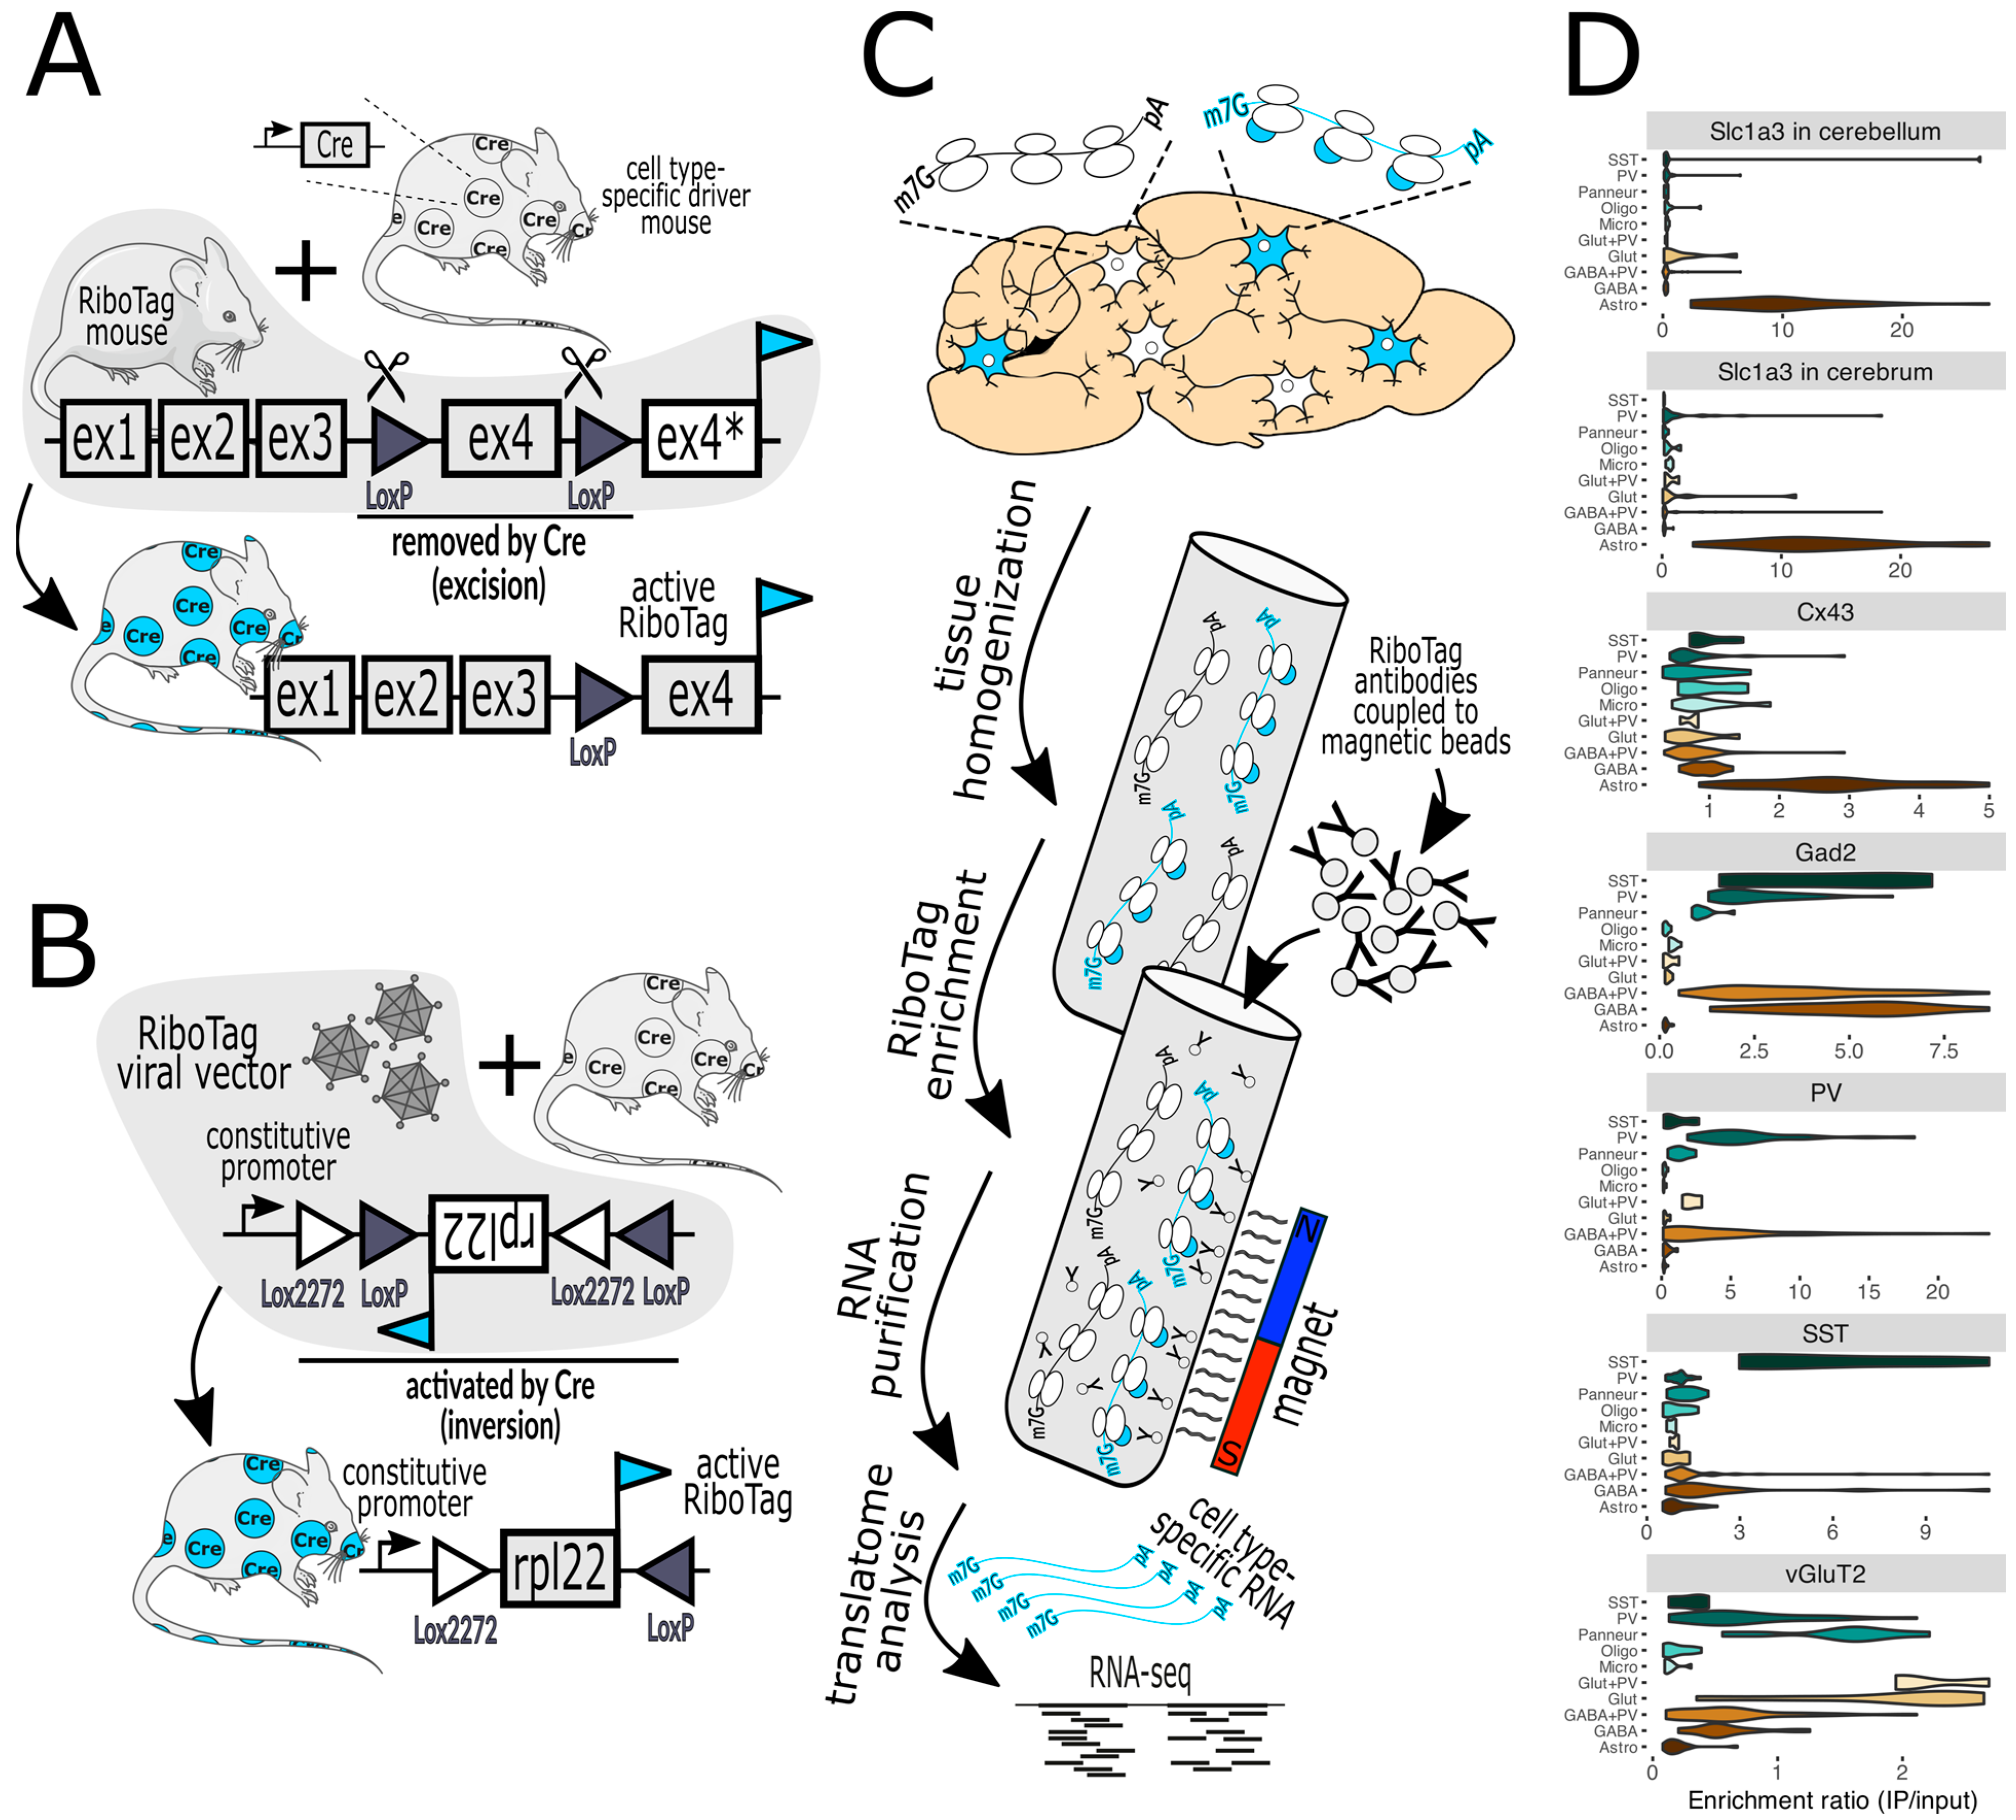
Figure 1. (A) In RiboTag mice, the native Rpl22 gene has been engineered such that activation with Cre recombinase, expressed in specific cell types, results in the expression of Rpl22 fused with an HA epitope tag (cyan flag) specifically in those cells. Before Cre activation, the tagged exon 4 (ex4) is not expressed (ex4*). (B) A variant of this method employs a viral vector that delivers a RiboTag transgene that is also activated by Cre. The bacTRAP mice are practically the same as RiboTag mice regarding the capture of tagged ribosomes and are thus not shown. (C) illustrates the workflow, commencing with the homogenization of brain tissue, the capture of tagged ribosomes (marked with cyan-colored bubbles) with antibody-labeled paramagnetic beads, and then their subsequent analysis via RNA-seq (next-generation sequencing) and bioinformatics. (D) demonstrates a typical validation experiment wherein the purification of RiboTag-labeled ribosomes expressed in specific cell types (top label on each chart) results in the enrichment of marker genes of the desired cells and the depletion of markers of off-target cells (marker gene classes are on the left of each chart). For example, activation by Cre in cells expressing Slc1a3 (astrocyte marker) in the cerebellum or cerebrum (top two violin plots) facilitates the enrichment of astrocyte genes and the depletion of genes from neurons and other glial cells. Lower charts show the results when Cre is expressed by Cx43 (astrocytes), Gad2 (GABAergic neurons), PV (parvalbumin neurons), SST (somatostatin neurons), and vGluT2 (glutamatergic neurons). Marker gene classes include SST, PV, Panneur (pan-neuronal), Oligo (oligodendrocytes), Micro (microglia), Glut+PV (PV-expressing glutamatergic neurons), Glut (glutamatergic neurons), GABA+PV (PV-expressing GABAergic neurons), GABA (GABAergic neurons), and Astro (astrocytes). The Slc1a3 data were published in [19] and the rest were published in [20]. Mouse and neuron shapes were generously provided by https://smart.servier.com (accessed on 12 January 2024) under a CC 3.0 license.

Figure 2. Workflow for scRNAseq and snRNAseq analyses. From the top down, cells of different types are marked in different colors. Cells or cell nuclei are gently dissociated and subjected to a device that orders them into a single file (left side, colored dots), and then merges each cell or nucleus with a single oil droplet (grey bubbles on the right) that carries barcodes that are unique to each droplet. The droplets are then pooled, amplified, and sequenced together, which diminishes batch effects. Features and similarities of each cell are then compared using t-SNE (t-distributed stochastic neighbor embedding) plots.
How do CST and sc/snRNAseq compare? Both methods face challenges with contamination from unintended cells [11]. CST analyzes a mix of related cell types, but captures approximately 15,000 genes per cell type, approaching the maximum number expected, since many genes are expressed only in certain organs or cell types. In contrast, sc/snRNAseq retrieves fewer genes but from distinct cells. A critical drawback of CST is the demand for artificial gene expression, usually delivered via transgenesis, rendering it unsuitable for human postmortem brain samples.
3. CST Studies of ALS
ALS primarily targets subsets of motor neurons (MNs) in the motor cortex, brainstem, and spinal cord [21]. While most ALS cases are sporadic, there are many cases driven by mutations in several genes, of which the first to be discovered was superoxide dismutase 1 (SOD1) [22]. Interestingly, different SOD1 mutations can have different effects on its enzymatic function and aggregation propensity, leading to mutation-specific disease changes [23]. This, and the fact that historically SOD1 was the first gene associated with ALS, led to the production of several thoroughly studied SOD1 mutant mouse lines [24][25].
The first application of CST in ND was with bacTRAP [26] in the loxSOD1G37R random integration mouse model of ALS [27], focusing on the MNs, astrocytes, and oligodendrocytes of spinal cords. Most of the study focused on the disease onset stage, marked at 8 months of a disease progression that reaches its terminal stage at 13.5 months. Transgene expression levels were measured and compared to the endogenous mouse SOD1 gene; mutant SOD1 was overexpressed 17-, 8-, and 21-fold in MNs, astrocytes, and oligodendrocytes, respectively. The authors then measured gene expression changes and found that MNs, the cells known to be most affected, had the highest number of DEGs at 260 (85% were increased), versus 108 for astrocytes, and 23 for oligodendrocytes. Of the MN DEGs that were increased, 10% had pathway features related to synaptic structures and cell junctions [16]. Genes related to the unfolded protein response (UPR) were also upregulated, along with the diminished expression of genes associated with ribosome biogenesis. This shift in gene expression might represent the cells’ adaptive strategy to reduce protein synthesis, potentially serving as a defense mechanism to counteract the detrimental effects of SOD1G37R misfolding. Notably, the study did not find alterations in mitochondrial genes, in contrast to other studies discussed later in this research, where changes to ribosome and mitochondria biogenesis appear to be coupled. Nonetheless, it is noteworthy that there were 10 times more DEGs in MNs than in oligodendrocytes at this disease onset stage. According to the authors, the disparity in the number of DEGs, with MNs showing a high count and oligodendrocytes a considerably lower one, suggests that the disease begins in MNs and subsequently impacts oligodendrocytes as it progresses [16].
A more recent study of ALS employed bacTRAP to reveal differences between vulnerable and resistant MNs in layer 5b of the motor cortex [18] using SOD1G93A transgenic mice [19]. New bacTRAP lines were created with promoters that were specifically active in layer 5b, based on anatomical data. Interestingly, two of the new mouse lines, built into BAC transgenes of Colgalt2 and Gprin3, both expressed the bacTRAP protein in layer 5b of the motor cortex (M1). The bacTRAP-expressing neuronal populations had similar morphology and size, and both projected to the pons region of the brainstem, but Gprin3+ neurons also projected to the spinal cord. Importantly, with similar transgene expression levels in both cell types, by the time SOD1G93A transgenic mice reached 110 days of age, approximately 40% of the Gprin3+ neurons died. Meanwhile, there was no noticeable decline in the number of Colgalt2+ neurons. This striking difference could be attributed to their intrinsic gene expression patterns. Gprin3+ neurons, even at baseline, exhibited an elevated propensity for oxidative phosphorylation but were notably lacking in genes that safeguarded against oxidative damage, and the SOD1G93A transgene may have exaggerated this imbalance [18].
When expressing the SOD1G93A transgene, Gprin3+ neurons underwent dramatic gene expression changes, particularly increasing their expression of an array of mitochondrial proteins, potentially amplifying oxidative damage through the increased production of hazardous oxidation catabolites [18]. It is hard to envision how this potentially dangerous response could be beneficial to these vulnerable neurons, but it is also improbable that this coordinated response is random. Also increased were genes encoding ribosomal proteins, and a similar coordination between ribosome and mitochondria biogenesis has been reported in HD [20]. Due to the high energetic expense required to generate ribosomes, it is logical for the biogenesis of ribosomes and mitochondria to be coordinated [21]. In this context, it could be that the primary response was to increase ribosome biogenesis, leading to the increased need for mitochondrial biogenesis and metabolic activity that doomed these neurons. Interestingly, the Colgalt2+ MNs also increased the expression of both mitochondrial and ribosomal proteins, but the increase was smaller in scale (about 30% less) and their higher baseline of protection from oxidative damage likely enabled them to fare much better than Gprin3+ neurons. Notably, both neuron types decreased their expression of genes related to synapse and axon morphogenesis, with a larger effect in the Gprin3+ neurons. The authors concluded that intrinsic properties of the Colgalt2+ MNs (i.e., the higher baseline expression of antioxidant genes) determined their resistance.
To summarize the results from the ALS section, the first study [26] indicated that the biogenesis of ribosomes decreased in the most susceptible cells, despite no concurrent decrease in mitochondrial biogenesis. This reduction was accompanied by a pronounced activation of the unfolded protein response (UPR). The second study [28] compared two neuron types that are strikingly similar. While the more susceptible neurons exhibited tenfold more differentially expressed genes (DEGs) than their resistant counterparts, the overall genetic alterations were similar. These changes in gene expression seemed to align with specific molecular pathways, most notably increased ribosome and mitochondrial biogenesis. It is important to note that when this analysis took place, 40% of Gprin3+ MNs had already succumbed. Hence, the observed changes in gene expression might either represent the adaptive strategies of the surviving neurons or be attributed to a change in the compared populations. Nonetheless, a consistent theme from both studies is that even the more resistant cells can exhibit as much disease-causing protein expression as the vulnerable ones, and the highest DEG counts typically arise in the latter. Interestingly, while the UPR was prominent in the first study, it was absent in the second, even when numerous neurons in the latter were evidently under stress.
4. CST Studies of Prion Diseases
Prion diseases are another class of rare neurodegenerative diseases. While they are most infamous for cases caused by infection (e.g., “mad cow” disease) from misfolded forms of the prion protein (PrP), they can also be caused by the inheritance of mutations in the gene encoding PrP (Prnp) or from spontaneous PrP misfolding [4]. Although rare in humans, acquired prion diseases (i.e., those caused by infection) are a problem in farmed sheep and goats in Europe and in wild cervids in North America [29][30], a problem that is emerging in Northern Europe with new properties [31][32]. The diseases’ infectious nature was exploited to develop some of the first mouse models of neurodegenerative diseases. Work on rodent models made biochemical purifications of the infectious agent possible and led to the discovery of PrP, and in turn, PRNP [33][34]. This led to the discovery that multiple inherited neurodegenerative diseases including fatal familial insomnia (FFI), genetic Creutzfeldt–Jakob disease (gCJD), and Gerstmann–Straussler–Scheinker syndrome (GSS), are caused by certain mutations in PRNP [35][36][37]. Prion diseases cause damage in specific brain regions depending on the disease subtype [4][38][39]. Furthermore, the shapes of PrP aggregates and the abundance and size of spongiform degeneration “holes”, a hallmark of prion diseases, also vary according to the disease subtype. Interestingly, PV+ neurons, a subset of GABAergic inhibitory neurons, were reported to be highly vulnerable to prion diseases in humans and rodents [40][41][42], though less severely affected in FFI [38]. Another study of acquired prion disease used a Cre-dependent TRAP method but detected changes only at the terminal stage [43]. Similarly, a scRNAseq study that focused on a near-terminal disease stage has been reported [44]. Although these reports provided novel insights into disease mechanisms, the results were focused on terminal disease stages, unlike all other studies described in this research, and thus will not be considered further.
A summary of the prion disease studies leads to several important conclusions. Since in both studies PrP was expressed from the native gene in its endogenous locus, PrP expression pattern differences cannot account for the different results reported in the two studies. Therefore, the first conclusion is that the same protein can unleash different gene expression responses within a specific cell type, depending on how the protein misfolds. Second, different cell types respond to the same misfolded protein form differently. Third, since glutamatergic neurons expressed PrP more highly than all other cell types studied, their mild response during prion disease suggests the most affected cells do not necessarily express the protein the highest. Fourth, vulnerable cell types (i.e., PV+ neurons) can have a very mild response with surprisingly few DEGs. Fifth, the UPR is not always induced during the early stages of ND.
5. CST Studies of HD
HD is caused by the expansion of a CAG repeat in exon 1 of the huntingtin (HTT) gene, which is translated into a polyglutamine tract. While repeat lengths of 6 to 35 CAGs do not cause disease, repeats of 36 to 39 CAGs are linked to HD with incomplete penetrance, and repeats with 40 or more CAGs cause HD with high penetrance at an average age of 40 years [45][46][47]. Early HD neuropathology is characterized by the selective degeneration of GABAergic medium spiny neurons (SPNs) of the striatum, which constitute around 95% of all striatal neurons, while other striatal cell types are usually spared [48][49]. Striatal SPNs can be further subdivided into two main subtypes based on their expression of dopamine receptors (Drds). Drd2-expressing SPNs of the indirect pathway (iSPN) show higher vulnerability than Drd1-expressing SPNs of the direct pathway (dSPN) [50]. This interplay of the regional and cell type-specific vulnerability of neurons to mutant Htt (mHtt) is a subject of great interest in the HD field, but our understanding of the underlying mechanisms remains incomplete. Fortunately, recent studies employing bacTRAP, RiboTag, and snRNAseq methods have provided new details of cell type-specific responses to mHtt, as elaborated in the following section.
Since HD is strictly genetic, it is reasonable to assume that there is a common molecular mechanism in all patients, and knowledge derived from studies of genetically engineered mice may be relevant for HD patients. The first genetic mouse model with a disease-relevant phenotype, the R6/2 model, was generated by injecting a fragment of the mutant HTT gene from a human with HD into the pronucleus of a fertilized mouse oocyte, where it integrated into a random location [51]. These mice develop a severe neurodegenerative disease that leads to death in young adult mice, at approximately 20% of their normal lifespan. In pursuit of a more accurate model, researchers employed another strategy: a long CAG repeat was inserted into the mouse Htt gene in its native location in the genome, resulting in KI mice. This has been performed by multiple labs with one of the key differences between models being that some included various amounts of human DNA sequences [52][53][54], whereas others used only the mouse Htt sequence [55][56]. Although these seemingly subtle differences can impact disease severity, the strongest determinant of severity is the length of the CAG repeat, where 150 to 200 triplets result in mild neurological disease, even at an advanced age, with little neuronal loss and only subtle markers of neurodegeneration. Despite these apparent shortcomings, the KI models cause gene expression changes detectable in crude tissue lysates reminiscent of those detected in similar preparations of human HD samples [57], offering valuable insights into the disease’s molecular mechanisms.
6. CST Studies of AD
AD diminishes cognition and memory by attacking brain regions linked to those functions, especially the cornu ammonis 1 (CA1) region of the hippocampus and layer II of the entorhinal cortex (ECII) [58][59]. The locus coreuelus is also affected very early and with a high impact [60][61][62][63], but is understudied, possibly since its connection to cognition and memory, the most studied clinical features of AD, is not well established. As with other NDs, AD neuropathology is marked by the aggregation of specific proteins. Amyloid beta (AB) peptides, typically consisting of 40 or 42 amino acids, are derived from proteolysis of the amyloid precursor protein and clump together into extracellular amyloid plaques when their stoichiometric balance is perturbed [64][65][66]. Similarly, the microtubule-associated protein tau forms aggregates that are toxic. Tau has six typical isoforms due to alternative splicing, with zero, one, or two inserts at the N-terminus, while its C-terminal half typically contains either three or four repeating units (3R and 4R, respectively) of microtubule-binding domains [2][67]. Furthermore, tau is subject to multiple post-translational modifications including acetylation, ubiquitylation, and phosphorylation [2]. The imbalance of 3R/4R ratios and the subsequent aggregation and modification results in intracellular tau aggregates known as neurofibrillary tangles (NFTs), which are widely thought to be toxic in AD and related tauopathies [2][68][69]. While amyloid plaques appear to precede NFTs, they tend to be widespread and not selective, whereas the location of NFTs more closely correlates with neuronal loss [2][59][70].
To generate new knowledge about selective vulnerability in AD, bacTRAP mice were generated to selectively study two types of vulnerable neurons, namely excitatory neurons in CA1 and ECII, as well as five types of resistant neurons, including excitatory neurons in the CA2, CA3, and dentate gyrus of the hippocampus, and excitatory neurons in visual and somatosensory cortical areas [71]. Translatome signatures were created for each neuron type in non-diseased mice at 5, 12, and 24 months of age, with the rationale that aging can inform about AD mechanisms, since it is an age-dependent disease. These signatures were validated by comparing each, one by one, to the transcriptome signatures of 205 human brain regions. Remarkably, neuronal signatures for each of the seven mouse regions most closely matched the signatures of the corresponding human region. The authors then built new computational models to combine the mouse signature data with human genome-wide association study (GWAS) data based on NFT pathology that had been sculpted with algorithms to include cell type-specific functional network information. They then created a new test data set composed of bacTRAP-derived translatomes of ECII neurons in 6-month-old mice genetically engineered to generate AB plaques [72] (the authors studied only this cell type in the context of the disease). This analysis detected 1936 DEGs compared to non-transgenic controls. Contrary to many of the studies described above, the ribosomes were not changed, but rather several cytoskeletal and synaptic proteins were altered, similar to some of the previous studies described above. Beyond the cytoskeletal changes seen in many NDs, this study also yielded a potential explanation for a connection between A-syn aggregates and AD, as explained below.
Since the computational model included GWAS data tied to the NFT burden in AD patients, the authors were well-positioned to detect genes involved in tau processing. Indeed, they found that PTBP1 (polypyrimidine tract binding protein 1) regulates tau splicing and its dysregulation causes an imbalance in 3R/4R tau levels. Interestingly, PTBP1 also regulated A-syn. A-syn is most infamous for its prominent role in a range of NDs known as synucleinopathies, including Parkinson’s disease, Lewy body dementia, and multiple systems atrophy. However, it was also previously associated with AD [73][74], although the molecular mechanism was poorly understood. A study by Roussarie et al. implicates A-syn’s established role at the synapse, where the neuronal cytoskeleton is most dynamic, as the key to its connection to AD [71]. The authors concluded that high vulnerability may be anchored in ECII neurons because their processes are highly dynamic, which can easily become unbalanced with age or an AB plaque burden, leading to tau imbalance, toxic NFT formation, and its eventual spread to secondarily vulnerable regions [2][59][70].
Interestingly, the snRNAseq studies revealed different information about selective vulnerability in AD [75][76]. In one of the first such studies of the prefrontal cortex, it was concluded that early in disease there are many cell type-specific gene expression changes, especially downregulations, but the differences become diminished as the disease progresses [75]. Furthermore, pathways related to myelination, in both oligodendrocytes and neurons, were prominently affected [75]. In a later study using snRNAseq from human samples [76], it was determined that RORB (Retinoic acid receptor-related Orphan Receptor B), a protein best characterized for its role in cortical development [77][78][79], served as a highly useful marker to identify specifically those neurons in ECII that are most vulnerable [76]. It was determined that these RORB+ cells in ECII have very similar signatures as a cell type in the superior frontal gyrus that is also vulnerable. Histological experiments revealed that vulnerable RORB+ cell types had at least two broadly different morphologies in both regions, indicating that cell shape alone (and thus probably also firing properties) is not sufficient to distinguish vulnerable from resistant cells. Interestingly, in both snRNAseq studies, inhibitory neurons showed little, if any, vulnerability [75][76].
Thus, through these three studies of AD, we have learned that functional weaknesses include the neuronal cytoskeleton and myelination, and that RORB is an excellent marker of vulnerable neurons. While these impressive results do not mean the selective vulnerability problem of AD is solved, they do outline the direction for additional experimentation. Indeed, all of these experiments neglected the locus coeruleus, which has NFTs even before ECII, the degeneration of which has been demonstrated to trigger the degeneration of hippocampal and cortical areas [60][61][62][63]. Using bacTRAP or RiboTag in RORB+ neurons in multiple regions, especially ECII, CA1, and the locus coeruleus, may build on the foundational knowledge provided by the studies reviewed here.
References
- Alegre-Abarrategui, J.; Brimblecombe, K.R.; Roberts, R.F.; Velentza-Almpani, E.; Tilley, B.S.; Bengoa-Vergniory, N.; Proukakis, C. Selective vulnerability in alpha-synucleinopathies. Acta Neuropathol. 2019, 138, 681–704.
- Carroll, T.; Guha, S.; Nehrke, K.; Johnson, G.V.W. Tau Post-Translational Modifications: Potentiators of Selective Vulnerability in Sporadic Alzheimer’s Disease. Biology 2021, 10, 1047.
- Fu, H.; Hardy, J.; Duff, K.E. Selective vulnerability in neurodegenerative diseases. Nat. Neurosci. 2018, 21, 1350–1358.
- Jackson, W.S. Selective vulnerability to neurodegenerative disease: The curious case of Prion Protein. Dis. Model. Mech. 2014, 7, 21–29.
- Mattsson, N.; Schott, J.M.; Hardy, J.; Turner, M.R.; Zetterberg, H. Selective vulnerability in neurodegeneration: Insights from clinical variants of Alzheimer’s disease. J. Neurol. Neurosurg. Psychiatry 2016, 87, 1000–1004.
- Zheng, Y.Q.; Zhang, Y.; Yau, Y.; Zeighami, Y.; Larcher, K.; Misic, B.; Dagher, A. Local vulnerability and global connectivity jointly shape neurodegenerative disease propagation. PLoS Biol. 2019, 17, e3000495.
- Sanz, E.; Yang, L.; Su, T.; Morris, D.R.; McKnight, G.S.; Amieux, P.S. Cell-type-specific isolation of ribosome-associated mRNA from complex tissues. Proc. Natl. Acad. Sci. USA 2009, 106, 13939–13944.
- Doyle, J.P.; Dougherty, J.D.; Heiman, M.; Schmidt, E.F.; Stevens, T.R.; Ma, G.; Bupp, S.; Shrestha, P.; Shah, R.D.; Doughty, M.L.; et al. Application of a translational profiling approach for the comparative analysis of CNS cell types. Cell 2008, 135, 749–762.
- Heiman, M.; Schaefer, A.; Gong, S.; Peterson, J.D.; Day, M.; Ramsey, K.E.; Suarez-Farinas, M.; Schwarz, C.; Stephan, D.A.; Surmeier, D.J.; et al. A translational profiling approach for the molecular characterization of CNS cell types. Cell 2008, 135, 738–748.
- Kaczmarczyk, L.; Jackson, W.S. Astonishing advances in mouse genetic tools for biomedical research. Swiss Med. Wkly. 2015, 145, w14186.
- Battle, A.; Khan, Z.; Wang, S.H.; Mitrano, A.; Ford, M.J.; Pritchard, J.K.; Gilad, Y. Genomic variation. Impact of regulatory variation from RNA to protein. Science 2015, 347, 664–667.
- Bakken, T.E.; van Velthoven, C.T.; Menon, V.; Hodge, R.D.; Yao, Z.; Nguyen, T.N.; Graybuck, L.T.; Horwitz, G.D.; Bertagnolli, D.; Goldy, J.; et al. Single-cell and single-nucleus RNA-seq uncovers shared and distinct axes of variation in dorsal LGN neurons in mice, non-human primates, and humans. eLife 2021, 10, e64875.
- Habib, N.; Avraham-Davidi, I.; Basu, A.; Burks, T.; Shekhar, K.; Hofree, M.; Choudhury, S.R.; Aguet, F.; Gelfand, E.; Ardlie, K.; et al. Massively parallel single-nucleus RNA-seq with DroNc-seq. Nat. Methods 2017, 14, 955–958.
- Lake, B.B.; Chen, S.; Hoshi, M.; Plongthongkum, N.; Salamon, D.; Knoten, A.; Vijayan, A.; Venkatesh, R.; Kim, E.H.; Gao, D.; et al. A single-nucleus RNA-sequencing pipeline to decipher the molecular anatomy and pathophysiology of human kidneys. Nat. Commun. 2019, 10, 2832.
- Zhou, Y.; Song, W.M.; Andhey, P.S.; Swain, A.; Levy, T.; Miller, K.R.; Poliani, P.L.; Cominelli, M.; Grover, S.; Gilfillan, S.; et al. Human and mouse single-nucleus transcriptomics reveal TREM2-dependent and TREM2-independent cellular responses in Alzheimer’s disease. Nat. Med. 2020, 26, 131–142.
- Thrupp, N.; Sala Frigerio, C.; Wolfs, L.; Skene, N.G.; Fattorelli, N.; Poovathingal, S.; Fourne, Y.; Matthews, P.M.; Theys, T.; Mancuso, R.; et al. Single-Nucleus RNA-Seq Is Not Suitable for Detection of Microglial Activation Genes in Humans. Cell Rep. 2020, 32, 108189.
- Denisenko, E.; Guo, B.B.; Jones, M.; Hou, R.; de Kock, L.; Lassmann, T.; Poppe, D.; Clement, O.; Simmons, R.K.; Lister, R.; et al. Systematic assessment of tissue dissociation and storage biases in single-cell and single-nucleus RNA-seq workflows. Genome Biol. 2020, 21, 130.
- Slyper, M.; Porter, C.B.M.; Ashenberg, O.; Waldman, J.; Drokhlyansky, E.; Wakiro, I.; Smillie, C.; Smith-Rosario, G.; Wu, J.; Dionne, D.; et al. A single-cell and single-nucleus RNA-Seq toolbox for fresh and frozen human tumors. Nat. Med. 2020, 26, 792–802.
- Kaczmarczyk, L.; Reichenbach, N.; Blank, N.; Jonson, M.; Dittrich, L.; Petzold, G.C.; Jackson, W.S. Slc1a3-2A-CreERT2 mice reveal unique features of Bergmann glia and augment a growing collection of Cre drivers and effectors in the 129S4 genetic background. Sci. Rep. 2021, 11, 5412.
- Kaczmarczyk, L.; Schleif, M.; Dittrich, L.; Williams, R.H.; Koderman, M.; Bansal, V.; Rajput, A.; Schulte, T.; Jonson, M.; Krost, C.; et al. Distinct translatome changes in specific neural populations precede electroencephalographic changes in prion-infected mice. PLoS Pathog. 2022, 18, e1010747.
- Schweingruber, C.; Hedlund, E. The Cell Autonomous and Non-Cell Autonomous Aspects of Neuronal Vulnerability and Resilience in Amyotrophic Lateral Sclerosis. Biology 2022, 11, 1191.
- Rosen, D.R.; Siddique, T.; Patterson, D.; Figlewicz, D.A.; Sapp, P.; Hentati, A.; Donaldson, D.; Goto, J.; O’Regan, J.P.; Deng, H.X.; et al. Mutations in Cu/Zn superoxide dismutase gene are associated with familial amyotrophic lateral sclerosis. Nature 1993, 362, 59–62.
- Kaur, S.J.; McKeown, S.R.; Rashid, S. Mutant SOD1 mediated pathogenesis of Amyotrophic Lateral Sclerosis. Gene 2016, 577, 109–118.
- Julien, J.P.; Kriz, J. Transgenic mouse models of amyotrophic lateral sclerosis. Biochim. Biophys. Acta 2006, 1762, 1013–1024.
- Alhindi, A.; Boehm, I.; Chaytow, H. Small junction, big problems: Neuromuscular junction pathology in mouse models of amyotrophic lateral sclerosis (ALS). J. Anat. 2022, 241, 1089–1107.
- Sun, S.; Sun, Y.; Ling, S.C.; Ferraiuolo, L.; McAlonis-Downes, M.; Zou, Y.; Drenner, K.; Wang, Y.; Ditsworth, D.; Tokunaga, S.; et al. Translational profiling identifies a cascade of damage initiated in motor neurons and spreading to glia in mutant SOD1-mediated ALS. Proc. Natl. Acad. Sci. USA 2015, 112, E6993–E7002.
- Boillee, S.; Yamanaka, K.; Lobsiger, C.S.; Copeland, N.G.; Jenkins, N.A.; Kassiotis, G.; Kollias, G.; Cleveland, D.W. Onset and progression in inherited ALS determined by motor neurons and microglia. Science 2006, 312, 1389–1392.
- Moya, M.V.; Kim, R.D.; Rao, M.N.; Cotto, B.A.; Pickett, S.B.; Sferrazza, C.E.; Heintz, N.; Schmidt, E.F. Unique molecular features and cellular responses differentiate two populations of motor cortical layer 5b neurons in a preclinical model of ALS. Cell Rep. 2022, 38, 110556.
- Arifin, M.I.; Kaczmarczyk, L.; Zeng, D.; Hannaoui, S.; Lee, C.; Chang, S.C.; Mitchell, G.; McKenzie, D.; Beekes, M.; Jackson, W.; et al. Heterozygosity for cervid S138N polymorphism results in subclinical CWD in gene-targeted mice and progressive inhibition of prion conversion. Proc. Natl. Acad. Sci. USA 2023, 120, e2221060120.
- Hannaoui, S.; Zemlyankina, I.; Chang, S.C.; Arifin, M.I.; Beringue, V.; McKenzie, D.; Schatzl, H.M.; Gilch, S. Transmission of cervid prions to humanized mice demonstrates the zoonotic potential of CWD. Acta Neuropathol. 2022, 144, 767–784.
- Sun, J.L.; Kim, S.; Crowell, J.; Webster, B.K.; Raisley, E.K.; Lowe, D.C.; Bian, J.; Korpenfelt, S.L.; Benestad, S.L.; Telling, G.C. Novel Prion Strain as Cause of Chronic Wasting Disease in a Moose, Finland. Emerg. Infect. Dis. 2023, 29, 323–332.
- Tranulis, M.A.; Gavier-Widen, D.; Vage, J.; Noremark, M.; Korpenfelt, S.L.; Hautaniemi, M.; Pirisinu, L.; Nonno, R.; Benestad, S.L. Chronic wasting disease in Europe: New strains on the horizon. Acta Vet. Scand. 2021, 63, 48.
- Prusiner, S.B. Novel proteinaceous infectious particles cause scrapie. Science 1982, 216, 136–144.
- Prusiner, S.B. Prions. Proc. Natl. Acad. Sci. USA 1998, 95, 13363–13383.
- Lugaresi, E.; Medori, R.; Montagna, P.; Baruzzi, A.; Cortelli, P.; Lugaresi, A.; Tinuper, P.; Zucconi, M.; Gambetti, P. Fatal familial insomnia and dysautonomia with selective degeneration of thalamic nuclei. N. Engl. J. Med. 1986, 315, 997–1003.
- Hsiao, K.; Baker, H.F.; Crow, T.J.; Poulter, M.; Owen, F.; Terwilliger, J.D.; Westaway, D.; Ott, J.; Prusiner, S.B. Linkage of a prion protein missense variant to Gerstmann-Straussler syndrome. Nature 1989, 338, 342–345.
- Goldfarb, L.G.; Mitrova, E.; Brown, P.; Toh, B.K.; Gajdusek, D.C. Mutation in codon 200 of scrapie amyloid protein gene in two clusters of Creutzfeldt-Jakob disease in Slovakia. Lancet 1990, 336, 514–515.
- Guentchev, M.; Wanschitz, J.; Voigtlander, T.; Flicker, H.; Budka, H. Selective neuronal vulnerability in human prion diseases. Fatal familial insomnia differs from other types of prion diseases. Am. J. Pathol. 1999, 155, 1453–1457.
- Kovacs, G.G.; Trabattoni, G.; Hainfellner, J.A.; Ironside, J.W.; Knight, R.S.; Budka, H. Mutations of the prion protein gene phenotypic spectrum. J. Neurol. 2002, 249, 1567–1582.
- Guentchev, M.; Groschup, M.H.; Kordek, R.; Liberski, P.P.; Budka, H. Severe, early and selective loss of a subpopulation of GABAergic inhibitory neurons in experimental transmissible spongiform encephalopathies. Brain Pathol. 1998, 8, 615–623.
- Guentchev, M.; Hainfellner, J.A.; Trabattoni, G.R.; Budka, H. Distribution of parvalbumin-immunoreactive neurons in brain correlates with hippocampal and temporal cortical pathology in Creutzfeldt-Jakob disease. J. Neuropathol. Exp. Neurol. 1997, 56, 1119–1124.
- Voigtlander, T.; Unterberger, U.; Guentchev, M.; Schwaller, B.; Celio, M.R.; Meyer, M.; Budka, H. The role of parvalbumin and calbindin D28k in experimental scrapie. Neuropathol. Appl. Neurobiol. 2008, 34, 435–445.
- Scheckel, C.; Imeri, M.; Schwarz, P.; Aguzzi, A. Ribosomal profiling during prion disease uncovers progressive translational derangement in glia but not in neurons. eLife 2020, 9, e62911.
- Slota, J.A.; Sajesh, B.V.; Frost, K.F.; Medina, S.J.; Booth, S.A. Dysregulation of neuroprotective astrocytes, a spectrum of microglial activation states, and altered hippocampal neurogenesis are revealed by single-cell RNA sequencing in prion disease. Acta Neuropathol. Commun. 2022, 10, 161.
- Kremer, B.; Goldberg, P.; Andrew, S.E.; Theilmann, J.; Telenius, H.; Zeisler, J.; Squitieri, F.; Lin, B.; Bassett, A.; Almqvist, E.; et al. A worldwide study of the Huntington’s disease mutation. The sensitivity and specificity of measuring CAG repeats. N. Engl. J. Med. 1994, 330, 1401–1406.
- Langbehn, D.R.; Hayden, M.R.; Paulsen, J.S.; the PREDICT-HD Investigators of the Huntington Study Group. CAG-repeat length and the age of onset in Huntington disease (HD): A review and validation study of statistical approaches. Am. J. Med. Genet. B Neuropsychiatr. Genet. 2010, 153B, 397–408.
- Sequeiros, J.; Ramos, E.M.; Cerqueira, J.; Costa, M.C.; Sousa, A.; Pinto-Basto, J.; Alonso, I. Large normal and reduced penetrance alleles in Huntington disease: Instability in families and frequency at the laboratory, at the clinic and in the population. Clin. Genet. 2010, 78, 381–387.
- Graveland, G.A.; Williams, R.S.; DiFiglia, M. Evidence for degenerative and regenerative changes in neostriatal spiny neurons in Huntington’s disease. Science 1985, 227, 770–773.
- Reiner, A.; Albin, R.L.; Anderson, K.D.; D’Amato, C.J.; Penney, J.B.; Young, A.B. Differential loss of striatal projection neurons in Huntington disease. Proc. Natl. Acad. Sci. USA 1988, 85, 5733–5737.
- Plotkin, J.L.; Goldberg, J.A. Thinking Outside the Box (and Arrow): Current Themes in Striatal Dysfunction in Movement Disorders. Neuroscientist 2019, 25, 359–379.
- Mangiarini, L.; Sathasivam, K.; Seller, M.; Cozens, B.; Harper, A.; Hetherington, C.; Lawton, M.; Trottier, Y.; Lehrach, H.; Davies, S.W.; et al. Exon 1 of the HD gene with an expanded CAG repeat is sufficient to cause a progressive neurological phenotype in transgenic mice. Cell 1996, 87, 493–506.
- Franich, N.R.; Hickey, M.A.; Zhu, C.; Osborne, G.F.; Ali, N.; Chu, T.; Bove, N.H.; Lemesre, V.; Lerner, R.P.; Zeitlin, S.O.; et al. Phenotype onset in Huntington’s disease knock-in mice is correlated with the incomplete splicing of the mutant huntingtin gene. J. Neurosci. Res. 2019, 97, 1590–1605.
- Southwell, A.L.; Smith-Dijak, A.; Kay, C.; Sepers, M.; Villanueva, E.B.; Parsons, M.P.; Xie, Y.; Anderson, L.; Felczak, B.; Waltl, S.; et al. An enhanced Q175 knock-in mouse model of Huntington disease with higher mutant huntingtin levels and accelerated disease phenotypes. Hum. Mol. Genet. 2016, 25, 3654–3675.
- Wheeler, V.C.; Auerbach, W.; White, J.K.; Srinidhi, J.; Auerbach, A.; Ryan, A.; Duyao, M.P.; Vrbanac, V.; Weaver, M.; Gusella, J.F.; et al. Length-dependent gametic CAG repeat instability in the Huntington’s disease knock-in mouse. Hum. Mol. Genet. 1999, 8, 115–122.
- Heng, M.Y.; Duong, D.K.; Albin, R.L.; Tallaksen-Greene, S.J.; Hunter, J.M.; Lesort, M.J.; Osmand, A.; Paulson, H.L.; Detloff, P.J. Early autophagic response in a novel knock-in model of Huntington disease. Hum. Mol. Genet. 2010, 19, 3702–3720.
- Lin, C.H.; Tallaksen-Greene, S.; Chien, W.M.; Cearley, J.A.; Jackson, W.S.; Crouse, A.B.; Ren, S.; Li, X.J.; Albin, R.L.; Detloff, P.J. Neurological abnormalities in a knock-in mouse model of Huntington’s disease. Hum. Mol. Genet. 2001, 10, 137–144.
- Langfelder, P.; Cantle, J.P.; Chatzopoulou, D.; Wang, N.; Gao, F.; Al-Ramahi, I.; Lu, X.H.; Ramos, E.M.; El-Zein, K.; Zhao, Y.; et al. Integrated genomics and proteomics define huntingtin CAG length-dependent networks in mice. Nat. Neurosci. 2016, 19, 623–633.
- Hyman, B.T.; Van Hoesen, G.W.; Damasio, A.R.; Barnes, C.L. Alzheimer’s disease: Cell-specific pathology isolates the hippocampal formation. Science 1984, 225, 1168–1170.
- Braak, H.; Braak, E. Neuropathological stageing of Alzheimer-related changes. Acta Neuropathol. 1991, 82, 239–259.
- Heneka, M.T.; Nadrigny, F.; Regen, T.; Martinez-Hernandez, A.; Dumitrescu-Ozimek, L.; Terwel, D.; Jardanhazi-Kurutz, D.; Walter, J.; Kirchhoff, F.; Hanisch, U.K.; et al. Locus ceruleus controls Alzheimer’s disease pathology by modulating microglial functions through norepinephrine. Proc. Natl. Acad. Sci. USA 2010, 107, 6058–6063.
- Heneka, M.T.; Ramanathan, M.; Jacobs, A.H.; Dumitrescu-Ozimek, L.; Bilkei-Gorzo, A.; Debeir, T.; Sastre, M.; Galldiks, N.; Zimmer, A.; Hoehn, M.; et al. Locus ceruleus degeneration promotes Alzheimer pathogenesis in amyloid precursor protein 23 transgenic mice. J. Neurosci. 2006, 26, 1343–1354.
- Jardanhazi-Kurutz, D.; Kummer, M.P.; Terwel, D.; Vogel, K.; Thiele, A.; Heneka, M.T. Distinct adrenergic system changes and neuroinflammation in response to induced locus ceruleus degeneration in APP/PS1 transgenic mice. Neuroscience 2011, 176, 396–407.
- Mercan, D.; Heneka, M.T. The Contribution of the Locus Coeruleus-Noradrenaline System Degeneration during the Progression of Alzheimer’s Disease. Biology 2022, 11, 1822.
- Hardy, J.; Selkoe, D.J. The amyloid hypothesis of Alzheimer’s disease: Progress and problems on the road to therapeutics. Science 2002, 297, 353–356.
- Hardy, J.A.; Higgins, G.A. Alzheimer’s disease: The amyloid cascade hypothesis. Science 1992, 256, 184–185.
- Selkoe, D.J. The molecular pathology of Alzheimer’s disease. Neuron 1991, 6, 487–498.
- Mandelkow, E.M.; Mandelkow, E. Tau in Alzheimer’s disease. Trends Cell Biol. 1998, 8, 425–427.
- Grundke-Iqbal, I.; Iqbal, K.; Tung, Y.C.; Quinlan, M.; Wisniewski, H.M.; Binder, L.I. Abnormal phosphorylation of the microtubule-associated protein tau (tau) in Alzheimer cytoskeletal pathology. Proc. Natl. Acad. Sci. USA 1986, 83, 4913–4917.
- Kosik, K.S.; Joachim, C.L.; Selkoe, D.J. Microtubule-associated protein tau (tau) is a major antigenic component of paired helical filaments in Alzheimer disease. Proc. Natl. Acad. Sci. USA 1986, 83, 4044–4048.
- Braak, H.; Braak, E. Staging of Alzheimer’s disease-related neurofibrillary changes. Neurobiol. Aging 1995, 16, 271–278; discussion 278–284.
- Roussarie, J.P.; Yao, V.; Rodriguez-Rodriguez, P.; Oughtred, R.; Rust, J.; Plautz, Z.; Kasturia, S.; Albornoz, C.; Wang, W.; Schmidt, E.F.; et al. Selective Neuronal Vulnerability in Alzheimer’s Disease: A Network-Based Analysis. Neuron 2020, 107, 821–835.e812.
- Jankowsky, J.L.; Slunt, H.H.; Ratovitski, T.; Jenkins, N.A.; Copeland, N.G.; Borchelt, D.R. Co-expression of multiple transgenes in mouse CNS: A comparison of strategies. Biomol. Eng. 2001, 17, 157–165.
- Lippa, C.F.; Fujiwara, H.; Mann, D.M.; Giasson, B.; Baba, M.; Schmidt, M.L.; Nee, L.E.; O’Connell, B.; Pollen, D.A.; St George-Hyslop, P.; et al. Lewy bodies contain altered alpha-synuclein in brains of many familial Alzheimer’s disease patients with mutations in presenilin and amyloid precursor protein genes. Am. J. Pathol. 1998, 153, 1365–1370.
- Lippa, C.F.; Schmidt, M.L.; Lee, V.M.; Trojanowski, J.Q. Alpha-synuclein in familial Alzheimer disease: Epitope mapping parallels dementia with Lewy bodies and Parkinson disease. Arch. Neurol. 2001, 58, 1817–1820.
- Mathys, H.; Davila-Velderrain, J.; Peng, Z.; Gao, F.; Mohammadi, S.; Young, J.Z.; Menon, M.; He, L.; Abdurrob, F.; Jiang, X.; et al. Single-cell transcriptomic analysis of Alzheimer’s disease. Nature 2019, 570, 332–337.
- Leng, K.; Li, E.; Eser, R.; Piergies, A.; Sit, R.; Tan, M.; Neff, N.; Li, S.H.; Rodriguez, R.D.; Suemoto, C.K.; et al. Molecular characterization of selectively vulnerable neurons in Alzheimer’s disease. Nat. Neurosci. 2021, 24, 276–287.
- Nakagawa, Y.; O’Leary, D.D. Dynamic patterned expression of orphan nuclear receptor genes RORalpha and RORbeta in developing mouse forebrain. Dev. Neurosci. 2003, 25, 234–244.
- Jabaudon, D.; Shnider, S.J.; Tischfield, D.J.; Galazo, M.J.; Macklis, J.D. RORbeta induces barrel-like neuronal clusters in the developing neocortex. Cereb. Cortex 2012, 22, 996–1006.
- Oishi, K.; Aramaki, M.; Nakajima, K. Mutually repressive interaction between Brn1/2 and Rorb contributes to the establishment of neocortical layer 2/3 and layer 4. Proc. Natl. Acad. Sci. USA 2016, 113, 3371–3376.
More
Information
Subjects:
Biology
Contributors
MDPI registered users' name will be linked to their SciProfiles pages. To register with us, please refer to https://encyclopedia.pub/register
:
View Times:
789
Revisions:
2 times
(View History)
Update Date:
23 Feb 2024
Table of Contents


Notice
You are not a member of the advisory board for this topic. If you want to update advisory board member profile, please contact office@encyclopedia.pub.
OK
Confirm
Only members of the Encyclopedia advisory board for this topic are allowed to note entries. Would you like to become an advisory board member of the Encyclopedia?
Yes
No
${ textCharacter }/${ maxCharacter }
Submit
Cancel
Back
Comments
${ item }
|
${ item.createdUser.fullName }
${ item.createdAt }
${ item.vote }
${ item.reply }
Delete
${ reply.createdUser.fullName }
${ reply.createdAt }
${ reply.vote }
Delete
There is no reply to this comment~
${ item.replyTextCharacter }/${ item.replyMaxCharacter }
Submit
Cancel
More
No more~
There is no comment~
${ textCharacter }/${ maxCharacter }
Submit
Cancel
${ selectedItem.replyTextCharacter }/${ selectedItem.replyMaxCharacter }
Submit
Cancel
Confirm
Are you sure to Delete?
Yes
No