Your browser does not fully support modern features. Please upgrade for a smoother experience.
Submitted Successfully!
 +1 credit
Thank you for your contribution! You can also upload a video entry or images related to this topic.
For video creation, please contact our Academic Video Service.
| Version | Summary | Created by | Modification | Content Size | Created at | Operation |
|---|---|---|---|---|---|---|
| 1 | Paulo Carteri Coradi | -- | 2025 | 2024-02-19 12:52:16 | | | |
| 2 | Wendy Huang | Meta information modification | 2025 | 2024-02-20 03:02:52 | | |
Video Upload Options
We provide professional Academic Video Service to translate complex research into visually appealing presentations. Would you like to try it?
Cite
If you have any further questions, please contact Encyclopedia Editorial Office.
Rodrigues, D.M.; Coradi, P.C.; Timm, N.D.S.; Fornari, M.; Grellmann, P.; Amado, T.J.C.; Teodoro, P.E.; Teodoro, L.P.R.; Baio, F.H.R.; Chiomento, J.L.T. Remote Sensing Applied on the Agriculture. Encyclopedia. Available online: https://encyclopedia.pub/entry/55171 (accessed on 28 July 2026).
Rodrigues DM, Coradi PC, Timm NDS, Fornari M, Grellmann P, Amado TJC, et al. Remote Sensing Applied on the Agriculture. Encyclopedia. Available at: https://encyclopedia.pub/entry/55171. Accessed July 28, 2026.
Rodrigues, Dágila Melo, Paulo Carteri Coradi, Newiton Da Silva Timm, Michele Fornari, Paulo Grellmann, Telmo Jorge Carneiro Amado, Paulo Eduardo Teodoro, Larissa Pereira Ribeiro Teodoro, Fábio Henrique Rojo Baio, José Luís Trevizan Chiomento. "Remote Sensing Applied on the Agriculture" Encyclopedia, https://encyclopedia.pub/entry/55171 (accessed July 28, 2026).
Rodrigues, D.M., Coradi, P.C., Timm, N.D.S., Fornari, M., Grellmann, P., Amado, T.J.C., Teodoro, P.E., Teodoro, L.P.R., Baio, F.H.R., & Chiomento, J.L.T. (2024, February 19). Remote Sensing Applied on the Agriculture. In Encyclopedia. https://encyclopedia.pub/entry/55171
Rodrigues, Dágila Melo, et al. "Remote Sensing Applied on the Agriculture." Encyclopedia. Web. 19 February, 2024.
Copy Citation
Agricultural remote sensing technology has made great progress. The availability of sensors capable of detecting electromagnetic energy and/or heat emitted by targets improves the pre-harvest process and therefore becomes an indispensable tool in the post-harvest phase. The use of sensors in the field and post-harvest processes allows for accurate real-time monitoring of operations and grain quality, enabling decision-making supported by computer tools such as the Internet of Things (IoT) and artificial intelligence algorithms. This way, grain producers can get ahead, track and reduce losses, and maintain grain quality from field to consumer.
agriculture
remote sensing
sensors
vegetation
advantages
disadvantages
1. Introduction
As the world’s population increases, there is a need to increase food production, which poses a challenge to society [1]. Increased food production must be achieved through sustainable management of the entire production system [2]. Agricultural intensification is necessary due to limited production areas. To achieve this, new technologies and management practices must be introduced in agriculture to reduce the side effects of increased use of fertilizers, pesticides, and other inputs.
Advances in data collection and processing technologies have been successfully used around the world to support decision-making in various agricultural processes. These advancements include harvest sensors, which are capable of estimating grain yields before harvest [3][4][5], weed occurrence, weed nutritional status [6], plants [7], top-dressing nitrogen [8], water stress [9], and grain protein content [10][11]. Such applications help improve grain yield, quality and input use efficiency as well as reduce nutrient losses and negative environmental impacts [12][13].
After harvest, storage capacity must be 20% higher than yield to avoid product losses and improve logistics and quality [14]. However, in some countries, in addition to poor quality control of grains stored in structures, there is also the problem of insufficient storage capacity, especially in terms of crucial factors such as grain moisture content and the temperature and relative humidity of intergranular air, which are necessary for food preservation.
Using sensors and Internet of Things (IoT) applications, grain quality can be monitored and predicted throughout the grain storage period. Therefore, precision agriculture tools such as remote sensing can help monitor pre- and post-harvest processes by leveraging a range of advanced information, communication, analysis, and data processing technologies such as big data analytics, digital platforms, processing clouds, and artificial intelligence. These technologies allow for the extraction of a wealth of information about data collected during decision-making [15][16].
2. Remote Sensing Techniques, Applications, and Sensors
Figure 1 and Table 1 presents a summary of remote sensing techniques available, their characteristics, applications, and sensor types.
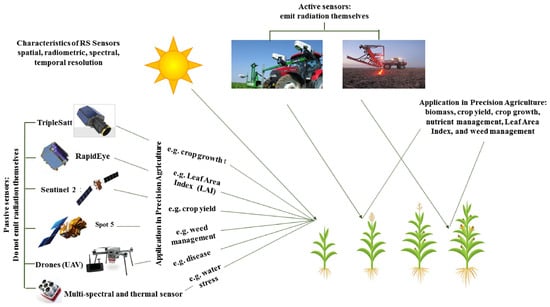
Figure 1. Remote sensing techniques, their characteristics, applications, and sensors.
Table 1. Spatiotemporal resolutions of satellite sensors with high resolution (<30 m) and temporal sensors used for precision agriculture.
| Satellite (Active Years) | Sensor (Spatial Resolution) | Temporal Resolution (Days) | Precision Agriculture Application | References |
|---|---|---|---|---|
| Kompsat-3A (2015–current) | MS V NIR (2.2 m); SWIR (5.5 m) | 1.4 | Disease detection and phenotyping | Bajwa et al. [17] and Zhang et al. [18] |
| Wordview-3 (2014–current) | SS (1.24 m) | <1 | Weed management and crop residues mapping | Caturegli et al. [19] and Hively et al. [20] |
| RapidEye (2008–current) | MS (6.5 m) | 1–5.5 | Weed control, estimation of leaf area index, estimation of forest area, and biomass | Dong et al. [3], Halperin et al. [21], and Coffer et al. [22] |
| GeoEye-1 (2008–current) | MS (1.65 m) | 2.1–8.3 | Management of nutrients and canopy mortality caused by insects | Dennison et al. [19] and Caturegli et al. [23] |
| Lidar (1995) | VIS (10 cm) | N/A | Mapping of leaf mass variation | Chlus et al. [24] |
| Spot-1 (1986–1990)—Spot-2 (1990–2009)—Spot-5 (2002) | MS (20 m); MS (2.5–10 m) | 1–2.6 | Mapping of environmental indicators, Mapping of weeds, and Monitoring of agricultural practices | Pasqualini et al. [25], Hajj at al. [26], and Johansen et al. [27] |
| Sentinel-1 (2014–current)—Sentinel-2 (2015–current) | SAR (5–40 m)—MS (10 m); NIR (20 m); SWIR (60 m) | 1–3 | Phenology, Effect of lodging on wheat, Detection of abiotic and biotic stress, and Estimated productivity | Segarra et al. [5], Gómez el al. [28], Chauhan et al. [29], and Meroni et al. [30] |
Crop biomass and grain yield forecast usually require higher spatial resolution (1–3 m) compared, for example, with the application for variable fertilizer and seed rate technology [31]. Besides, weed mapping and variable herbicide rate technology require higher spatial resolution than identifying only the ridges (for example, 5–50 cm) [32]. Aerial platforms, such as UAVs (Unmanned Aerial Vehicles), provide images with a higher spatial resolution (<3 m) compared to satellites. Thus, UAVs offer better flexibility in providing images with higher spatial and temporal resolution according to the target to be sensed. Xie et al. [33] assessed the classification and crop monitoring over an agricultural area with corn, soybean, and winter wheat from multi-year polarimetric observables from RADARSAT-2 using machine learning. The researchers found that multitemporal polarimetric synthetic aperture radar (PolSAR) can estimate plant growth with a root mean squared error (RMSE) around 40–50 cm over the cycle. Random Forest (RF) approach proved to be more accurate in crop classification. Cheng et al. [34], when assessing multispectral information to predict winter wheat yield, found contrasts between the multi and hiperspectral approaches. On the other hand, the predictions achieved using hyperspectral information was more accurate. These findings highlight the potential of the shortwave infrared groups to supplant the unmistakable and close infrared groups in yield predictions.
3. Vegetation Sensors in Agriculture and Applications
Figure 2 presents a summary of the application of crop sensors.
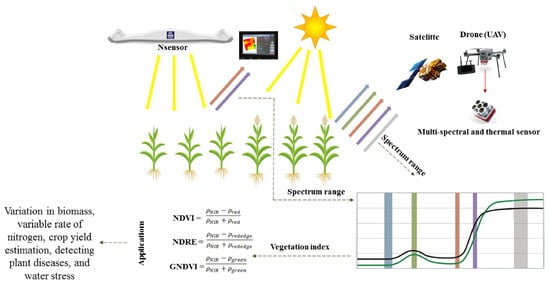
Figure 2. Application of vegetation sensors in agriculture.
The most advantage of red edge vegetation indices is that they are less affected by plant canopy structures. Hence, they are more promising for the development of models for assessing leaf range record and grain efficiency. Eitel et al. [35] found that the use of the red edge improved the ability to estimate changes in chlorophyll content (r2 > 0.73, RMSE < 1.69) compared to devices that did not use (r2 = 0.57, RMSE = 2.11). Vegetation indices based on the red edge such as Red Edge Normalized Difference Vegetation Index (RENDVI), Normalized Difference Vegetation Index (NDRE), and Red Edge Difference Vegetation Index (REDVI) frequently have a better relationship with plant nutrients uptake and biomass production under dense canopy conditions than NDVI, such as those present during the advance corn growth stages [36].
The measurement of reflectance or emissivity in the near and medium infrared bands is particularly useful in the development of indices that help to understand intrinsic characteristics of the plant, such as water, pigments, sugar, carbohydrates, and protein content. The radiation reflected or emitted in thermal infrared bands is related to the temperature of the plant and this with the rate of transpiration of the plant. Thus, the indices obtained from these thermal reflectance data can be used to understand the level of the plant’s water stress and other biotic stresses, such as diseases [37][38]. In this context, vegetation indices based on infrared reflectance, and thermal emissions, such as crop water stress index (CWSI) and short-wave infrared water stress index (SIWSI) are particularly useful. These indices have been successfully used for a broad range of objectives in agriculture including plant stress due to excess or water deficit, soil moisture, plant diseases, and crop yield forecast [39].
The early season assessment of crop yield at regional, State, and National scales is key information for agricultural planning and public policy. The applications of this information in post-harvest are growing allowing redesign of the whole organization strategy for the flow of the production, from the crops to the food processing and production industries decreasing loss and keeping the quality. However, the crop yield forecast in many countries is based on conventional data collection procedures through plot scale or human perception [38][39][40][41]. These techniques are often subjective, expensive, time-consuming, and are subject to bias due to incomplete or wrong observations, leading to an inaccurate assessment of crop yield [42].
The accurate evaluation of the crop performance on large scale has been becoming a reality after the progress in remote sensing technology by modern satellites and UAV-coupled sensors. The approaches based on remote sensing by satellite or UAV provide repeated measurements at different spatial, temporal, and spectral scales that allow estimating various canopy parameters, such as vegetation cover, leaf area index, and absorbed fraction of photo-synthetically active radiation, which can be used in crop yield models [43].
According to Peng et al. [44], the remote sensing crop yield forecast is carried out in two ways. The first approach uses biophysical parameters of vegetation as a leaf area index (LAI) obtained by remote detection and the data is used in specific models to estimate crop yield. The second process uses statistical relationships such as regression or empirical relationships between parameters and harvest indices derived from remote sensors (such as NDVI and NDRE vegetation index), in addition to the harvest yield observed in a cultivated area. Maresma et al. [45] presented a regression-based approach to assess the relationship between corn yield, biomass, and spectral indices measured at corn crop stage V12. Related to other studies, they also found that red NDVI-based indices and the wide dynamic range vegetation index (WDRVI) had a higher correlation with grain yields obtained in a range of fertilizer rate input. Kumar et al. [46] correlated the NDVI values of different satellites to estimate the crop yield in wheat and found coefficients of determination above 0.90. Rao et al. [47] evaluated the Normalized Difference Vegetation Index (NDVI) to estimate sugarcane yield and reported a strong relationship between yield and NDVI (R = 0.84). Alongside, Rahman and Robson, Rahman and Robson [48] reported that the green normalized difference vegetation index (GNDVI) derived from the Landsat 30 m resolution had a significant correlation (R2 = 0.69) with crop yield. Ali and Imran [48] used the red edge extracted from hyperspectral images to predict the leaf area index (R2 = 0.93) and the chlorophyll content (R2 = 0.90) to estimate yield (R2 = 0.91) of Kinnow tangerines.
Reliable estimate of crop yield based on the canopy reflectance throughout the different growth stages can be a challenging task, especially during the initial stages of crop growth due to the interference of the bare soil surface [49]. To overcome this limitation, Zhen et al. [50] used other vegetation indices modified to minimize the soil interference in the estimative of leaf area index (LAI) and, consequently, crop yield. Recently, vegetation indices based on red-edge have shown satisfactory efficiency for estimating the yield of different crops.
4. Advantages and Disadvantages of the Remote Sensing
The advantage of remote sensing as a whole, compared to other conventional data collection methodologies, is the fast and non-destructive sample collection. For example, it is possible to have information on several variables, such as nitrogen content, plant mass, disease severity, among others. At the satellite orbital level, the advantages are even greater, as it makes it possible to sample large and larger areas with repeatability depending on the time span in which the satellite is visited, that is, every so often the satellite images the area, enabling a high sampling rate at a lower cost and time when compared to traditional sampling in the field, even in conditions where there is a need to pay for the satellite.
The disadvantages of sampling via an orbital satellite sensor are that it is collected when clouds are present at certain periods of the year, depending on the region, making sampling and sample quality unfeasible. Another disadvantage is obtaining images via free satellites, for example Landsat and Sentinel. It is worth noting that the aim is always to collect images with the highest spatial resolution, with the greatest possible number of pixels, to achieve the desirable detail of the target for analysis. This is especially important for smaller areas and objects, such as fruit plots or cities. However, it makes no difference for larger areas where target detailing is not the main objective. Image collection via drone is an alternative to the disadvantages mentioned above, as it is possible to fly below the clouds without their interference in image collection. On the other hand, the main disadvantage of using a drone is the high initial cost and the need for training to operate the drone and process images. Even so, drones make it possible to collect samples with the possibility of repeating them daily or on different days.
Among the main advantages of using vegetation indices are the future diagnosis of elements that do not yet have scientific support, for example, a plant attacked by insect pests that ends up changing its physiology, which could probably be detected by some spectral response, mainly by hyperspectral sensors, being an area still new and very little studied. There is still a large scope for development in the application of sensors.
References
- FAO. The Future of Food and Agriculture—Trends and Challenges; Food and Agriculture Organization of the United Nations: Rome, Italy, 2019.
- Gomiero, T.; Pimentel, D.; Paoletti, M.G. Environmental impact of different agricultural management practices: Conventional vs. Organic agriculture. Crit. Rev. Plant Sci. 2011, 30, 95–124.
- Dong, T.; Liu, J.; Shang, J.; Qian, B.; Ma, B.; Kovacs, J.M.; Walters, D.; Jiao, X.; Geng, X.; Shi, Y. Assessment of red edge vegetation indices for crop leaf area index estimation. Remote Sens. Environ. 2019, 222, 133–143.
- Schwalbert, R.A.; Amado, T.; Corassa, G.; Pott, L.P.; Prasad, P.V.V.; Ciampitti, I.A. Satellite-based soybean yield forecast: Integrating machine learning and weather data for improving crop yield prediction in southern Brazil. Agric. For. Meteorol. 2020, 284, 107886.
- Segarra, J.; Buchaillot, M.L.; Araus, J.L.; Kefauver, S.C. Sensor remoto para agricultura de precisão: Recursos e aplicativos aprimorados do Sentinel-2. Agron. J. 2020, 10, 641.
- Pott, L.P.; Amado, T.J.C.; Schwalbert, R.A.; Sebem, E.; Jugulam, M.; Ciampitti, I.A. Pre-planting weed detection based on ground field spectral data. Pest. Manag. Sci. 2019, 76, 1173–1182.
- Hunt, E.R.; Daughtry, C.S.T. What good are unmanned aircraft systems for agricultural remote sensing and precision agriculture? Intern. J. Remote Sens. 2018, 39, 5345–5376.
- Schwalbert, R.A.; Amado, T.; Reimche, G.B.; Gebert, F. Fine-tuning of wheat (Triticum aestivum L.) variable nitrogen rate by combining crop sensing and management zones approaches in southern Brazil. Prec. Agric. 2019, 20, 56–77.
- Vanino, S.; Nino, P.; De Michele, C.; Falanga Bolognesi, S.; D’Urso, G.; Di Bene, C.; Pennelli, B.; Vuolo, F.; Farina, R.; Pulighe, G. Capability of Sentinel-2 data for estimating maximum evapotranspiration and irrigation requirements for tomato crop in Central Italy. Remote Sens. Environ. 2018, 215, 452–470.
- Aranguren, M.; Castellón, A.; Aizpurua, A. Crop Sensor Based Non-destructive Estimation of Nitrogen Nutritional Status, Yield, and Grain Protein Content in Wheat. Agriculture 2020, 10, 148.
- Zhou, X.; Kono, Y.; Win, A.; Matsui, T.; Tanaka, S.T.T. Predicting within-field variability in grain yield and protein content of winter wheat using UAV-based multispectral imagery and machine learning approaches. Plant Prod. Sci. 2020, 24, 137–151.
- Bongiovanni, R.; Lowenberg-DeBoer, J. Precision agriculture and sustainability. Precis. Agric. 2004, 5, 359–387.
- Aubert, B.A.; Schroeder, A.; Grimaudo, J. IT as enabler of sustainable farming: An empirical analysis of farmers adoption decision of precision agriculture technology. Decis. Support. Syst. 2012, 54, 510–520.
- Duysak, H.; Yigit, E. Machine learning based quantity measurement method for grain silos. Measurement 2020, 152, 107279.
- Berry, J.K.; Delgado, J.A.; Khosla, R.; Pierce, F.J. Precision conservation for environmental sustainability. J. Soil. Water Conserv. 2013, 58, 332–339. Available online: https://www.jswconline.org/content/58/6/332 (accessed on 1 January 2024).
- Delgado, J.; Short, N.M.; Roberts, D.P.; Vandenberg, B. Big data analysis for sustainable agriculture. Front. Sustain. Food Syst. 2019, 3, 54.
- Bajwa, S.G.; Rupe, J.C.; Mason, J. Soybean disease monitoring with leaf reflectance. Remote Sens. 2017, 9, 127.
- Zhang, C.; Marzougui, A.; Sankaran, S. High-resolution satellite imagery applications in crop phenotyping: An overview. Comput. Electron. Agric. 2020, 175, 105584.
- Caturegli, L.; Casucci, M.; Lulli, F.; Grossi, N.; Gaetani, M.; Magni, S.; Bonari, E.; Volterrani, M. GeoEye-1 satellite versus ground-based multispectral data for estimating nitrogen status of turf grasses. Intern. J. Remote Sens. 2015, 36, 2238–2251.
- Hively, W.D.; Lamb, B.T.; Daughtry, C.S.T.; Shermeyer, J.; McCarty, G.W.; Quemada, M. Mapping crop residue and tillage intensity using world view—3 satellite shortwave infrared residue indices. Remote Sens. 2018, 10, 1657.
- Halperin, J.; LeMay, V.; Coops, N.; Verchot, L.; Marshall, P.; Lochhead, K. Canopy cover estimation in miombo woodlands of Zambia: Comparison of Landsat 8 OLI versus Rapid Eye imagery using parametric, nonparametric, and semi parametric methods. Remote Sens. Environ. 2016, 179, 170–182.
- Mahlein, A.K. Plant disease detection by imaging sensors–parallels and specific demands for precision agriculture and plant phenotyping. Plant Dis. J. 2016, 100, 241–251.
- Coffer, M.M.; Schaeffer, A.B.; Zimmerman, C.R.; Hill, V.; Li, J.; Islam, K.A.; Whitman, J.P. Performance across WorldView-2 and Rapid Eye for reproducible sea grass mapping. Remote Sens. Environ. 2020, 250, 112036.
- Dennison, P.E.; Brunelle, A.R.; Carter, V.A. Assessing canopy mortality during a mountain pine beetle outbreak using GeoEye-1 high spatial resolution satellite data. Remote Sens. Environ. 2010, 114, 2431–2435.
- Chlus, A.; Kruger, E.L.; Townsend, P.A. Mapping three-dimensional variation in leaf mass per area with imaging spectroscopy and lidar in a temperate broadleaf forest. Remote Sens. Environ. 2020, 250, 112043.
- Pasqualini, V.; Pergent-Martini, C.; Pergent, G.; Agreil, M.; Skoufas, G.; Sourbes, L.; Tsirika, A. Use of SPOT 5 for mapping seagrasses: An application to Posidonia oceanica. Remote Sens. Environ. 2005, 94, 39–45.
- Hajj, M.E.; Bégué, A.; Guillaume, S.; Martiné, J.F. Integrating SPOT-5 time series, crop growth modeling and expert knowledge for monitoring agricultural practices—The case of sugarcane harvest on Reunion Island. Remote Sens. Environ. 2019, 10, 2052–2061.
- Johansen, K.; Phinn, S.; Witte, C. Mapping of riparian zone attributes using discrete return LiDAR, quick bird and SPOT-5 imagery: Assessing accuracy and costs. Remote Sens. Environ. 2010, 114, 2679–2691.
- Gómez, D.; Salvador, P.; Sanz, J.; Casanova, J.L. Potato yield prediction using Machine Learning Techniques and sentinel 2 data. Remote Sens. 2019, 11, 1745.
- Chauhan, S.; Darvishzadeh, R.; Lu, Y.; Boschetti, M.; Nelson, A. Understanding wheat lodging using multi-temporal Sentinel-1 and Sentinel-2 data. Remote Sens. Environ. 2020, 243, 111804.
- Meroni, M.; D’Andrimont, R.; Vrieling, A.; Fasbender, D.; Lemoine, G.; Rembold, F.; Seguini, L.; Verhegghen, A. Comparing land surface phenology of major European crops as derived from SAR and multispectral data of Sentinel-1 and -2. Remote Sens. Environ. 2021, 253, 112232.
- Mulla, D.J. Twenty-five years of remote sensing in precision agriculture: Key advances and remaining knowledge gaps. Biosyst. Eng. 2013, 114, 358–371.
- Castaldi, F.F.; Pelosi, F.; Pascucci, S.; Casa, R. Assessing the potential of images from unmanned aerial vehicles (UAV) to support herbicide patch spraying in maize. Precision Agric. 2017, 18, 76–94.
- Xie, Q.; Lai, K.; Wang, J.; Lopez-Sanchez, J.M.; Shang, J.; Liao, C.; Peng, X. Crop monitoring and classification using polarimetric RADARSAT-2 time-series data across growing season: A case study in southwestern Ontario, Canada. Remote Sens. 2021, 13, 1394.
- Fensholt, A.; Sandholt, I. Derivation of a shortwave infrared water stress index from MODIS near- and shortwave infrared data in a semiarid environment. Remote Sens. Environ. 2003, 87, 111–121.
- Eitel, J.U.; Keefe, R.F.; Long, D.S.; Davis, A.S.; Vierling, L.A. Active ground optical remote sensing for improved monitoring of seedling stress in nurseries. Sensors 2010, 10, 2843–2850.
- Li, F.; Miao, Y.; Feng, G.; Yuan, F.; Yue, S.; Gao, X.; Liu, Y.; Liu, B.; Ustin, S.L.; Chen, X. Improving estimation of summer maize nitrogen status with red edge-based spectral vegetation indices. Fields Crops Res. 2014, 157, 111–123.
- Prashar, A.; Jones, H.G. Assessing Drought Responses Using Thermal Infrared Imaging. In Environmental Responses in Plants; Duque, P., Ed.; Methods in Molecular Biology; Humana Press: New York, NY, USA, 2016.
- Khanal, S.; Fulton, J.; Shearer, S. An overview of current and potential applications of thermal remote sensing in precision agriculture. Comput. Electron. Agric. 2017, 139, 22–32.
- Filippi, P.; Jones, E.J.; Wimalathunge, N.S.; Somarathna, P.D.S.N.; Pozza, L.E.; Ugbaje, S.U.; Jephcott, T.G.; Paterson, S.E.; Whelan, B.M.; Bishop, T.F.A. An approach to forecast grain crop yield using multi-layered, multi-farm data sets and machine learning. Precis. Agric. 2019, 20, 1015–1029.
- Kogan, F. Vegetation health for insuring drought-related yield losses and food security enhancement. In Remote Sensing for Food Security; Kogan, F., Ed.; Springer International Publishing: Cham, Switzerland, 2019; pp. 163–173.
- Kogan, F.; Guo, W.; Yang, W. Drought and food security prediction from NOAA new generation of operational satellites. Geomat. Nat. Hazards 2019, 10, 651–666.
- Lobell, D.B. The use of satellite data for crop yield gap analysis. Fields Crops Res. 2013, 143, 56–64.
- Calera, A.; Campos, I.; Osann, A.; D’Urso, G.; Menenti, M. Remote sensing for crop water management: From ET modelling to services for the end users. Sensors 2017, 17, 1104.
- Dubey, S.K.; Gavli, A.S.; Yadav, S.K.; Sehgal, S.; Ray, S.S. Remote Sensing-Based Yield Forecasting for Sugarcane (Saccharum officinarum L.) crop in India. J. Indian. Soc. Remote Sens. 2018, 46, 1823–1833.
- Maresma, Á.; Ariza, M.; Martínez, E.; Lloveras, J.; Martínez-Casasnovas, J.A. Analysis of vegetation índices to determine nitrogen application and yield prediction in maize (Zea mays L.) from a standard UAV service. Remote Sens. 2016, 8, 973.
- Kumar, S.; Saxena, S.; Dubey, S.K.; Chaudhary, K.; Sehgal, S.; Ray, S.S. Analysis of wheat crop forecasts, in India, generated using remote sensing data, under fasal project. Int. Arch. Photogramm. Remote Sens. Spat. Inf. Sci. 2019, 42, 223–228.
- Rao, P.V.K.; Rao, V.V.; Venkataratnam, L. Remote sensing: A technology for assessment of sugarcane crop acreage and yield. Sugar Tech. 2022, 4, 97–101.
- Rahman, M.M.; Robson, A. A novel approach for sugarcane yield prediction using Landsat time series imagery: A case study on Bundaberg region. Adv. Remote Sens. 2016, 5, 93–102.
- Ali, A.; Imran, M.M. Evaluating the potential of red edge position (REP) of hyperspectral remote sensing data for real time estimation of LAI & chlorophyll content of kinnow mandarin (Citrus reticulata) fruit orchards. Sci. Hortic. 2020, 267, 109326.
More
Information
Subjects:
Agronomy
Contributors
MDPI registered users' name will be linked to their SciProfiles pages. To register with us, please refer to https://encyclopedia.pub/register
:
View Times:
1.3K
Revisions:
2 times
(View History)
Update Date:
20 Feb 2024
Table of Contents


Notice
You are not a member of the advisory board for this topic. If you want to update advisory board member profile, please contact office@encyclopedia.pub.
OK
Confirm
Only members of the Encyclopedia advisory board for this topic are allowed to note entries. Would you like to become an advisory board member of the Encyclopedia?
Yes
No
${ textCharacter }/${ maxCharacter }
Submit
Cancel
Back
Comments
${ item }
|
${ item.createdUser.fullName }
${ item.createdAt }
${ item.vote }
${ item.reply }
Delete
${ reply.createdUser.fullName }
${ reply.createdAt }
${ reply.vote }
Delete
There is no reply to this comment~
${ item.replyTextCharacter }/${ item.replyMaxCharacter }
Submit
Cancel
More
No more~
There is no comment~
${ textCharacter }/${ maxCharacter }
Submit
Cancel
${ selectedItem.replyTextCharacter }/${ selectedItem.replyMaxCharacter }
Submit
Cancel
Confirm
Are you sure to Delete?
Yes
No