The most advantage of red edge vegetation indices is that they are less affected by plant canopy structures. Hence, they are more promising for the development of models for assessing leaf range record and grain efficiency. Eitel et al. [
50] found that the use of the red edge improved the ability to estimate changes in chlorophyll content (r
2 > 0.73, RMSE < 1.69) compared to devices that did not use (r
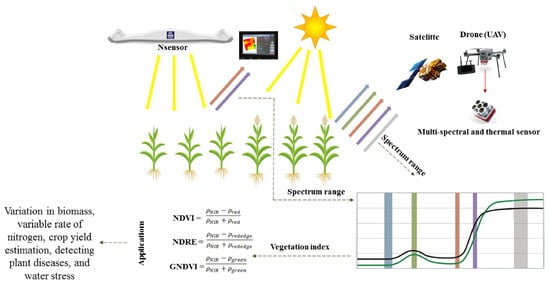
2 = 0.57, RMSE = 2.11). Vegetation indices based on the red edge such as Red Edge Normalized Difference Vegetation Index (RENDVI), Normalized Difference Vegetation Index (NDRE), and Red Edge Difference Vegetation Index (REDVI) frequently have a better relationship with plant nutrients uptake and biomass production under dense canopy conditions than NDVI, such as those present during the advance corn growth stages [
51].
The measurement of reflectance or emissivity in the near and medium infrared bands is particularly useful in the development of indices that help to understand intrinsic characteristics of the plant, such as water, pigments, sugar, carbohydrates, and protein content. The radiation reflected or emitted in thermal infrared bands is related to the temperature of the plant and this with the rate of transpiration of the plant. Thus, the indices obtained from these thermal reflectance data can be used to understand the level of the plant’s water stress and other biotic stresses, such as diseases [
52,
53]. In this context, vegetation indices based on infrared reflectance, and thermal emissions, such as crop water stress index (CWSI) and short-wave infrared water stress index (SIWSI) are particularly useful. These indices have been successfully used for a broad range of objectives in agriculture including plant stress due to excess or water deficit, soil moisture, plant diseases, and crop yield forecast [
54].
The early season assessment of crop yield at regional, State, and National scales is key information for agricultural planning and public policy. The applications of this information in post-harvest are growing allowing redesign of the whole organization strategy for the flow of the production, from the crops to the food processing and production industries decreasing loss and keeping the quality. However, the crop yield forecast in many countries is based on conventional data collection procedures through plot scale or human perception [
53,
54,
55,
56]. These techniques are often subjective, expensive, time-consuming, and are subject to bias due to incomplete or wrong observations, leading to an inaccurate assessment of crop yield [
57].
The accurate evaluation of the crop performance on large scale has been becoming a reality after the progress in remote sensing technology by modern satellites and UAV-coupled sensors. The approaches based on remote sensing by satellite or UAV provide repeated measurements at different spatial, temporal, and spectral scales that allow estimating various canopy parameters, such as vegetation cover, leaf area index, and absorbed fraction of photo-synthetically active radiation, which can be used in crop yield models [
58].
According to Peng et al. [
40], the remote sensing crop yield forecast is carried out in two ways. The first approach uses biophysical parameters of vegetation as a leaf area index (LAI) obtained by remote detection and the data is used in specific models to estimate crop yield. The second process uses statistical relationships such as regression or empirical relationships between parameters and harvest indices derived from remote sensors (such as NDVI and NDRE vegetation index), in addition to the harvest yield observed in a cultivated area. Maresma et al. [
59] presented a regression-based approach to assess the relationship between corn yield, biomass, and spectral indices measured at corn crop stage V12. Related to other studies, they also found that red NDVI-based indices and the wide dynamic range vegetation index (WDRVI) had a higher correlation with grain yields obtained in a range of fertilizer rate input. Kumar et al. [
60] correlated the NDVI values of different satellites to estimate the crop yield in wheat and found coefficients of determination above 0.90. Rao et al. [
61] evaluated the Normalized Difference Vegetation Index (NDVI) to estimate sugarcane yield and reported a strong relationship between yield and NDVI (R = 0.84). Alongside, Rahman and Robson, Rahman and Robson [
62] reported that the green normalized difference vegetation index (GNDVI) derived from the Landsat 30 m resolution had a significant correlation (R
2 = 0.69) with crop yield. Ali and Imran [
62] used the red edge extracted from hyperspectral images to predict the leaf area index (R
2 = 0.93) and the chlorophyll content (R
2 = 0.90) to estimate yield (R
2 = 0.91) of Kinnow tangerines.
Reliable estimate of crop yield based on the canopy reflectance throughout the different growth stages can be a challenging task, especially during the initial stages of crop growth due to the interference of the bare soil surface [
63]. To overcome this limitation, Zhen et al. [
64] used other vegetation indices modified to minimize the soil interference in the estimative of leaf area index (LAI) and, consequently, crop yield. Recently, vegetation indices based on red-edge have shown satisfactory efficiency for estimating the yield of different crops.
4. Advantages and Disadvantages of the Remote Sensing
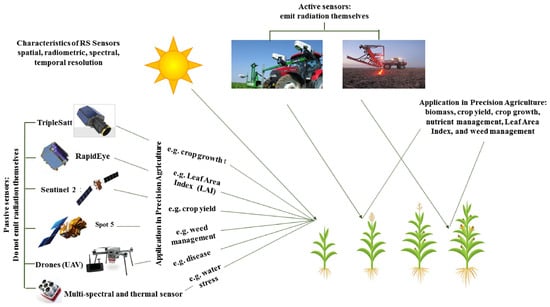
The advantage of remote sensing as a whole, compared to other conventional data collection methodologies, is the fast and non-destructive sample collection. For example, it is possible to have information on several variables, such as nitrogen content, plant mass, disease severity, among others. At the satellite orbital level, the advantages are even greater, as it makes it possible to sample large and larger areas with repeatability depending on the time span in which the satellite is visited, that is, every so often the satellite images the area, enabling a high sampling rate at a lower cost and time when compared to traditional sampling in the field, even in conditions where there is a need to pay for the satellite.
The disadvantages of sampling via an orbital satellite sensor are that it is collected when clouds are present at certain periods of the year, depending on the region, making sampling and sample quality unfeasible. Another disadvantage is obtaining images via free satellites, for example Landsat and Sentinel. It is worth noting that the aim is always to collect images with the highest spatial resolution, with the greatest possible number of pixels, to achieve the desirable detail of the target for analysis. This is especially important for smaller areas and objects, such as fruit plots or cities. However, it makes no difference for larger areas where target detailing is not the main objective. Image collection via drone is an alternative to the disadvantages mentioned above, as it is possible to fly below the clouds without their interference in image collection. On the other hand, the main disadvantage of using a drone is the high initial cost and the need for training to operate the drone and process images. Even so, drones make it possible to collect samples with the possibility of repeating them daily or on different days.
Among the main advantages of using vegetation indices are the future diagnosis of elements that do not yet have scientific support, for example, a plant attacked by insect pests that ends up changing its physiology, which could probably be detected by some spectral response, mainly by hyperspectral sensors, being an area still new and very little studied. There is still a large scope for development in the application of sensors.