Your browser does not fully support modern features. Please upgrade for a smoother experience.
Submitted Successfully!
 +1 credit
Thank you for your contribution! You can also upload a video entry or images related to this topic.
For video creation, please contact our Academic Video Service.
| Version | Summary | Created by | Modification | Content Size | Created at | Operation |
|---|---|---|---|---|---|---|
| 1 | Max Nobre Supelnic | -- | 1312 | 2024-01-19 11:11:55 | | | |
| 2 | Rita Xu | Meta information modification | 1312 | 2024-01-24 03:30:46 | | |
Video Upload Options
We provide professional Academic Video Service to translate complex research into visually appealing presentations. Would you like to try it?
Cite
If you have any further questions, please contact Encyclopedia Editorial Office.
Supelnic, M.N.; Ferreira, A.F.; Bota, P.J.; Brás-Rosário, L.; Plácido Da Silva, H. Out-of-the-Lab Photoplethysmography. Encyclopedia. Available online: https://encyclopedia.pub/entry/54119 (accessed on 25 June 2026).
Supelnic MN, Ferreira AF, Bota PJ, Brás-Rosário L, Plácido Da Silva H. Out-of-the-Lab Photoplethysmography. Encyclopedia. Available at: https://encyclopedia.pub/entry/54119. Accessed June 25, 2026.
Supelnic, Max Nobre, Afonso Fortes Ferreira, Patrícia Justo Bota, Luís Brás-Rosário, Hugo Plácido Da Silva. "Out-of-the-Lab Photoplethysmography" Encyclopedia, https://encyclopedia.pub/entry/54119 (accessed June 25, 2026).
Supelnic, M.N., Ferreira, A.F., Bota, P.J., Brás-Rosário, L., & Plácido Da Silva, H. (2024, January 19). Out-of-the-Lab Photoplethysmography. In Encyclopedia. https://encyclopedia.pub/entry/54119
Supelnic, Max Nobre, et al. "Out-of-the-Lab Photoplethysmography." Encyclopedia. Web. 19 January, 2024.
Copy Citation
Photoplethysmography (PPG) is used for heart-rate monitoring in a variety of contexts and applications due to its versatility and simplicity. These applications, namely studies involving PPG data acquisition during day-to-day activities, require reliable and continuous measurements, which are often performed at the index finger or wrist.
photoplethysmography
saturation
wave morphology
1. Introduction
Cardiovascular diseases are the leading cause of death worldwide, with 17.9 million deaths each year [1][2], and there is a high prevalence of chronic cardiovascular disease that is the major cause of hospital admissions. Since chronic patients are ambulatory, there has been a growing interest in wearable devices capable of monitoring cardiovascular parameters on a daily basis [3]. Wearable devices are becoming a part of our daily routines, ranging from smartwatches to fitness trackers or even smart clothes [4][5][6]. Along with the commodities they offer, health monitoring technology has also branched into these devices, with the latest advances allowing for continuous health monitoring outside clinical settings [7]. At the same time, these devices are becoming increasingly accurate, meeting clinical standards [8][9]. Photoplethysmography is a must-have sensor in wearable devices for heart-rate monitoring, due to its simplicity, versatility, and non-invasiveness. Most often, these sensors are used at the fingertips due to their widely spread and shallow vascular bed [10], and, consequently, high signal amplitudes can be obtained [11]. While in an experimental setting these body parts are preferred, for lifestyle activity data collection they are impractical, and also much more susceptible to motion artifacts [8]. A caveat of PPG sensors is their tendency to saturate, which does not provide meaningful clinical information [12][13]. On top of this, when applying common biosignal filtering techniques, saturated portions lead to distorted filtered signal, a ringing effect, which in turn contributes to inaccurate peak detection and extracted features [12][14][15][16]. Consequently, alternative measurement sites need to be explored and validated to ensure that high-quality signals can be obtained. While many different anatomic regions are being used in research to obtain unsaturated data, a systemic analysis of the accuracy and quality of these new signals has not been made. Moreover, health parameters, such as heart rate (HR) and heart-rate variability (HRV), need to be accurately derived.
2. Photoplethysmography
Photoplethysmography is a non-invasive method of measuring blood volume changes in the human body. Incident light with a specific wavelength is used to extract optical properties from the microvascular bed of the skin and modulate the pulsatile blood flow [17].
PPG sensors consist of a photoemitter (PE) and a photodetector (PD). The light emitted from the source is absorbed, scattered, and reflected by the human body’s tissues. The PD’s position dictates whether the PPG is transmissive or reflective, as seen in Figure 1. In both of these types, the blood flow is modulated by the amount of light that is transiently absorbed by the skin. Transmissive PPGs have the PD attached across the body part, acquiring a signal based on the attenuation of the light crossing it. Reflective-type PPGs have the PD positioned side by side with the PE. In this case, the obtained signal comes from the scattering and reflection of the light. Transmissive PPGs are capable of more stable readings than reflective PPGs. However, reflectance mode PPG is more easily implemented, especially in wearable devices, since both the PE and the PD can be integrated in close proximity to each other [10][18].
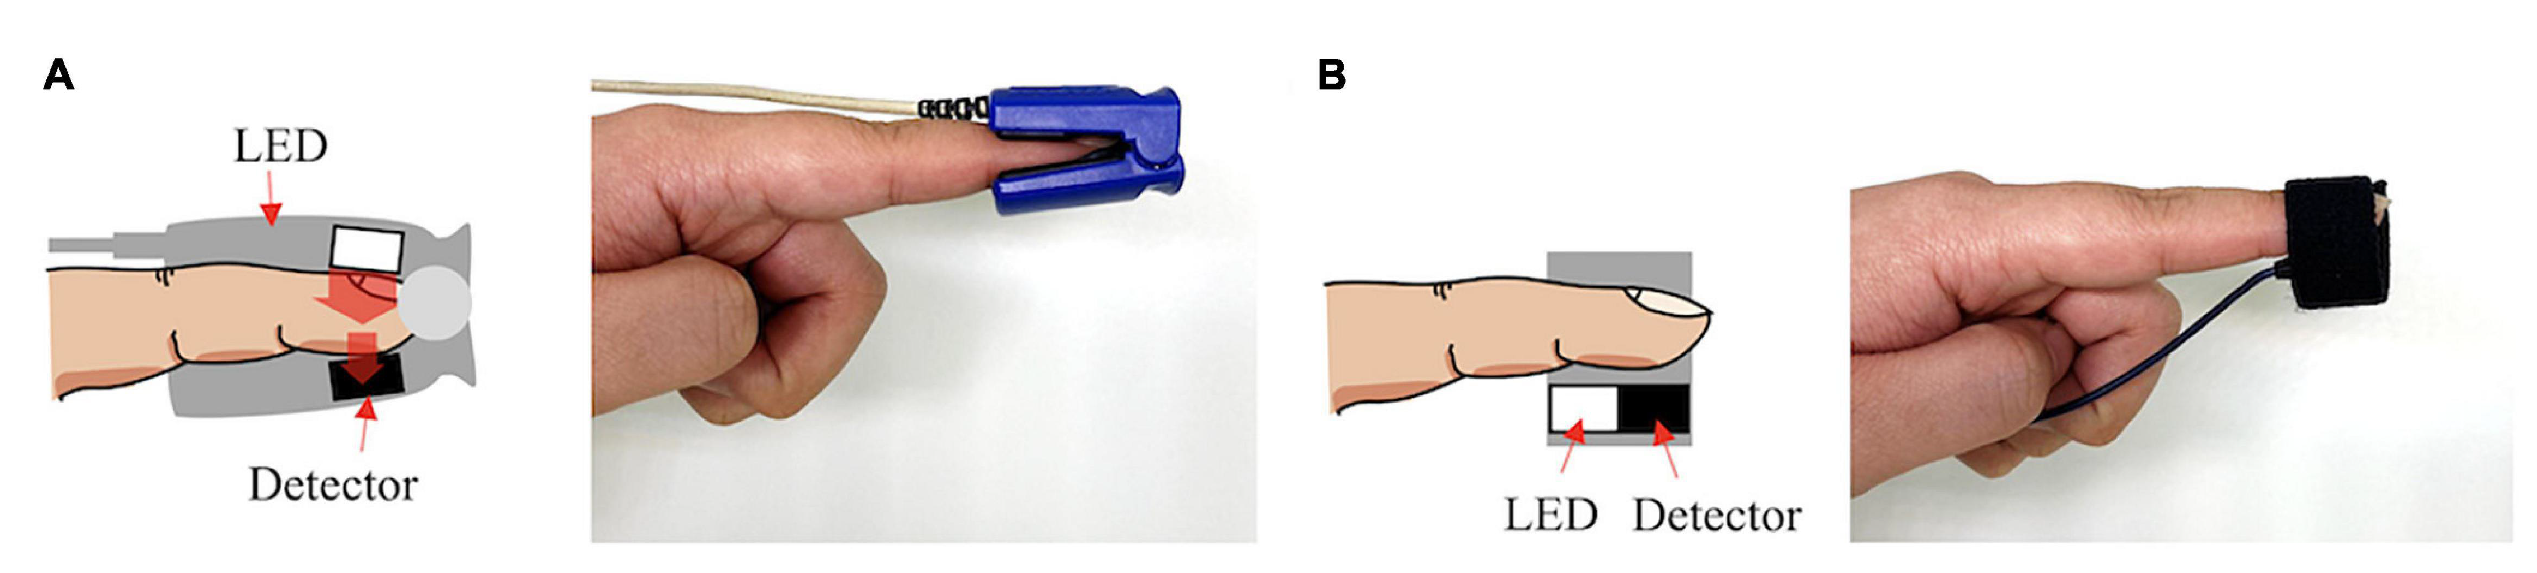
Figure 1. Transmissive PPG on the left (A), reflective PPG on the right (B).
The intensity of the captured light depends on various biological factors, such as tissue opacity of the interposed skin, connective tissue, bone, and also the amount of blood in the capillary vessels. Blood has a higher absorption coefficient than the other bodily components; therefore, variations in blood volume, such as arterial pulsation, account for the measurable cardiac cycle variations observed in the PPG signal [10].
Although different wavelengths have been used for PPG acquisitions, higher wavelengths can reach higher depths of penetration, with the wavelength of 660 nm being able to reach subcutaneous tissues. Red wavelengths, 640–660 nm, and infrared wavelengths, 880–940 nm, are commonly used for PPG readings [19]. Nonetheless, PPG sensors working in these ranges are significantly influenced by heat radiation from human skin. For instance, when comparing PPG signals using these wavelengths upon varying temperatures, the correlation between the signal and the biological feature being studied is weaker [20]. To overcome this, green wavelengths (around 525 nm) can be used, because they are not affected as much by both temperature effects and motion artifacts [19][20][21].
The PPG signal comprises two main components, the pulsatile or cardiac cycle (CCC) and superimposed or basal (BC) components. The pulsatile component originates from the blood volume variations created by the cardiac activity. As such, this signal portion depends on the cardiac phases, namely the systolic and diastolic phases. By isolating a single PPG pulse, four main fiducial points can be seen, as shown in Figure 2.
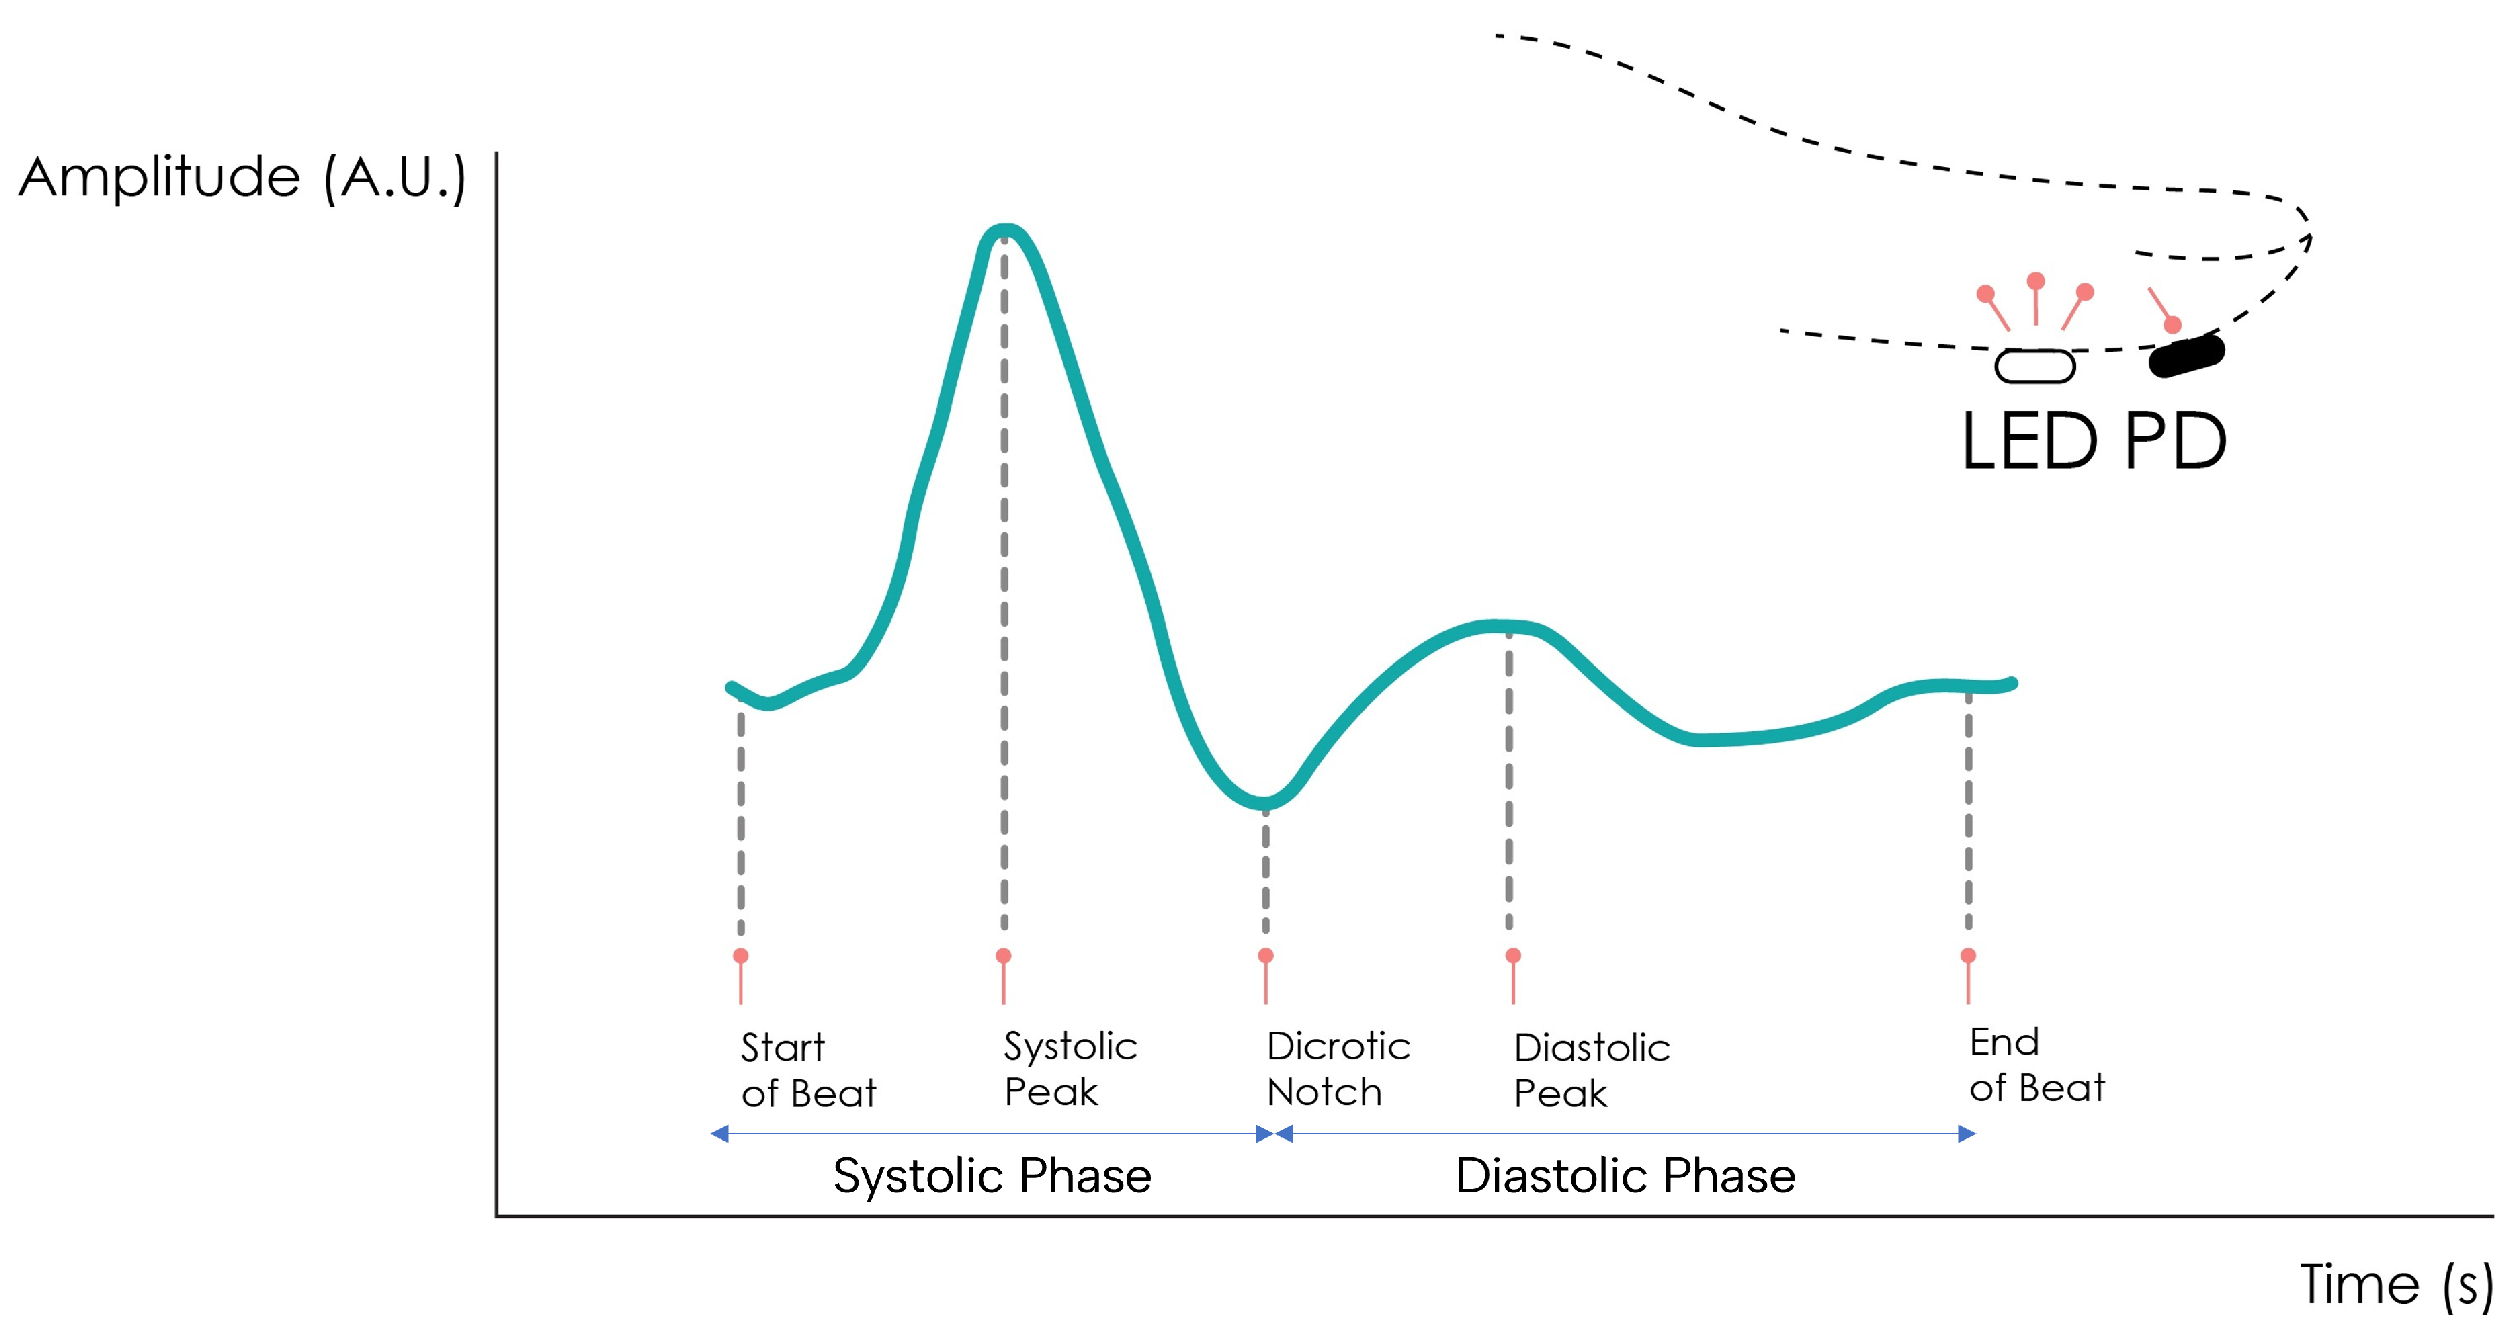
Figure 2. Normal PPG waveform of the CCC component.
The foot or onset corresponds to the beginning of the pulse (in the systolic phase), followed by the systolic peak, which is the maximum peak of the pulse signal, occurring after. The rising edge of the signal from onset to peak thus represents the rising blood volume within the measured body area. Next, a depression called the dicrotic notch occurs, as the aortic valve closes, followed by a lower peak, the diastolic peak. This second local maximum represents the reflected Windkessel wave [22][23]. The CCC component can thus be used to estimate cardiac-related features such as heart rate, heart rate variability, and blood pressure. Since these variations are synchronized with the cardiac cycle, they are also related to vasodilation, vasomotor, and vascular tones. The superimposed component, or nonpulsatile component, is mainly influenced by tissue composition and basic blood volume within the measurement site, and is often attenuated through signal conditioning [24]. This component is affected by internal parameters such as breathing, thermoregulation, and the activity of the sympathetic nervous system. Moreover, external parameters such as ambient light can also affect this signal component [10]. Because the amplitude of the PPG signal depends on the aforementioned internal and external factors, its measuring unit is considered arbitrary.
3. Measuring Sites
The most common measurement site for PPG signals is the finger. Being a peripheral part of the body with high blood perfusion allows for high signal amplitude [25]. The key disadvantage of this site is tied to the susceptibility of the sensor to motion artifacts. During daily activities, the fingers are constantly moving, creating a significant amount of motion noise which, in turn, compromises the measured signal [26]. Other measurement sites have been described in the literature, such as the earlobe, the wrist, the arm, or the ankle.
The earlobe has a much higher blood perfusion than the other measurement sites, even when compared to the finger, making it very attractive for obtaining high amplitude [27]. Earlobe sensors are also very easy to fabricate, but since the most common approach is with a spring-loaded ear clip, their use in long-term recordings becomes uncomfortable for the subject.
The wrist’s main advantages as a measurement site are its ease of use and discreetness. Many sensors are adapted into smartwatches, becoming a part of the subject’s usual garments, not requiring the volunteer to use any other equipment. The signal amplitude is lower than at the finger, but it is also less susceptible to motion artifacts [28][29].
The upper arm is also used despite the lower signal amplitude, due to its proximity to human arteries and its potential to be inserted into clothing, becoming just as comfortable as a wrist sensor [30].
The ankle, while less common, has a significant potential for implementing PPG data collection in discreet form factors. Being one of the farthest extremities of the body from the heart, it allows for the collection of peripheral blood perfusion data more accurately, helping detect conditions such as peripheral artery disease or peripheral vascular disease. It can also be easily integrated into undergarments such as socks to allow for constant monitoring without sacrificing comfort [31][32][33][34].
References
- Cardiovascular Diseases. Available online: https://www.who.int/health-topics/cardiovascular-diseases (accessed on 17 November 2023).
- Benjamin, E.J.; Muntner, P.; Alonso, A.; Bittencourt, M.S.; Callaway, C.W.; Carson, A.P.; Chamberlain, A.M.; Chang, A.R.; Cheng, S.; Das, S.R.; et al. Heart Disease and Stroke Statistics—2019 Update: A Report From the American Heart Association. Circulation 2019, 139, e56–e528.
- Mizuno, A.; Changolkar, S.; Patel, M.S. Wearable Devices to Monitor and Reduce the Risk of Cardiovascular Disease: Evidence and Opportunities. Annu. Rev. Med. 2021, 72, 459–471.
- Navalta, J.W.; Ramirez, G.G.; Maxwell, C.; Radzak, K.N.; McGinnis, G.R. Validity and Reliability of Three Commercially Available Smart Sports Bras during Treadmill Walking and Running. Sci. Rep. 2020, 10, 7397.
- Cosoli, G.; Antognoli, L.; Veroli, V.; Scalise, L. Accuracy and Precision of Wearable Devices for Real-Time Monitoring of Swimming Athletes. Sensors 2022, 22, 4726.
- Muggeridge, D.J.; Hickson, K.; Davies, A.V.; Giggins, O.M.; Megson, I.L.; Gorely, T.; Crabtree, D.R. Measurement of Heart Rate Using the Polar OH1 and Fitbit Charge 3 Wearable Devices in Healthy Adults During Light, Moderate, Vigorous, and Sprint-Based Exercise: Validation Study. JMIR MHealth UHealth 2021, 9, e25313.
- Jin, H.; Abu-Raya, Y.S.; Haick, H. Advanced Materials for Health Monitoring with Skin-Based Wearable Devices. Adv. Healthc. Mater. 2017, 6, 1700024.
- Castaneda, D.; Esparza, A.; Ghamari, M.; Soltanpur, C.; Nazeran, H. A review on wearable photoplethysmography sensors and their potential future applications in health care. Int. J. Biosens. Bioelectron. 2018, 4, 195–202.
- Izmailova, E.S.; Wagner, J.A.; Perakslis, E.D. Wearable Devices in Clinical Trials: Hype and Hypothesis. Clin. Pharmacol. Ther. 2018, 104, 42–52.
- Park, J.; Seok, H.S.; Kim, S.S.; Shin, H. Photoplethysmogram Analysis and Applications: An Integrative Review. Front. Physiol. 2022, 12, 808451.
- Tamura, T. Current progress of photoplethysmography and SPO2 for health monitoring. Biomed. Eng. Lett. 2019, 9, 21–36.
- Narendra Kumar Reddy, G.; Sabarimalai Manikandan, M.; Narasimha Murty, N.V.L. On-Device Integrated PPG Quality Assessment and Sensor Disconnection/Saturation Detection System for IoT Health Monitoring. IEEE Trans. Instrum. Meas. 2020, 69, 6351–6361.
- Uria-Rivas, R.; Rodriguez-Sanchez, M.C.; Santos, O.C.; Vaquero, J.; Boticario, J.G. Impact of Physiological Signals Acquisition in the Emotional Support Provided in Learning Scenarios. Sensors 2019, 19, 4520.
- Papapanagiotou, V.; Diou, C.; Zhou, L.; van den Boer, J.; Mars, M.; Delopoulos, A. A Novel Chewing Detection System Based on PPG, Audio, and Accelerometry. IEEE J. Biomed. Health Inform. 2017, 21, 607–618.
- Fay, T.H.; Hendrik Kloppers, P. The Gibbs’ phenomenon. Int. J. Math. Educ. Sci. Technol. 2001, 32, 73–89.
- Leske, S.; Dalal, S.S. Reducing power line noise in EEG and MEG data via spectrum interpolation. NeuroImage 2019, 189, 763–776.
- Elgendi, M.; Fletcher, R.; Liang, Y.; Howard, N.; Lovell, N.H.; Abbott, D.; Lim, K.; Ward, R. The use of photoplethysmography for assessing hypertension. NPJ Digit. Med. 2019, 2, 60.
- Nijboer, J.A.; Dorlas, J.C.; Mahieu, H.F. Photoelectric plethysmography-some fundamental aspects of the reflection and transmission methods. Clin. Phys. Physiol. Meas. 1981, 2, 205–215.
- Maeda, Y.; Sekine, M.; Tamura, T.; Moriya, A.; Suzuki, T.; Kameyama, K. Comparison of reflected green light and infrared photoplethysmography. In Proceedings of the 2008 30th Annual International Conference of the IEEE Engineering in Medicine and Biology Society, Vancouver, BC, Canada, 20–25 August 2008; pp. 2270–2272.
- Maeda, Y.; Sekine, M.; Tamura, T. The advantages of wearable green reflected photoplethysmography. J. Med. Syst. 2011, 35, 829–834.
- Matsumura, K.; Toda, S.; Kato, Y. RGB and Near-Infrared Light Reflectance/Transmittance Photoplethysmography for Measuring Heart Rate During Motion. IEEE Access 2020, 8, 80233–80242.
- Suboh, M.Z.; Jaafar, R.; Nayan, N.A.; Harun, N.H.; Mohamad, M.S.F. Analysis on Four Derivative Waveforms of Photoplethysmogram (PPG) for Fiducial Point Detection. Front. Public Health 2022, 10, 920946.
- Fujita, D.; Suzuki, A. Evaluation of the Possible Use of PPG Waveform Features Measured at Low Sampling Rate. IEEE Access 2019, 7, 58361–58367.
- Scardulla, F.; Cosoli, G.; Spinsante, S.; Poli, A.; Iadarola, G.; Pernice, R.; Busacca, A.; Pasta, S.; Scalise, L.; D’Acquisto, L. Photoplethysmograhic sensors, potential and limitations: Is it time for regulation? A comprehensive review. Measurement 2023, 218, 113150.
- Rhee, S.; Yang, B.H.; Asada, H. Artifact-resistant power-efficient design of finger-ring plethysmographic sensors. IEEE Trans. Biomed. Eng. 2001, 48, 795–805.
- Tamura, T.; Maeda, Y.; Sekine, M.; Yoshida, M. Wearable Photoplethysmographic Sensors—Past and Present. Electronics 2014, 3, 282–302.
- Tur, E.; Tur, M.; Maibach, H.I.; Guy, R.H. Basal Perfusion of the Cutaneous Microcirculation: Measurements as a Function of Anatomic Position. J. Investig. Dermatol. 1983, 81, 442–446.
- Jung, J.; Lee, J. ZigBee Device Access Control and Reliable Data Transmission in ZigBee Based Health Monitoring System. In Proceedings of the 2008 10th International Conference on Advanced Communication Technology, Gangwon, Republic of Korea, 17–20 February 2008; Volume 1, pp. 795–797.
- Lee, Y.; Shin, H.; Jo, J.; Lee, Y.K. Development of a wristwatch-type PPG array sensor module. In Proceedings of the 2011 IEEE International Conference on Consumer Electronics-Berlin (ICCE-Berlin), Berlin, Germany, 6–8 September 2011; pp. 168–171.
- Maguire, M.; Ward, T.E. The Design and Clinical Use of a Reflective Brachial Photoplethysmograph; NUIM/SS/–/2002/04, Signals and Systems Research Group, National University of Ireland: Maynooth, Ireland, 2002.
- Ferreira, A.F.; da Silva, H.P.; Alves, H.; Marques, N.; Fred, A. Feasibility of Electrodermal Activity and Photoplethysmography Data Acquisition at the Foot Using a Sock Form Factor. Sensors 2023, 23, 620.
- Ro, D.H.; Moon, H.J.; Kim, J.H.; Lee, K.M.; Kim, S.J.; Lee, D.Y. Photoplethysmography and continuous-wave Doppler ultrasound as a complementary test to ankle-brachial index in detection of stenotic peripheral arterial disease. Angiology 2013, 64, 314–320.
- Perpetuini, D.; Chiarelli, A.M.; Cardone, D.; Rinella, S.; Massimino, S.; Bianco, F.; Bucciarelli, V.; Vinciguerra, V.; Fallica, G.; Perciavalle, V.; et al. Photoplethysmographic Prediction of the Ankle-Brachial Pressure Index through a Machine Learning Approach. Appl. Sci. 2020, 10, 2137.
- Jönsson, B.; Laurent, C.; Skau, T.; Lindberg, L.G. A New Probe for Ankle Systolic Pressure Measurement Using Photoplethysmography (PPG). Ann. Biomed. Eng. 2005, 33, 232–239.
More
Information
Subjects:
Engineering, Biomedical
Contributors
MDPI registered users' name will be linked to their SciProfiles pages. To register with us, please refer to https://encyclopedia.pub/register
:
View Times:
689
Revisions:
2 times
(View History)
Update Date:
24 Jan 2024
Table of Contents


Notice
You are not a member of the advisory board for this topic. If you want to update advisory board member profile, please contact office@encyclopedia.pub.
OK
Confirm
Only members of the Encyclopedia advisory board for this topic are allowed to note entries. Would you like to become an advisory board member of the Encyclopedia?
Yes
No
${ textCharacter }/${ maxCharacter }
Submit
Cancel
Back
Comments
${ item }
|
${ item.createdUser.fullName }
${ item.createdAt }
${ item.vote }
${ item.reply }
Delete
${ reply.createdUser.fullName }
${ reply.createdAt }
${ reply.vote }
Delete
There is no reply to this comment~
${ item.replyTextCharacter }/${ item.replyMaxCharacter }
Submit
Cancel
More
No more~
There is no comment~
${ textCharacter }/${ maxCharacter }
Submit
Cancel
${ selectedItem.replyTextCharacter }/${ selectedItem.replyMaxCharacter }
Submit
Cancel
Confirm
Are you sure to Delete?
Yes
No