Your browser does not fully support modern features. Please upgrade for a smoother experience.
Submitted Successfully!
 +1 credit
Thank you for your contribution! You can also upload a video entry or images related to this topic.
For video creation, please contact our Academic Video Service.
| Version | Summary | Created by | Modification | Content Size | Created at | Operation |
|---|---|---|---|---|---|---|
| 1 | Andrew Alola | -- | 1080 | 2024-01-16 10:52:01 | | | |
| 2 | Rita Xu | Meta information modification | 1080 | 2024-01-18 02:36:00 | | |
Video Upload Options
We provide professional Academic Video Service to translate complex research into visually appealing presentations. Would you like to try it?
Cite
If you have any further questions, please contact Encyclopedia Editorial Office.
Alola, A.A.; Özkan, O.; Usman, O. Non-Renewable Energy Efficiency and Renewable Energy. Encyclopedia. Available online: https://encyclopedia.pub/entry/53889 (accessed on 24 July 2026).
Alola AA, Özkan O, Usman O. Non-Renewable Energy Efficiency and Renewable Energy. Encyclopedia. Available at: https://encyclopedia.pub/entry/53889. Accessed July 24, 2026.
Alola, Andrew Adewale, Oktay Özkan, Ojonugwa Usman. "Non-Renewable Energy Efficiency and Renewable Energy" Encyclopedia, https://encyclopedia.pub/entry/53889 (accessed July 24, 2026).
Alola, A.A., Özkan, O., & Usman, O. (2024, January 16). Non-Renewable Energy Efficiency and Renewable Energy. In Encyclopedia. https://encyclopedia.pub/entry/53889
Alola, Andrew Adewale, et al. "Non-Renewable Energy Efficiency and Renewable Energy." Encyclopedia. Web. 16 January, 2024.
Copy Citation
Policymakers and environmental scientists have proposed numerous measures toward achieving a sustainable environment. Some of these measures include the efficient use of energy and a scaling up of clean energy transition.
non-renewable energy efficiency
renewable energy utilization
environmental sustainability
1. Introduction
As reported by the Global Footprint Network (GFN), India’s ecological footprint exceeds its biocapacity by 171 percent, thus suggesting a significant imbalance in the interplay of its population needs and the nation’s earth supplies, i.e., the load capacity factor (LCF) [1]. Although several reasons could be linked with the increase in the ecological footprint of a country, trade liberalization that allows the importation of biocapacity aspects, the liquidation of national ecological assets, and atmospheric pollution arising from carbon dioxide (CO2) emissions are some of the reasons adduced to the ecological footprint deficit by the GFN. In the case of India, though the country has mostly suffered from trade imbalance over the years [2], the role of trade in economic development cannot be over-emphasized, especially in merchandise and services. Although the contribution of trade to the country’s gross domestic product (GDP) decreased from about 56 percent in the 2011–2012 period to about 45 percent in 2021 [3], the country has continued to experience growth in its exports and imports. This alludes to the potential reason attributed to the ecological deficit, i.e., importation of biocapacity aspects is India’s trade imbalance. For instance, even though export values of all traded commodities increased from over 291 billion United States Dollars (USD) in the period 2020/2021 to over 422 billion USD in 2021/2022 (approximately 44 percent increase), the value of the imported goods and services across the same period increased by 55 percent (i.e., imported products were worth ~394 percent during 2020/2021 and ~613 percent in 2021/2022) (Ministry of Commerce and Industry, 2022). Beyond the above-mentioned factors, the energy consumption mix [4][5] and financial development, among others [6][7], are found to be contributing to India’s environmental quality.
Given the above-mentioned potential drivers of the declining LCF in India (evidently illustrated in Figure 1), how variables such as trade, financial system development, energy efficiency, renewables, and a host of other variables affect LCF still remain unclear.
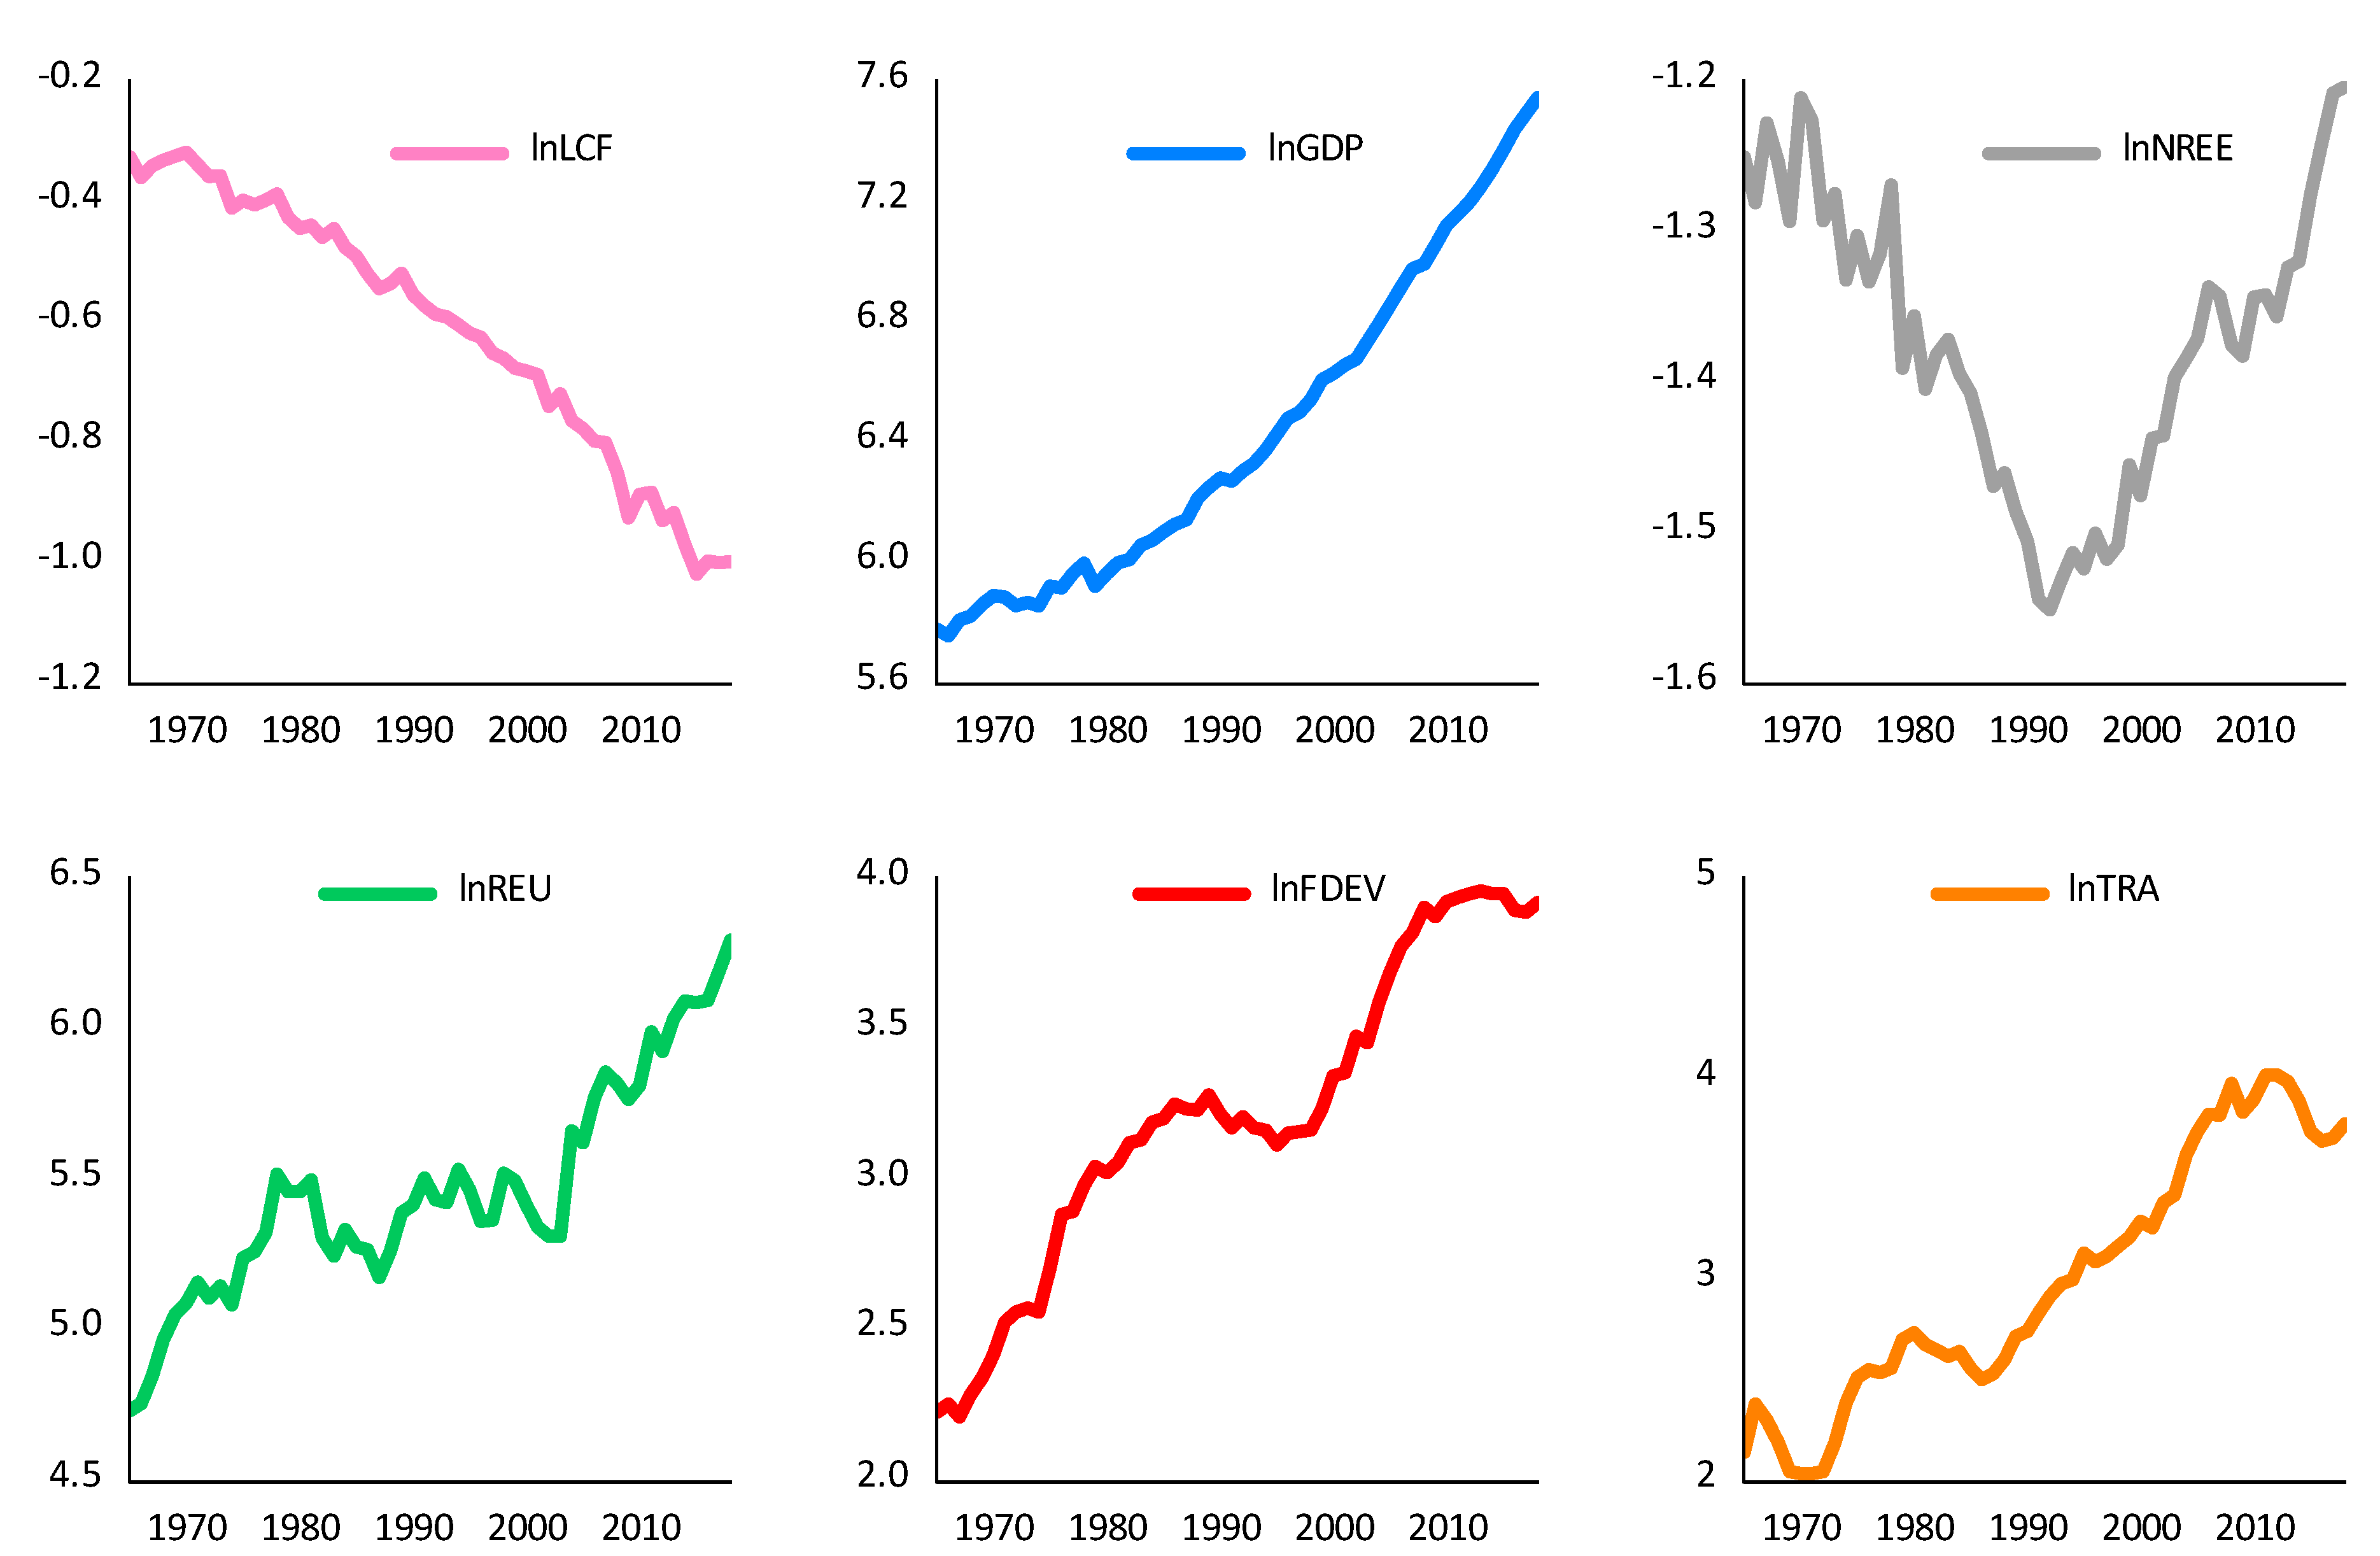
Figure 1. Time series plots of the logarithmic LCF, GDP, nonrenewable energy efficiency, renewable energy utilization, financial development, and trade openness from 1965 to 2018.
2. LCF and Energy Mix
In the study of [8], the validity of the LCC hypothesis for France during the period 1977–2017 was examined from the perspective of renewable and nuclear energy. Using the Fourier transformed approaches of cointegration and causality, the results revealed a lack of an EKC hypothesis when carbon emission was employed as an environmental variable, but they validated the EKC with the LCF. Importantly, the results further showed that nuclear energy mitigated carbon emissions and increased the LCF in the long-run, thus justifying nuclear energy’s effectiveness in improving environmental quality against renewable energy that acts in the opposite direction. Ref. [9] used three different indicators of environmental quality, namely, CO2 emissions, ecological footprints, and LCF, to examine the influence of nuclear energy use on environmental quality in South Korea. By employing the ARDL estimation approach, the study found that the load capacity curve and environmental Kuznets curve were validated. It further revealed that nuclear energy displayed a positive impact on environmental quality by dampening the level of carbon emissions, while renewable energy evidently displayed no impact on the state of the environment.
Similarly, [10] explored the case of Turkey during the period 1965–2017 by using the dynamic approach of the Autoregressive Distributed Lag (ARDL). The indicators examined, including aggregated energy consumption, tourism arrivals, and GDP, were all responsible for a decline in local capacity factor, which is an indication that the increase in the indicators is detrimental to environmental quality in the country. More recently, [11] looked at how economic growth, financial development, and tourism affected three measurements of environment indicators and, thus, tested the validity of the EKC and LCC hypotheses for the top ten tourism destinations in the world. Using second-generation panel data analytical techniques, the authors provided empirical evidence that both the EKC and LCC hypotheses were not valid in this case, although tourism arrivals improved environmental quality, while the development of the financial sector dampened the LCF.
3. Trade, Financial Development, and LCF
Like other environmental indicators, the LCF is found to be influenced by financial development [12][13]. Specifically, [12] employed the approaches of time frequency domain causality and dual adjustment for the case of India and found that financial globalization, clean energy transition, and resource endowments increased the LCF, i.e., improved environmental quality in the long-run, as the impact of economic growth was detrimental to LCF, i.e., the environmental quality. Meanwhile, the short-term effect showed that only renewable energy use was detrimental to the LCF in the short-run by causing a decline in the country’s load capacity factor. The case of Brazil was similarly considered in the recent study of [13] by using the ARDL approach for the data period 1970–2017. While the study affirmed that financial globalization increased the LCF i.e., improved environmental quality in Brazil as revealed by the result, a renewable and non-renewable energy mix alongside economic growth were responsible for the decline in the LCF.
As recently investigated, trade was also found to influence the LCF in Mexico while considering the dataset that covered the period 1970–2017 by [14]. The implemented dual adjustment approach affirmed cointegration among the LCF, renewable energy utilization, non-renewable energy utilization, economic growth, and trade openness over the examined period. Furthermore, trade openness was found to increase the LCF in the long-term, thus affirming the environmental desirability of trade liberalization in Brazil as against the negative impact of other indicators on the LCF. Of course, the study of [15] showed a contrary perspective on the effect of trade openness on the LCF. Specifically, [15] implemented several quantile approaches, including quantile regression and quantile-on-quantile regression, for the case of Turkey over the time from 1965–2018 and revealed that the LCF was negatively affected by trade openness. Moreover, the LCF was also negatively impacted by the increase in financial development and primary energy utilization across most of the quantiles.
Importantly, as is evident from the review of the above studies, a notable gap in the literature exists regarding the lack of a body of knowledge that suggests the drivers of the LCF from a comparative analysis of non-renewable energy efficiency and renewable energy use. Therefore, to further cover the existing deficiency in the body of knowledge, the LCF effect due to non-renewable energy efficiency and renewable energy use, alongside the roles of trade openness and financial development, were examined.
References
- GFN. Available online: https://www.footprintnetwork.org/ (accessed on 24 December 2022).
- Minitry of Commerce and Industry. 2022. Available online: https://tradestat.commerce.gov.in/eidb/default.asp (accessed on 4 January 2023).
- World Bank. Trade (% of GDP)–India. 2022. Available online: https://data.worldbank.org/indicator/NE.TRD.GNFS.ZS?locations=IN. (accessed on 4 January 2023).
- Rahman, M.M. Exploring the effects of economic growth, population density and international trade on energy consumption and environmental quality in India. Int. J. Energy Sect. Manag. 2020, 14, 1177–1203.
- Ahmad, W.; Ozturk, I.; Majeed, M.T. Asymmetric impact of disaggregate energy consumption on environmental quality for Pakistan, Bangladesh and India. Int. J. Ambient. Energy 2022, 43, 8248–8258.
- Udemba, E.N. Mediation of foreign direct investment and agriculture towards ecological footprint: A shift from single perspective to a more inclusive perspective for India. Environ. Sci. Pollut. Res. 2020, 27, 26817–26834.
- Zoaka, J.D.; Ekwueme, D.C.; Güngör, H.; Alola, A.A. Will financial development and clean energy utilization rejuvenate the environment in BRICS economies? Bus. Strategy Environ. 2022, 31, 2156–2170.
- Pata, U.K.; Samour, A. Do renewable and nuclear energy enhance environmental quality in France? A new EKC approach with the load capacity factor. Prog. Nucl. Energy 2022, 149, 104249.
- Pata, U.K.; Kartal, M.T. Impact of nuclear and renewable energy sources on environment quality: Testing the EKC and LCC hypotheses for South Korea. Nucl. Eng. Technol. 2023, 55, 587–594.
- Pata, U.K.; Balsalobre-Lorente, D. Exploring the impact of tourism and energy consumption on the load capacity factor in Turkey: A novel dynamic ARDL approach. Environ. Sci. Pollut. Res. 2022, 29, 13491–13503.
- Pata, U.K.; Tanriover, B. Is the Load Capacity Curve Hypothesis Valid for the Top Ten Tourism Destinations? Sustainability 2023, 15, 960.
- Akadiri, S.S.; Adebayo, T.S.; Riti, J.S.; Awosusi, A.A.; Inusa, E.M. The effect of financial globalization and natural resource rent on load capacity factor in India: An analysis using the dual adjustment approach. Environ. Sci. Pollut. Res. 2022, 29, 89045–89062.
- Xu, D.; Salem, S.; Awosusi, A.A.; Abdurakhmanova, G.; Altuntaş, M.; Oluwajana, D.; Kirikkaleli, D.; Ojekemi, O. Load Capacity Factor and Financial Globalization in Brazil: The Role of Renewable Energy and Urbanization. Front. Environ. Sci. 2022, 9.
- Huilan, W.; Akadiri, S.S.; Haouas, I.; Awosusi, A.A.; Odu, A.T. Impact of trade liberalization and renewable energy on load capacity factor: Evidence from novel dual adjustment approach. Energy Environ. 2022.
- Akhayere, E.; Kartal, M.T.; Adebayo, T.S.; Kavaz, D. Role of energy consumption and trade openness towards environmental sustainability in Turkey. Environ. Sci. Pollut. Res. 2022, 30, 21156–21168.
More
Information
Subjects:
Economics
Contributors
MDPI registered users' name will be linked to their SciProfiles pages. To register with us, please refer to https://encyclopedia.pub/register
:
View Times:
1.1K
Revisions:
2 times
(View History)
Update Date:
18 Jan 2024
Table of Contents


Notice
You are not a member of the advisory board for this topic. If you want to update advisory board member profile, please contact office@encyclopedia.pub.
OK
Confirm
Only members of the Encyclopedia advisory board for this topic are allowed to note entries. Would you like to become an advisory board member of the Encyclopedia?
Yes
No
${ textCharacter }/${ maxCharacter }
Submit
Cancel
Back
Comments
${ item }
|
${ item.createdUser.fullName }
${ item.createdAt }
${ item.vote }
${ item.reply }
Delete
${ reply.createdUser.fullName }
${ reply.createdAt }
${ reply.vote }
Delete
There is no reply to this comment~
${ item.replyTextCharacter }/${ item.replyMaxCharacter }
Submit
Cancel
More
No more~
There is no comment~
${ textCharacter }/${ maxCharacter }
Submit
Cancel
${ selectedItem.replyTextCharacter }/${ selectedItem.replyMaxCharacter }
Submit
Cancel
Confirm
Are you sure to Delete?
Yes
No