You're using an outdated browser. Please upgrade to a modern browser for the best experience.

Submitted Successfully!
Thank you for your contribution! You can also upload a video entry or images related to this topic.
For video creation, please contact our Academic Video Service.
| Version | Summary | Created by | Modification | Content Size | Created at | Operation |
|---|---|---|---|---|---|---|
| 1 | Nico Surantha | -- | 2652 | 2024-01-10 08:53:04 | | | |
| 2 | Catherine Yang | Meta information modification | 2652 | 2024-01-11 02:09:06 | | |
Video Upload Options
We provide professional Academic Video Service to translate complex research into visually appealing presentations. Would you like to try it?
Cite
If you have any further questions, please contact Encyclopedia Editorial Office.
Vincentdo, V.; Surantha, N. Hydroponic Monitoring and Controlling System Using ANFIS. Encyclopedia. Available online: https://encyclopedia.pub/entry/53649 (accessed on 28 December 2025).
Vincentdo V, Surantha N. Hydroponic Monitoring and Controlling System Using ANFIS. Encyclopedia. Available at: https://encyclopedia.pub/entry/53649. Accessed December 28, 2025.
Vincentdo, Vito, Nico Surantha. "Hydroponic Monitoring and Controlling System Using ANFIS" Encyclopedia, https://encyclopedia.pub/entry/53649 (accessed December 28, 2025).
Vincentdo, V., & Surantha, N. (2024, January 10). Hydroponic Monitoring and Controlling System Using ANFIS. In Encyclopedia. https://encyclopedia.pub/entry/53649
Vincentdo, Vito and Nico Surantha. "Hydroponic Monitoring and Controlling System Using ANFIS." Encyclopedia. Web. 10 January, 2024.
Copy Citation
Most people are now aware of the importance of a healthy lifestyle, including the importance of consuming vegetables. As a result, the demand for vegetables has increased, and so their production needs to be increased. Currently, most plantations use soil as a growing medium, which is time-consuming and requires a significant amount of space. To modernize cultivation, hydroponic techniques should be adopted. A smart hydroponic system was developed using the adaptive neuro-fuzzy inference system (ANFIS) method, which allows for automatic adjustments based on the collected dataset and remote control through internet of things (IoT) technology.
automatic hydroponic system
internet of things
ANFIS
agriculture
fuzzy logic control
artificial intelligence
1. Introduction
In this modern era, people have come to understand the importance of health, and the implementation of a healthy lifestyle has become prevalent. One of the popular healthy lifestyles involves the consumption of healthy food. Vegetables are highly regarded as a healthy food due to their beneficial substances for the human body. These include vitamins, minerals, fiber, and phytochemical compounds. These substances make sufficient vegetable consumption become a solution to prevent various diseases [1]. As the public realizes the importance of a healthy lifestyle, the demand for vegetable production increases. However, in Indonesia, vegetable plantation is still performed traditionally by using soil as the medium. This method needs to be modernized because it requires a large space and has a slow pace of production [2]. A form of modernization that can be implemented is by planting using hydroponic technique.
Hydroponics is a planting process that utilizes water as the growing medium. When plants are cultivated using hydroponics, they can grow faster and larger compared to traditional growing methods due to the provision of nutrients to obtain maximum crop yields [3]. However, implementing this technique requires water reservoirs with precisely calibrated nutrient levels, which can be seen as an obstacle for some people who wish to grow crops using hydroponics, as it requires a bit of complexity in the setup.
Several studies have tried to resolve the difficulty of nutritional adjustment techniques. In a study by Mehra et al. [4], the deep neural network (DNN) was implemented to control the environmental conditions of the hydroponic system. There are also researchers who proposed an automatic hydroponic system by using Bayesian networks [5]. Another research that intrigued the authors of this study was an automatic hydroponic system that implemented fuzzy logic [6]. According to Denai et al. [7], controlling a system by using fuzzy logic results in a good performance and it only needs a simple mathematical model to formulate the algorithm.
However, a weakness found in fuzzy logic was the absence of a systematic procedure for designing a fuzzy controller. This is where the adaptive neuro fuzzy inference system (ANFIS) plays an important role in overcoming this issue, as ANFIS can automatically perform parameter adjustments [8]. Researchers have used ANFIS to train the fuzzy controller using real data from existing problems. The IoT system is designed to monitor and regulate the pH and nutrient levels of the plants being observed. Then, the ANFIS algorithm is subsequently used to regulate the pH-up, pH-down, water, and nutrition pumps.
2. Design of Smart Hydroponic Monitoring and Controlling System Using ANFIS
The system in this study is divided into two parts: hardware design and application design. Hardware design describes the whole system architecture and the way each component communicates with each other. Application design explains the procedure on creating the ANFIS models and how the system works.
2.1. Proposed Hardware Design
Figure 1 depicts the design of the system, which is divided into two main components. The first component is the layer device, which includes a set of sensors, actuators, and a microcontroller. The second component is the layer database and web, which include a set of computation devices and an end-user interface.
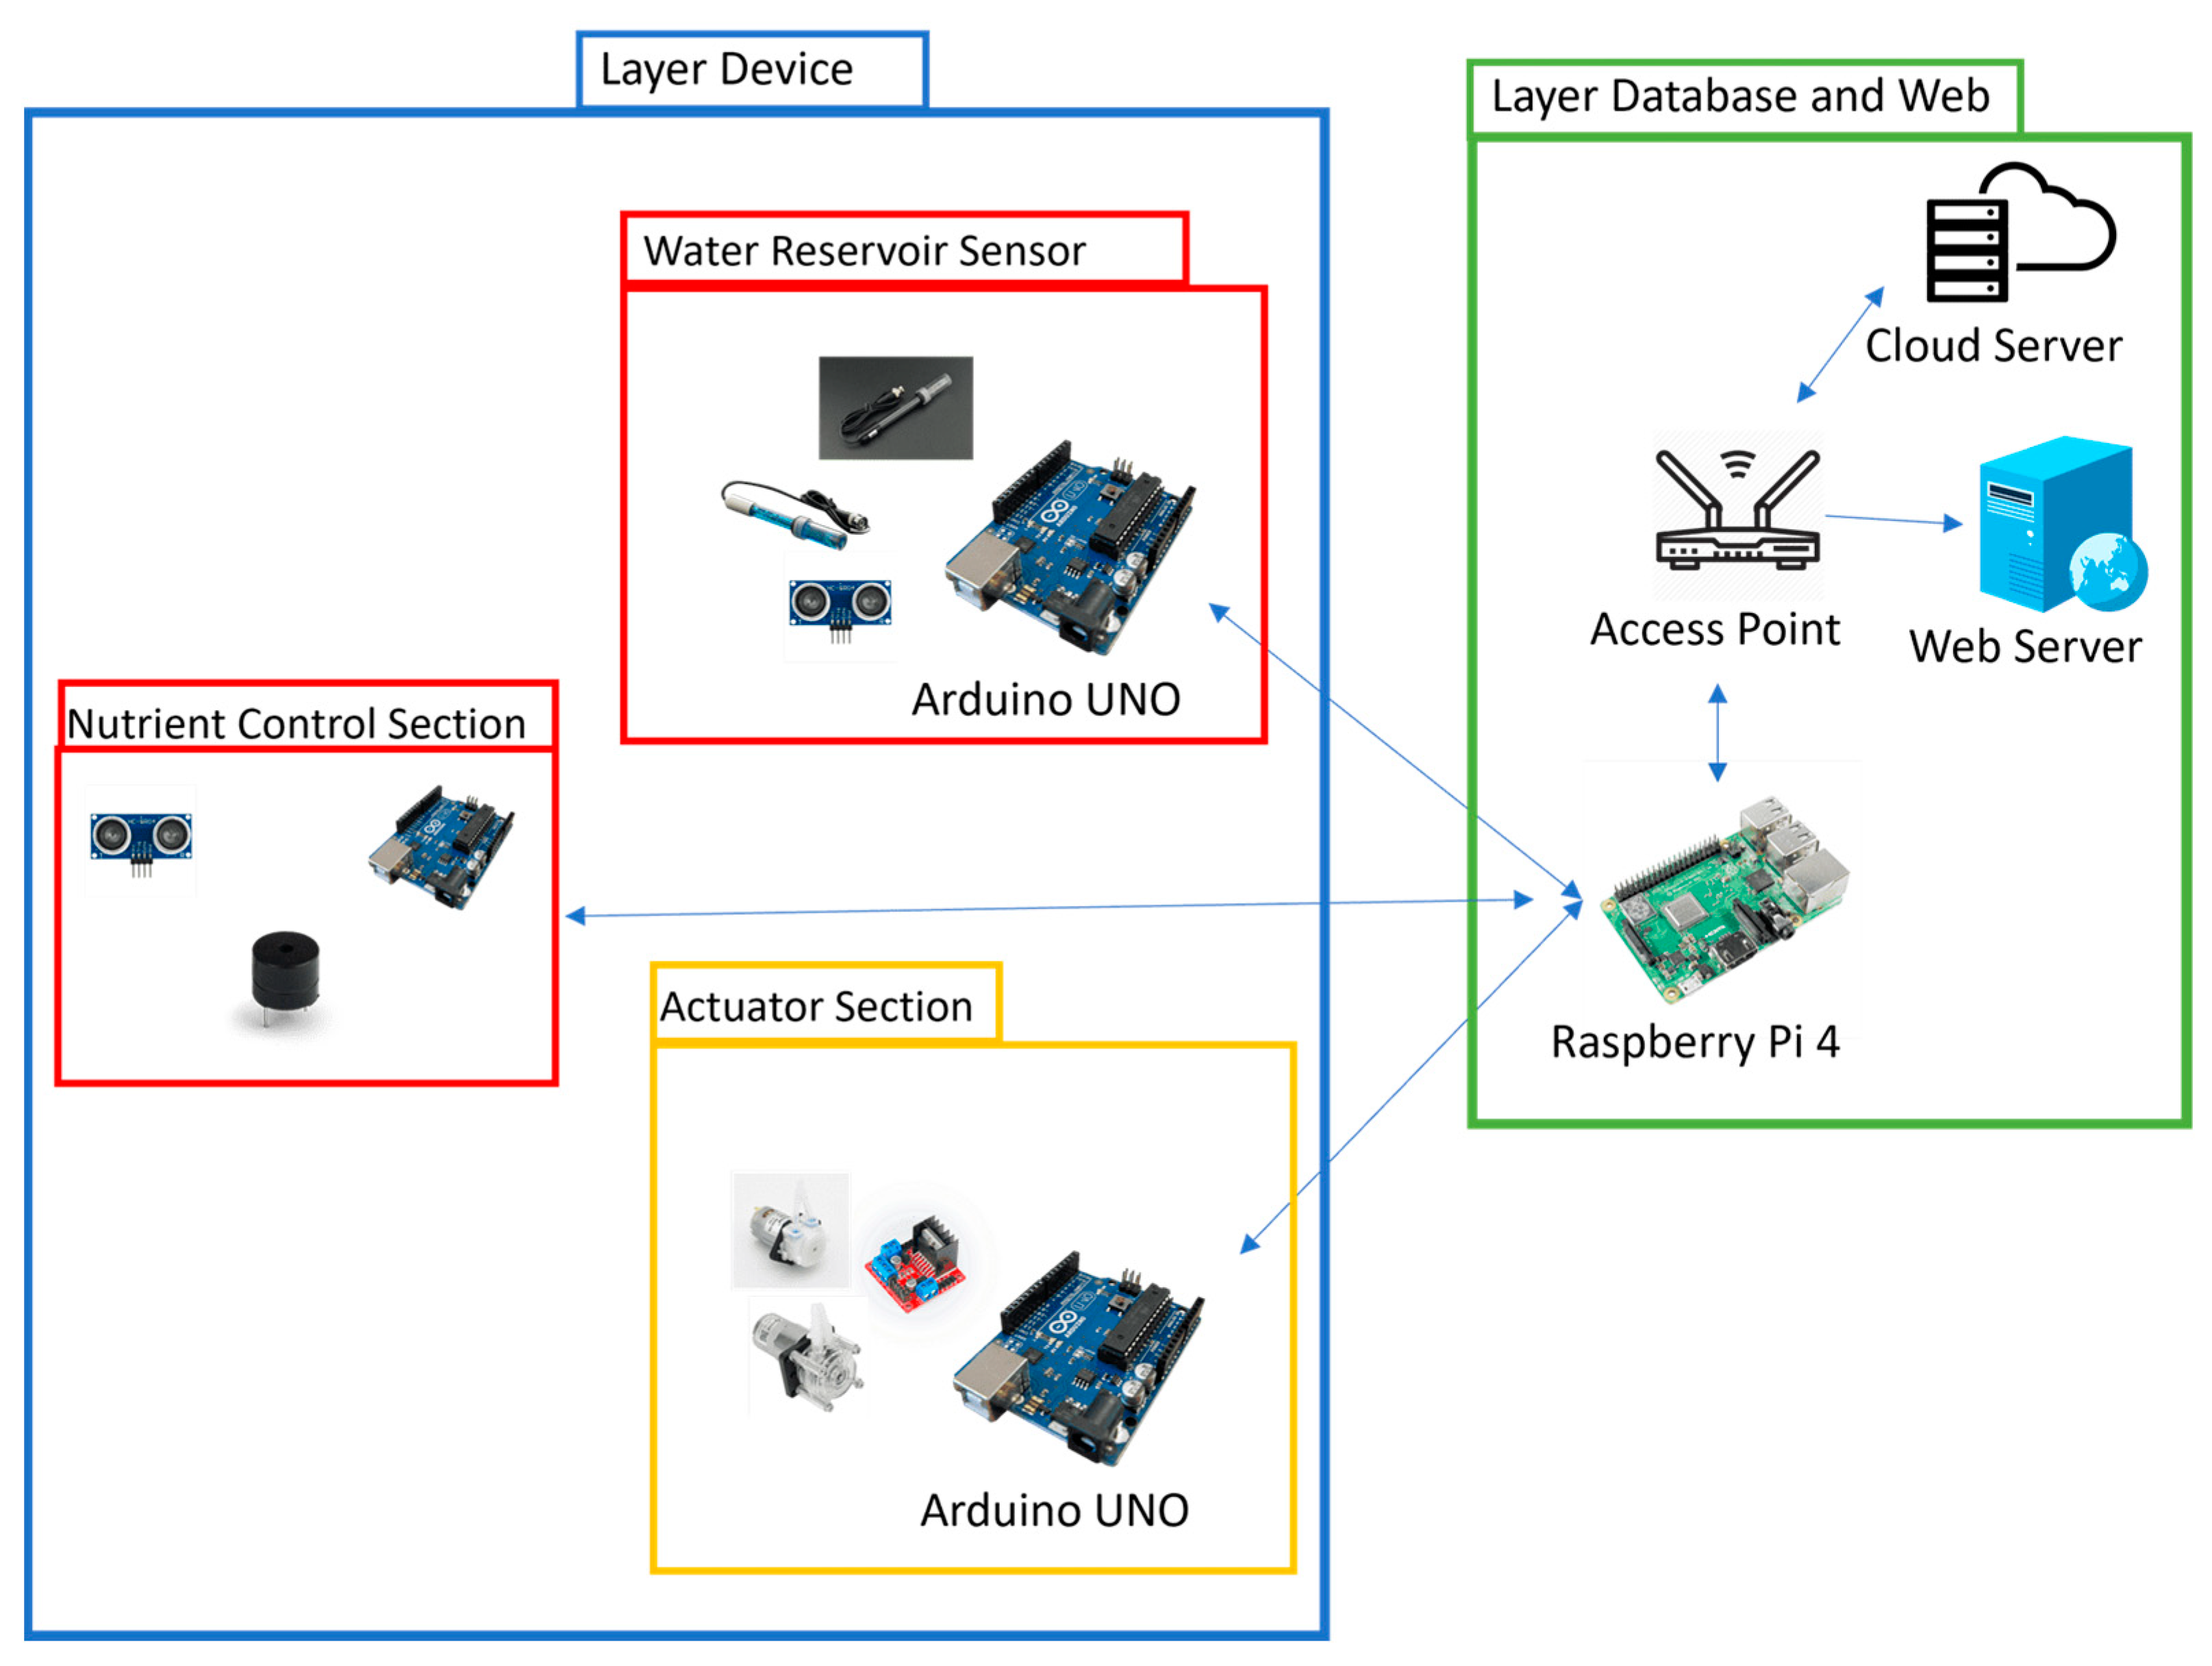
Figure 1. System architecture.
Layer device consists of three parts: a water reservoir sensor, a nutrient control section, and an actuator section. Figure 2 shows the details of the water reservoir sensor. In this part, Arduino Uno plays a very important role in controlling and receiving sensor data of pH and TDS. The flow of the sensor section starts from the ultrasonic sensor from Kuongshun Electronic HC-SR04 that is connected to Arduino Uno, which is used to measure the level of the water by calculating the distance between the top part of the water reservoir and the water in the reservoir itself.
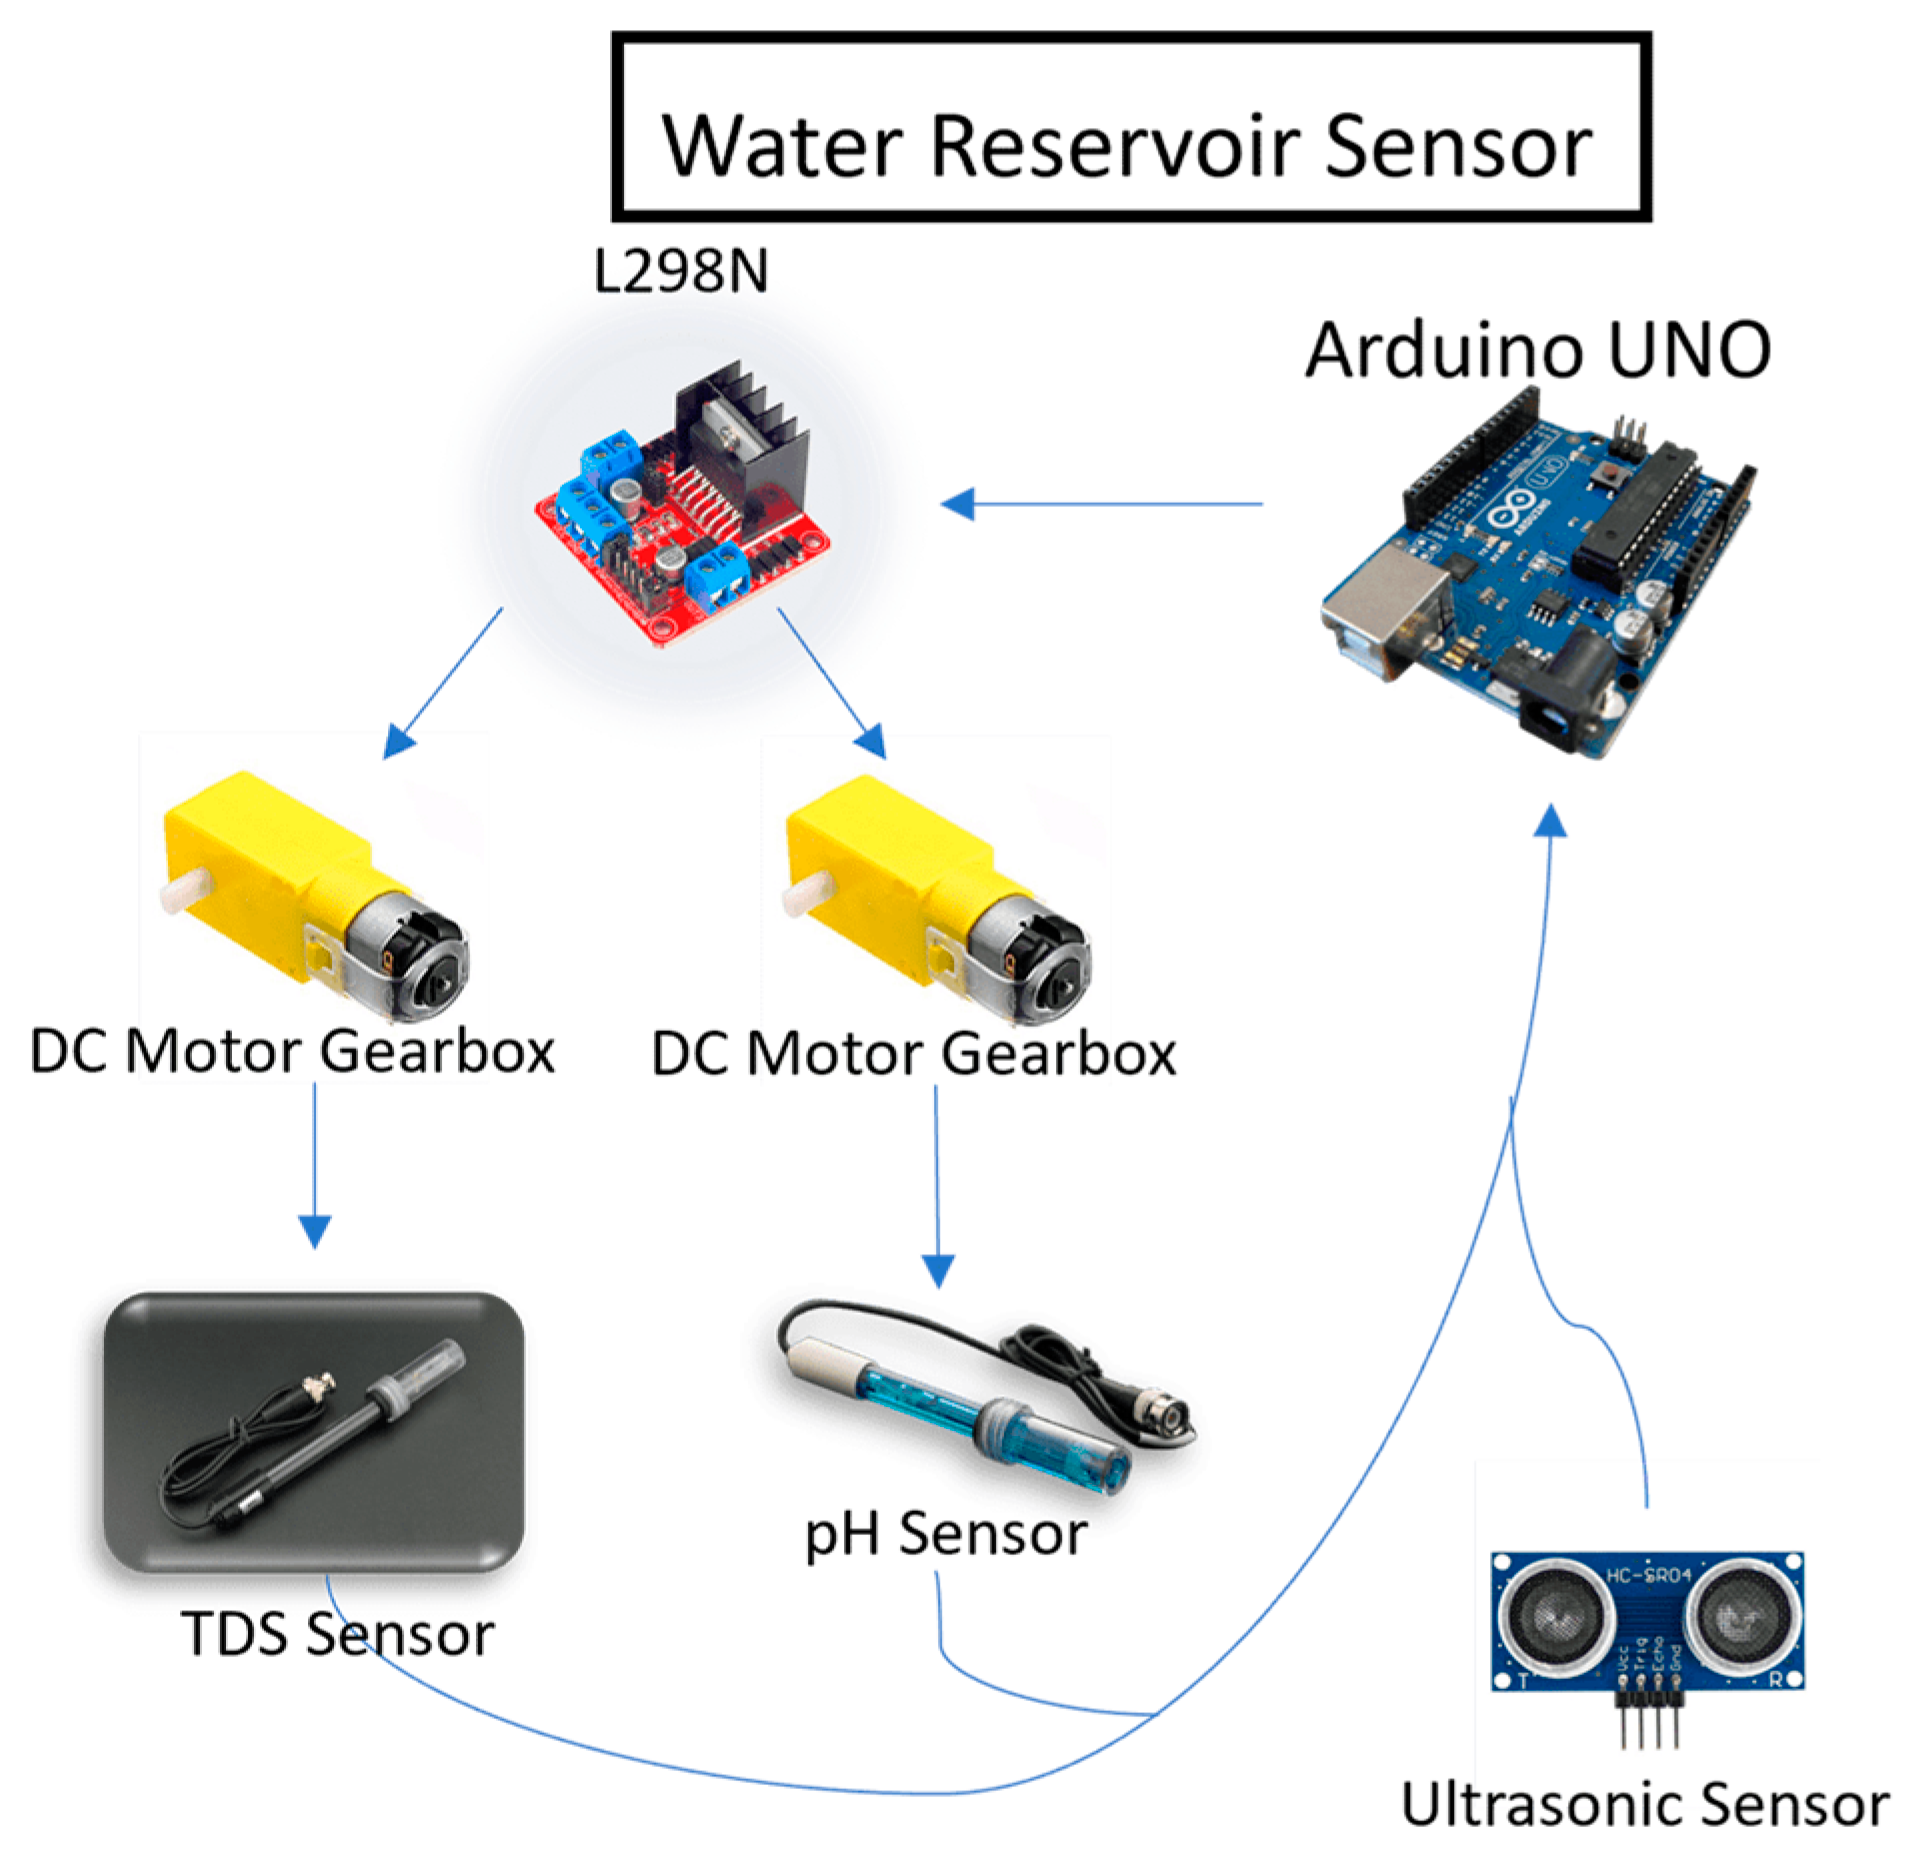
Figure 2. Water reservoir sensor details.
Arduino is also connected to Dual H-Bridge L298N which is used to control the movement of the DC motor gearbox in accordance with the pulse width modulation (PWM) input from Arduino. Then, the TDS sensor from DFRobot DFR0300 and pH sensor from DFRobot SEN0161 V2 are attached to the DC motor gearbox, and based on the PWM input from Arduino, the TDS sensor and pH sensor will be lowered to the determined height to start measuring the level of TDS and pH of the water reservoir. After the measurement is performed, Arduino will receive the measured TDS and pH data.
Furthermore, there is also a nutrient control section in the device layer, the details as shown by Figure 3. The Arduino Uno plays a crucial role in ensuring that the pH and TDS chemicals are always readily available. Four ultrasonic sensors are connected to the Arduino and are employed to measure the levels of the chemical liquids for pH Up, pH Down, nutrient A, and nutrient B. In addition to the ultrasonic sensors, a Piezo buzzer is also connected to the Arduino, serving as a notification to the user when the chemical liquid level is running low. Hence, if the volume of any of the chemical liquids falls below the predetermined level, the Piezo buzzer will produce sounds until the chemical liquid is returned to the specified level.
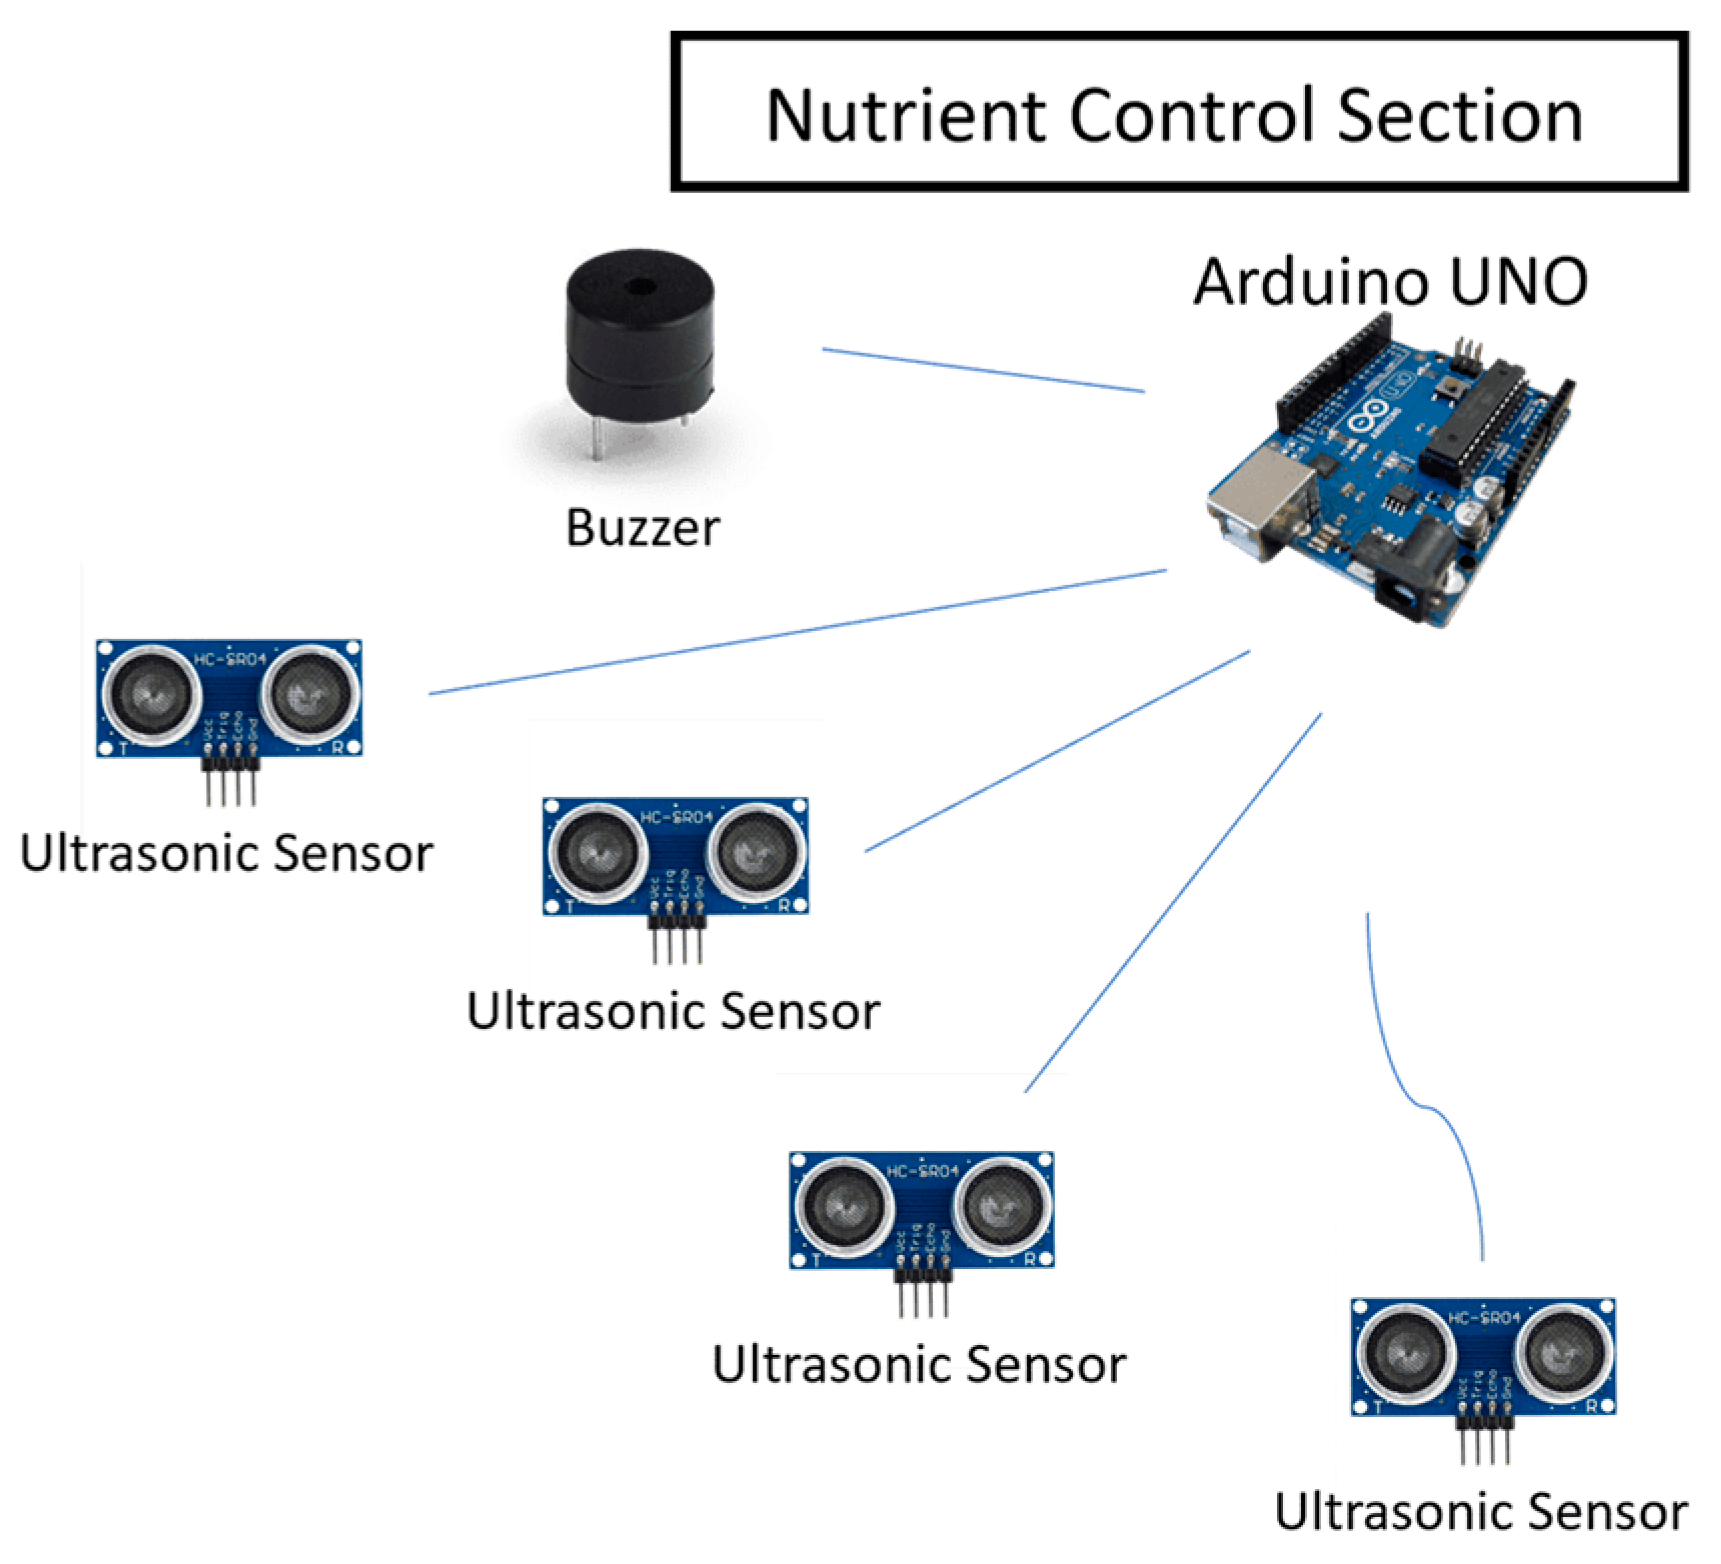
Figure 3. Nutrient control section details.
Arduino Uno also plays a critical role in the actuator section, serving as the control center for all existing actuators. As shown in Figure 4, there are two Dual H-Bridge L298N units connected to the Arduino, one to control the nutrient peristaltic pump and the other to control the pH peristaltic pump. The Dual H-Bridge L298N was chosen because it allows control of the actuators using PWM, enabling the precise control of the output of each peristaltic pump. Additionally, the Arduino is connected to a relay that is used to control three actuators: the water pump to add water to the reservoir, the water pump to reduce the water inside the reservoir, and the aerator to provide more oxygen into the system.
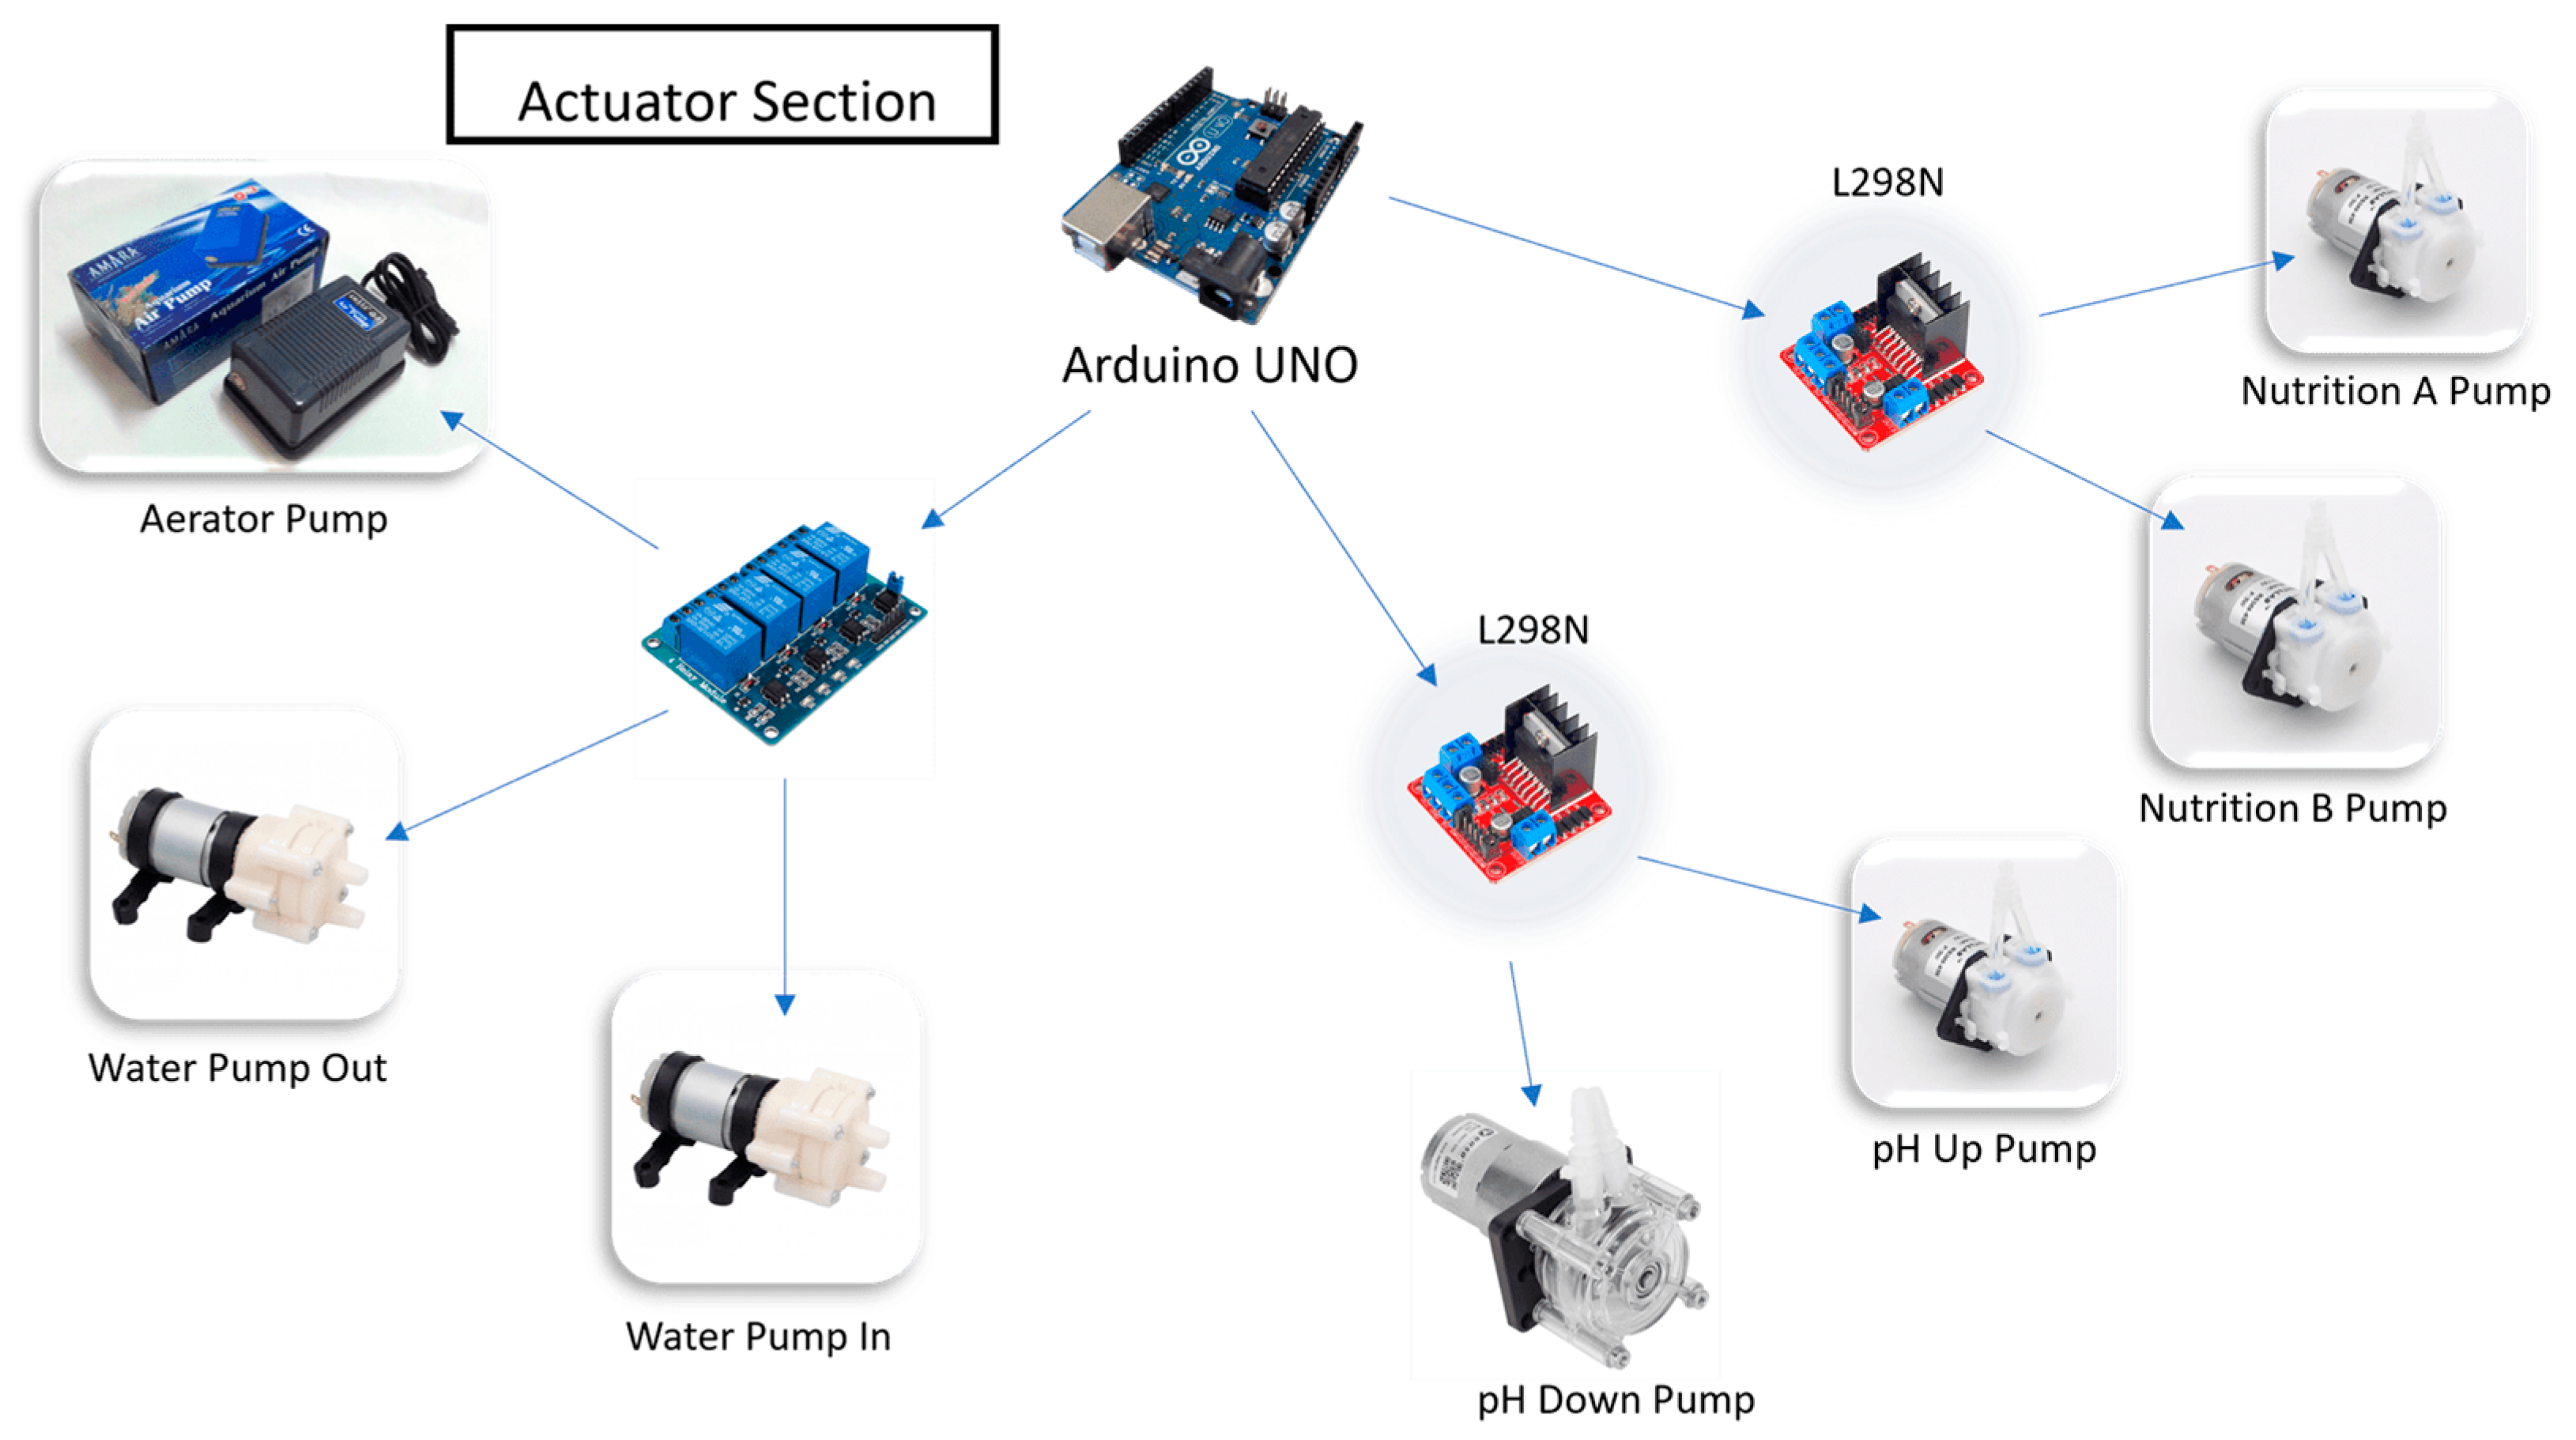
Figure 4. Actuator section details.
The Arduino on the water reservoir sensor section, nutrient control section, and actuator section are all connected to the Raspberry Pi 4 from the layer database and web, and this Raspberry acts as the brain of the entire system. The pH and TDS data on the Arduino sensor section are sent to Raspberry, then the pH and TDS data are processed by the fuzzy controller created by ANFIS, and the output is then sent to Arduino in the actuator section as shown in Figure 5. The output is a number in a form of seconds, which will determine how long each pump needs to be turned on in the actuator section. Raspberry will also send the output to the cloud database, then the web server will automatically detect that new data and reload the web component to show the latest data. This study also implements the internet of things, thus, the system can be controlled from anywhere. In order to accomplish everything described above, the Raspberry will work in multithreading by operating two applications at the same time. The first application is to control the system, while the other is to monitor the cloud database.
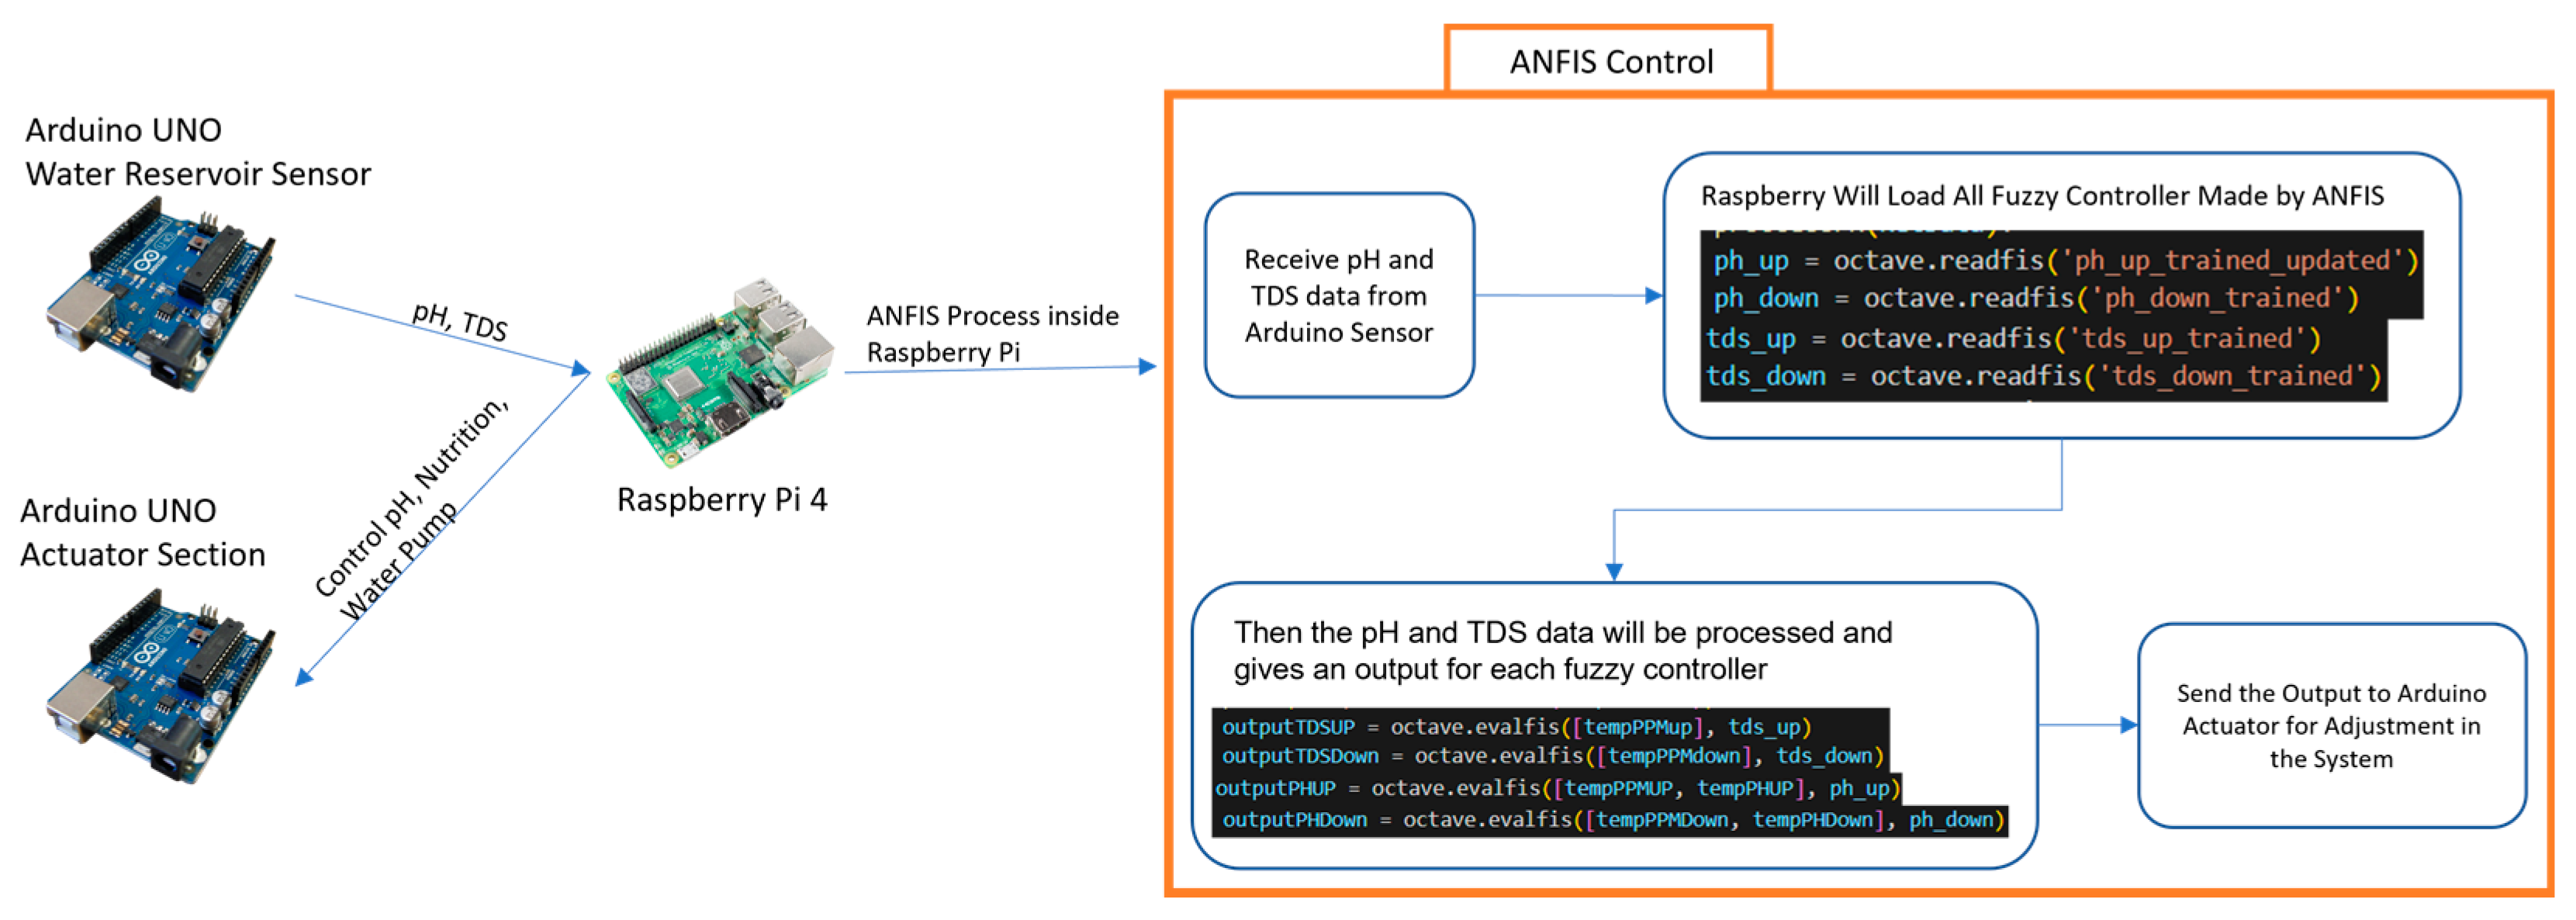
Figure 5. Raspberry Pi process details.
2.2. Proposed Application Design
ANFIS is a combination of fuzzy and neural network. The neural network needs a digital dataset to create the models and train it. The dataset needs to be accurate so it can produce a good ANFIS. However, a dataset for this study is not yet available. Therefore, as can be seen in Figure 6, the first step that needs to be taken is collecting data to be used as the study’s dataset. The step in creating the dataset can be performed by conducting an experiment in adjusting the water’s pH and nutrient level inside the reservoir based on the pH and TDS data acquired by the sensors. The adjustments can be performed by pumping a pH up or down, by pumping a nutrient liquid, or by refilling the water in the reservoir. The time needed for the pump to be turned on to perform the adjustment will be recorded and stored to be used as a dataset. The pH and TDS sensors used for creating the dataset are manual tools as shown in Figure 7a,b. The accuracy of the pH and TDS meters has been tested and calibrated before being used.

Figure 6. Data processing flow.
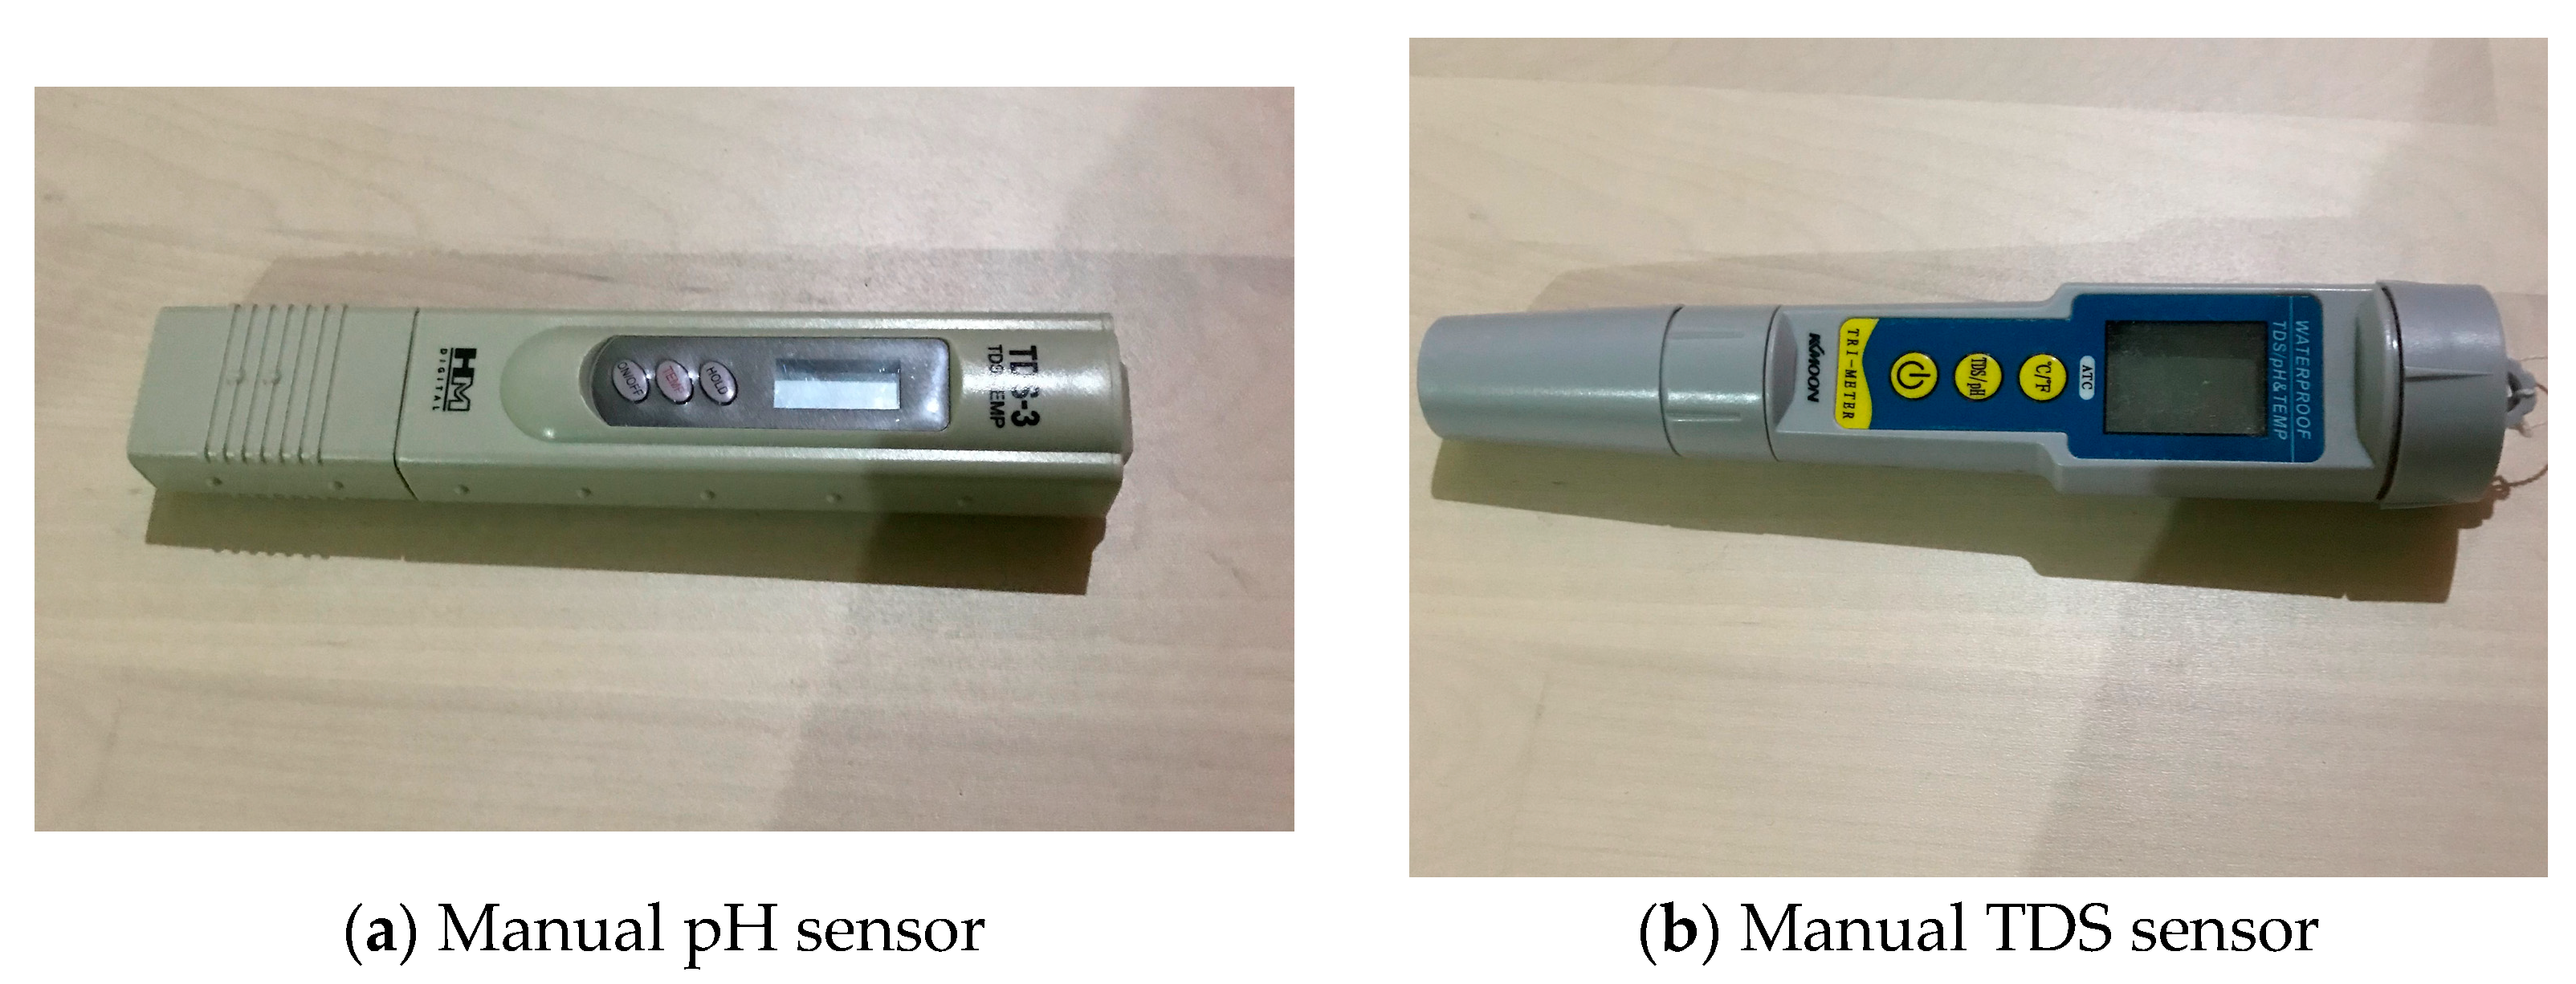
Figure 7. Manual tools for creating the dataset.
The dataset is divided into four types, one for each ANFIS model, which results in four ANFIS models altogether. It needs to be divided into four models because the structure of ANFIS is made up of multi-input and single output. Therefore, each model will have an output that represents each actuator used to manipulate the level of pH and nutrients of the water inside the reservoir.
The first and the second datasets are the ones to lower or increase the level of pH of the water inside the reservoir. The first step in collecting the data is by filling the reservoir with 10 liters of water, then the pH is measured by using a pH meter. If the measured pH is less than normal, which is 5.5–6.5 [9], then the pH Up liquid will be pumped until it reaches the normal level. Meanwhile, if the measured pH is more than the normal level, then the pH Down liquid will be pumped until the pH level returns to normal. The duration of time that the pH liquid is turned on will be captured, as well as the pH and TDS data before and after manipulation.
The third and fourth datasets are the ones to lower or increase the level of nutrients dissolved in the water inside the reservoir. The steps to create the dataset uses the same steps as creating the pH dataset, which is by filling the reservoir with 10 L of water, then the dissolved nutrient will be measured. If the measured nutrient level is less than the normal threshold, which is 600–900 ppm [9], then the nutrient-boosting liquid will be pumped until it returns to the normal threshold. If it is more than its normal level, then the pump for disposing water from the reservoir and the pump for filling water into the reservoir will be turned on until the nutrient level returns to normal. The duration of time that each pump operates will be captured along with the pH and TDS data after the performed adjustment. Some examples of collected data can be seen in Table 1.
Table 1. Some examples of the dataset.
| EC | pH | Output Actuator pH Up (Second) | Output Actuator pH Down (Second) | Output Actuator TDS Up (Second) | Output Actuator TDS Down (Second) |
|---|---|---|---|---|---|
| 291 | 4.4 | 2.2 | 0 | 18 | 0 |
| 383 | 5.4 | 0.1 | 0 | 15 | 0 |
| 614 | 6.5 | 0 | 4.3 | 0 | 0 |
| 1090 | 6.1 | 0 | 0 | 0 | 240 |
The data cleansing process needs to be performed after the data have been collected to remove all duplicated and irrelevant data. The data can be duplicated because the data are created manually, which might happen because of double input. In addition, an example of irrelevant data is when there is a starting nutrient level and pH, but no nutrient level, and the pH is captured after adjusting the pH or TDS, thus causing the output result to be unusable as a dataset, which can happen because of wrong input. Microsoft Excel is used for cleansing the data; a simple conditional formatting is used to remove all of the duplicated and irrelevant data.
After the dataset is prepared, the design process of ANFIS can be started by determining the degree of membership function. Through trial and error, the most optimal membership functions are:
-
For pH Up model, it is a generalized bell membership function, with 2 degrees of TDS membership function and 7 degrees of pH membership function, as shown in Figure 8;
-
For pH Down model, it is a generalized bell membership function, with 2 degrees of membership function for TDS and 3 degrees of membership function for pH, as shown in Figure 9;
-
For TDS Up model, it is a generalized bell membership function, with 5 degrees of membership function for TDS, as shown in Figure 10;
-
For TDS Down model, it is a generalized bell membership function, with 5 degrees of membership function for TDS, as shown in Figure 11.
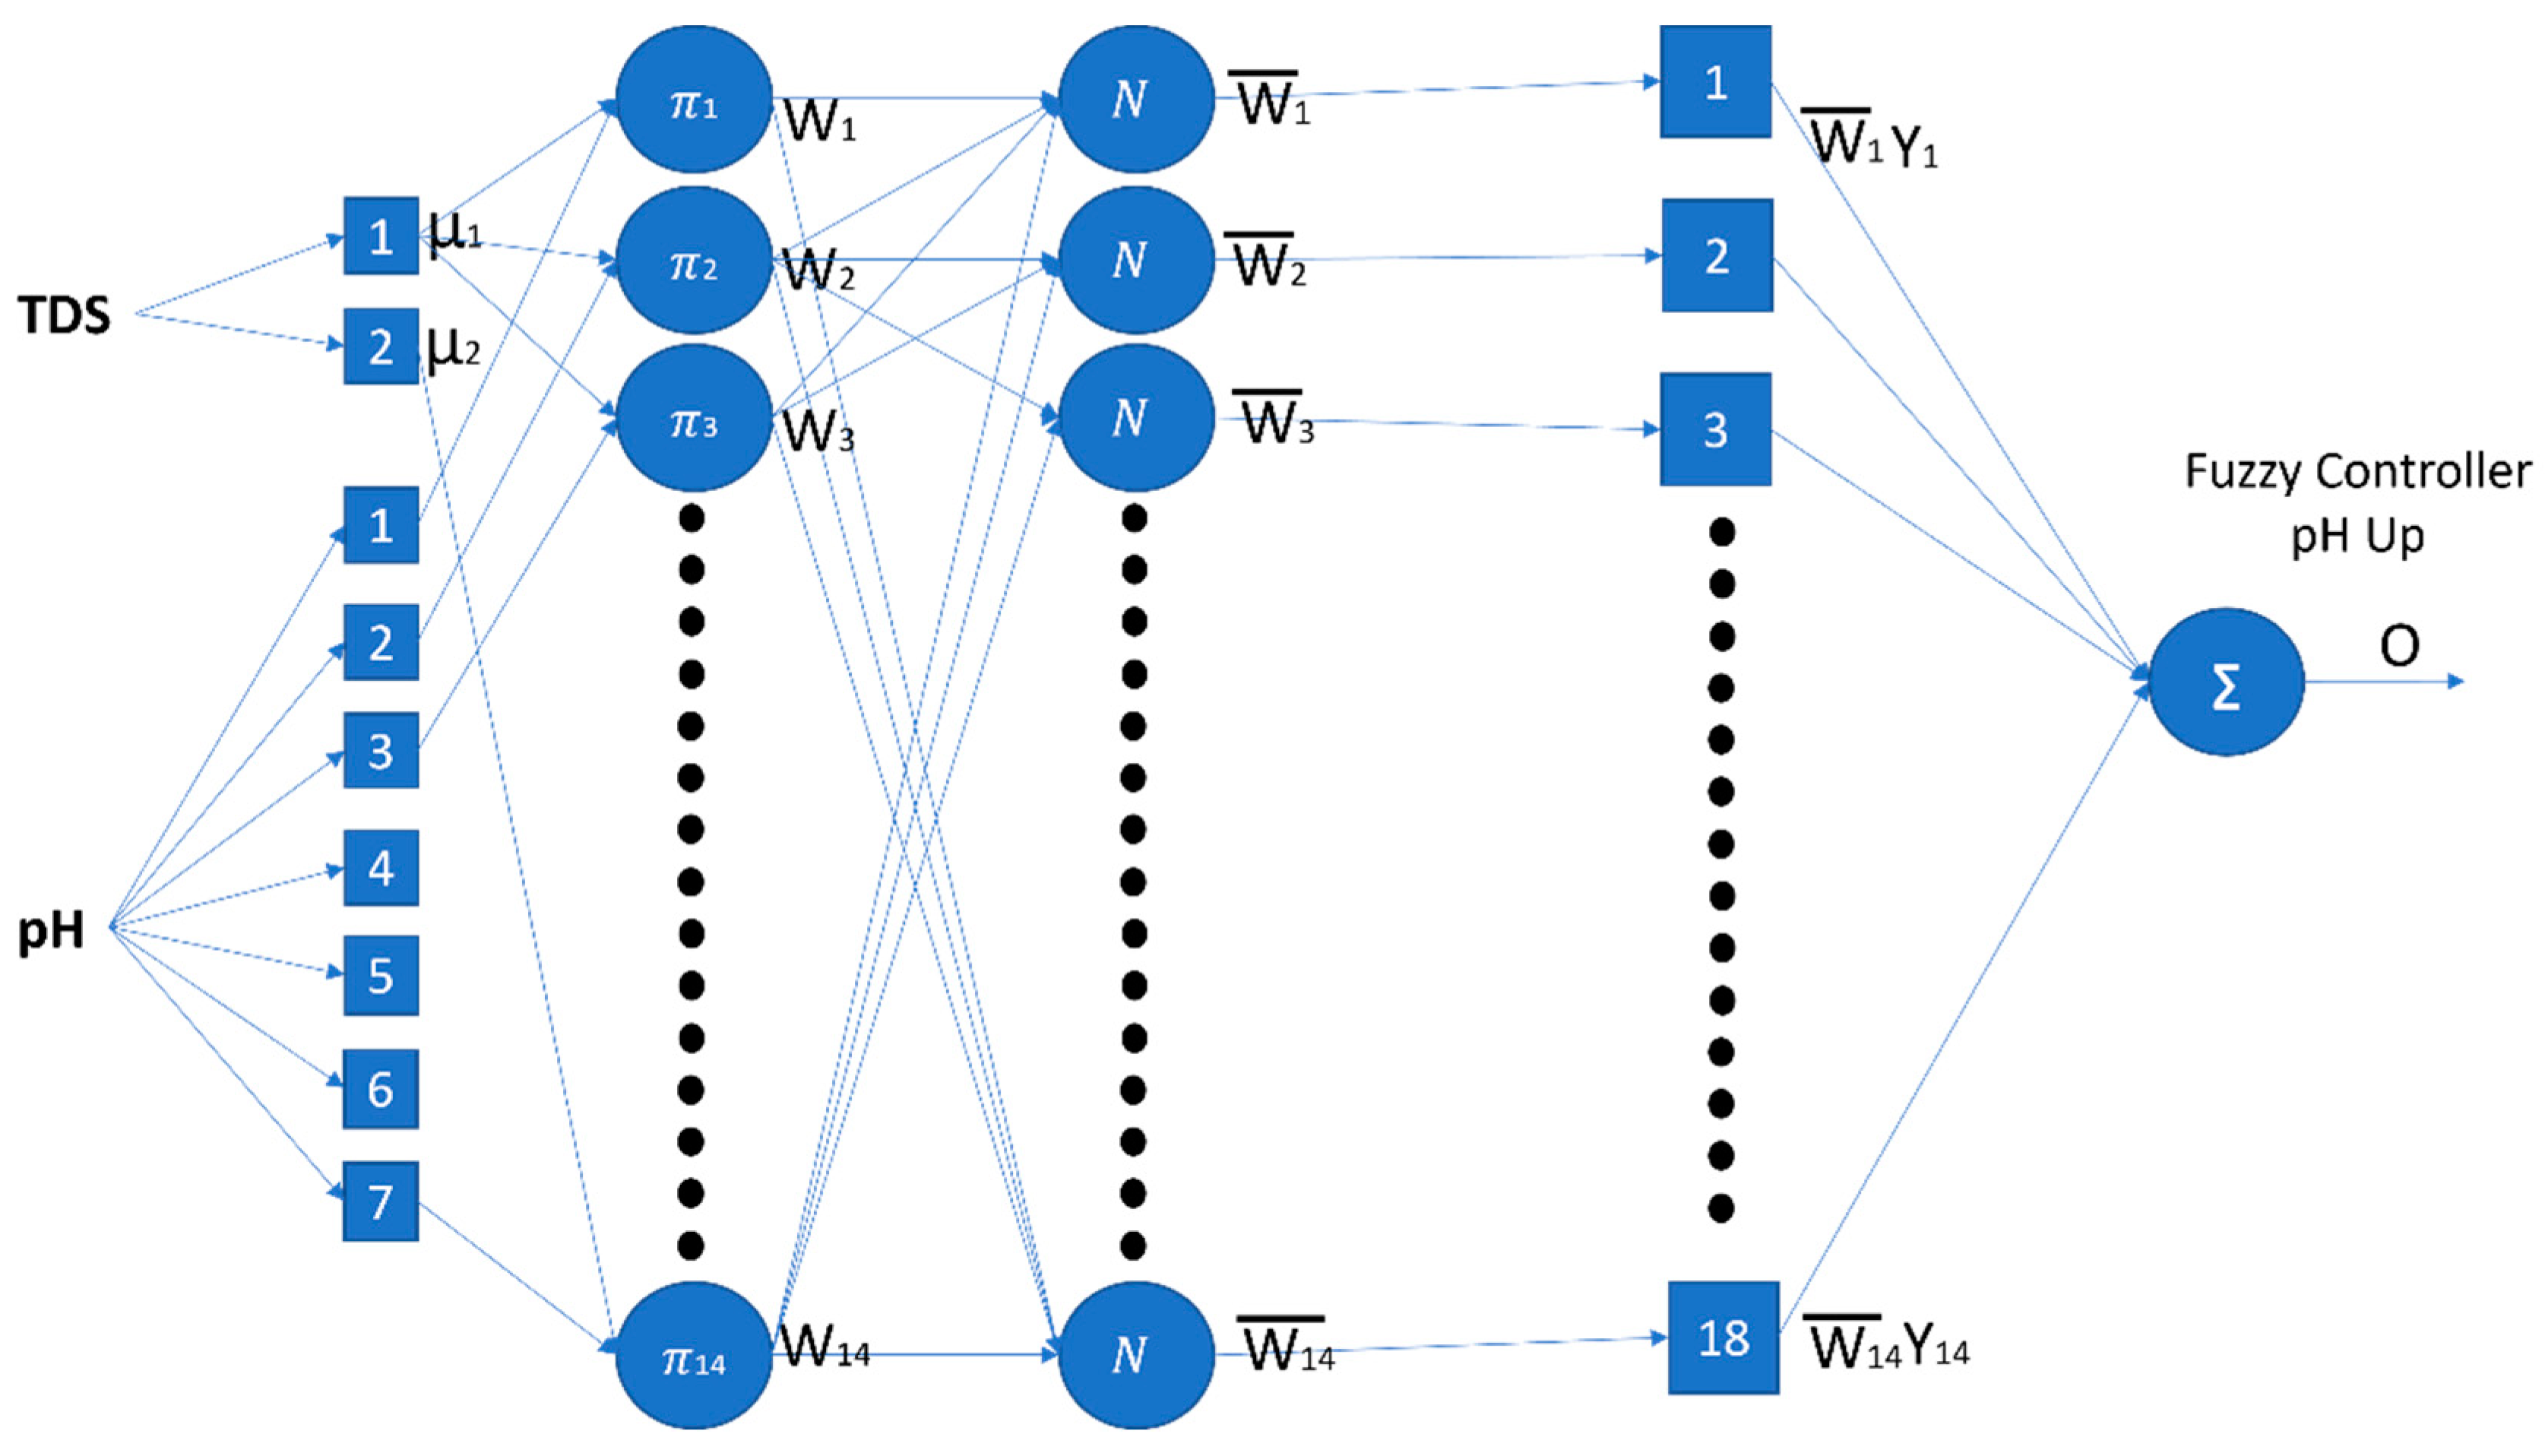
Figure 8. ANFIS pH Up structure.
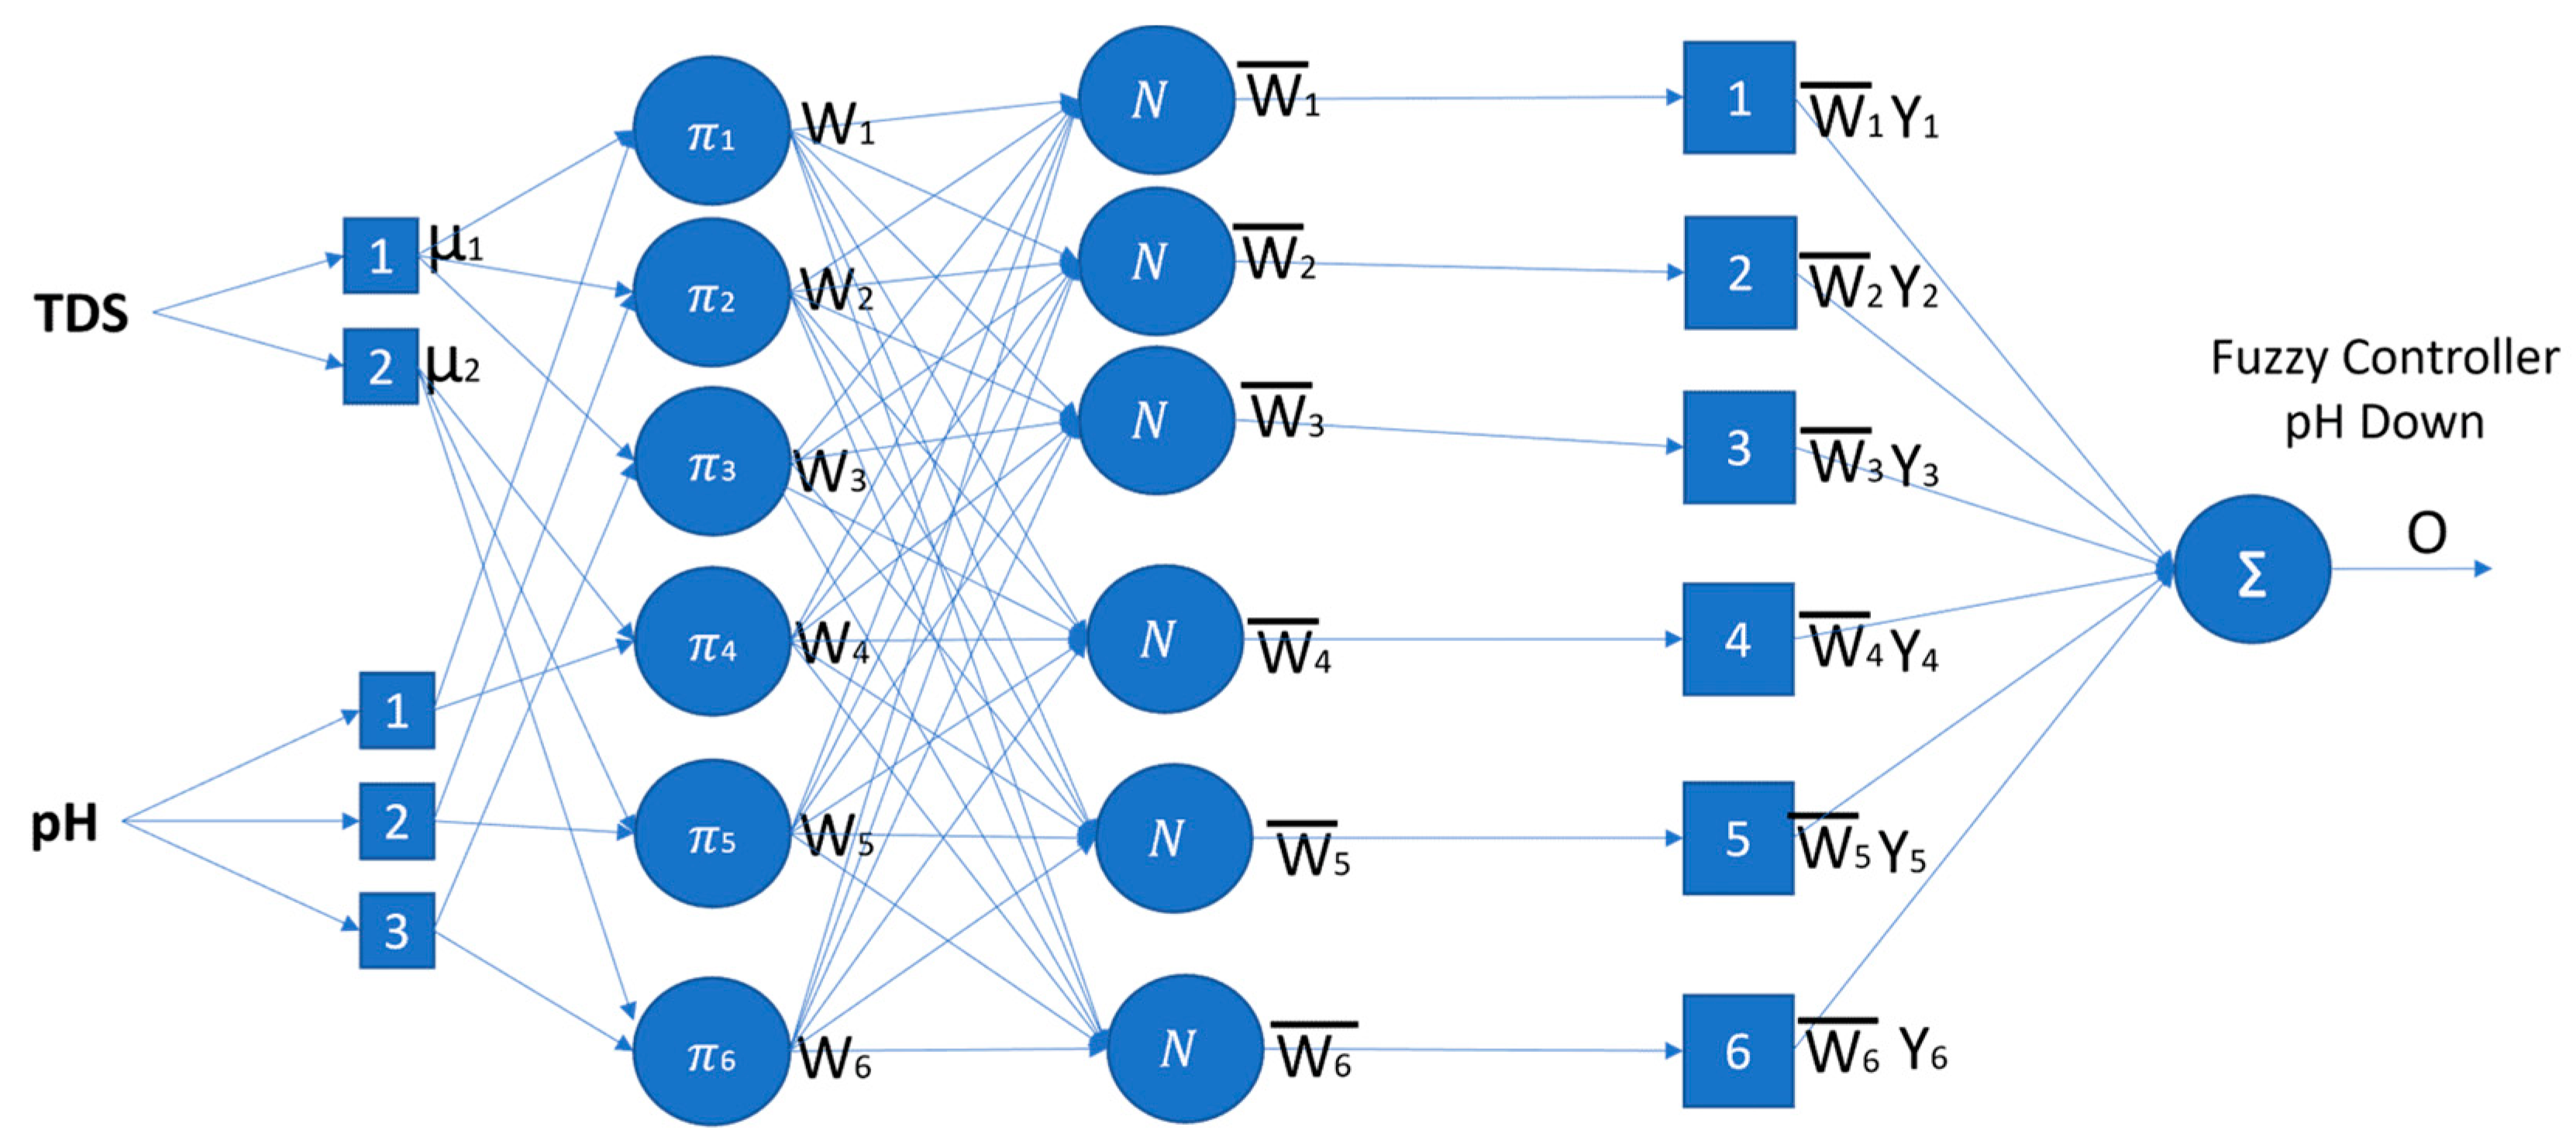
Figure 9. ANFIS pH Down structure.
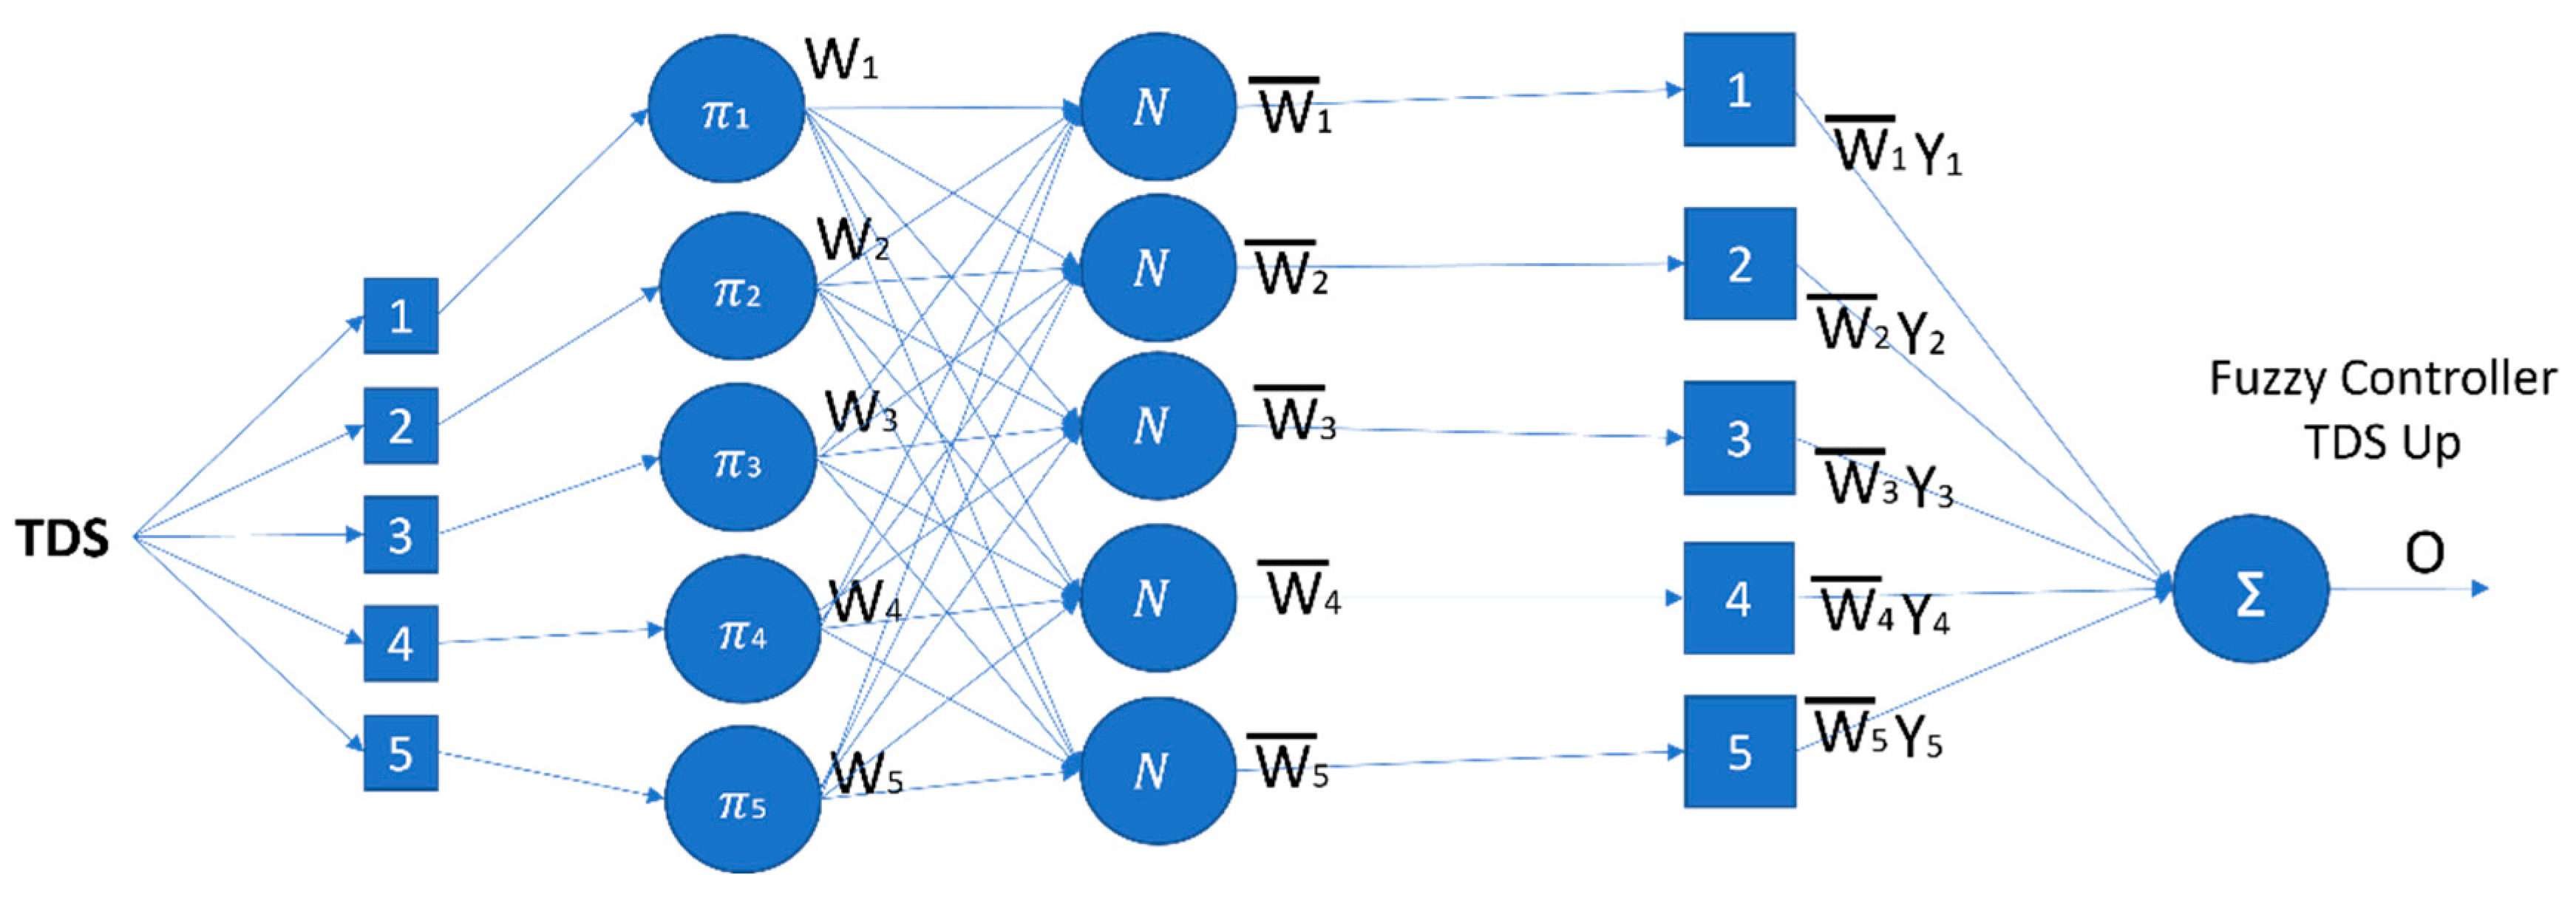
Figure 10. ANFIS TDS Up structure.
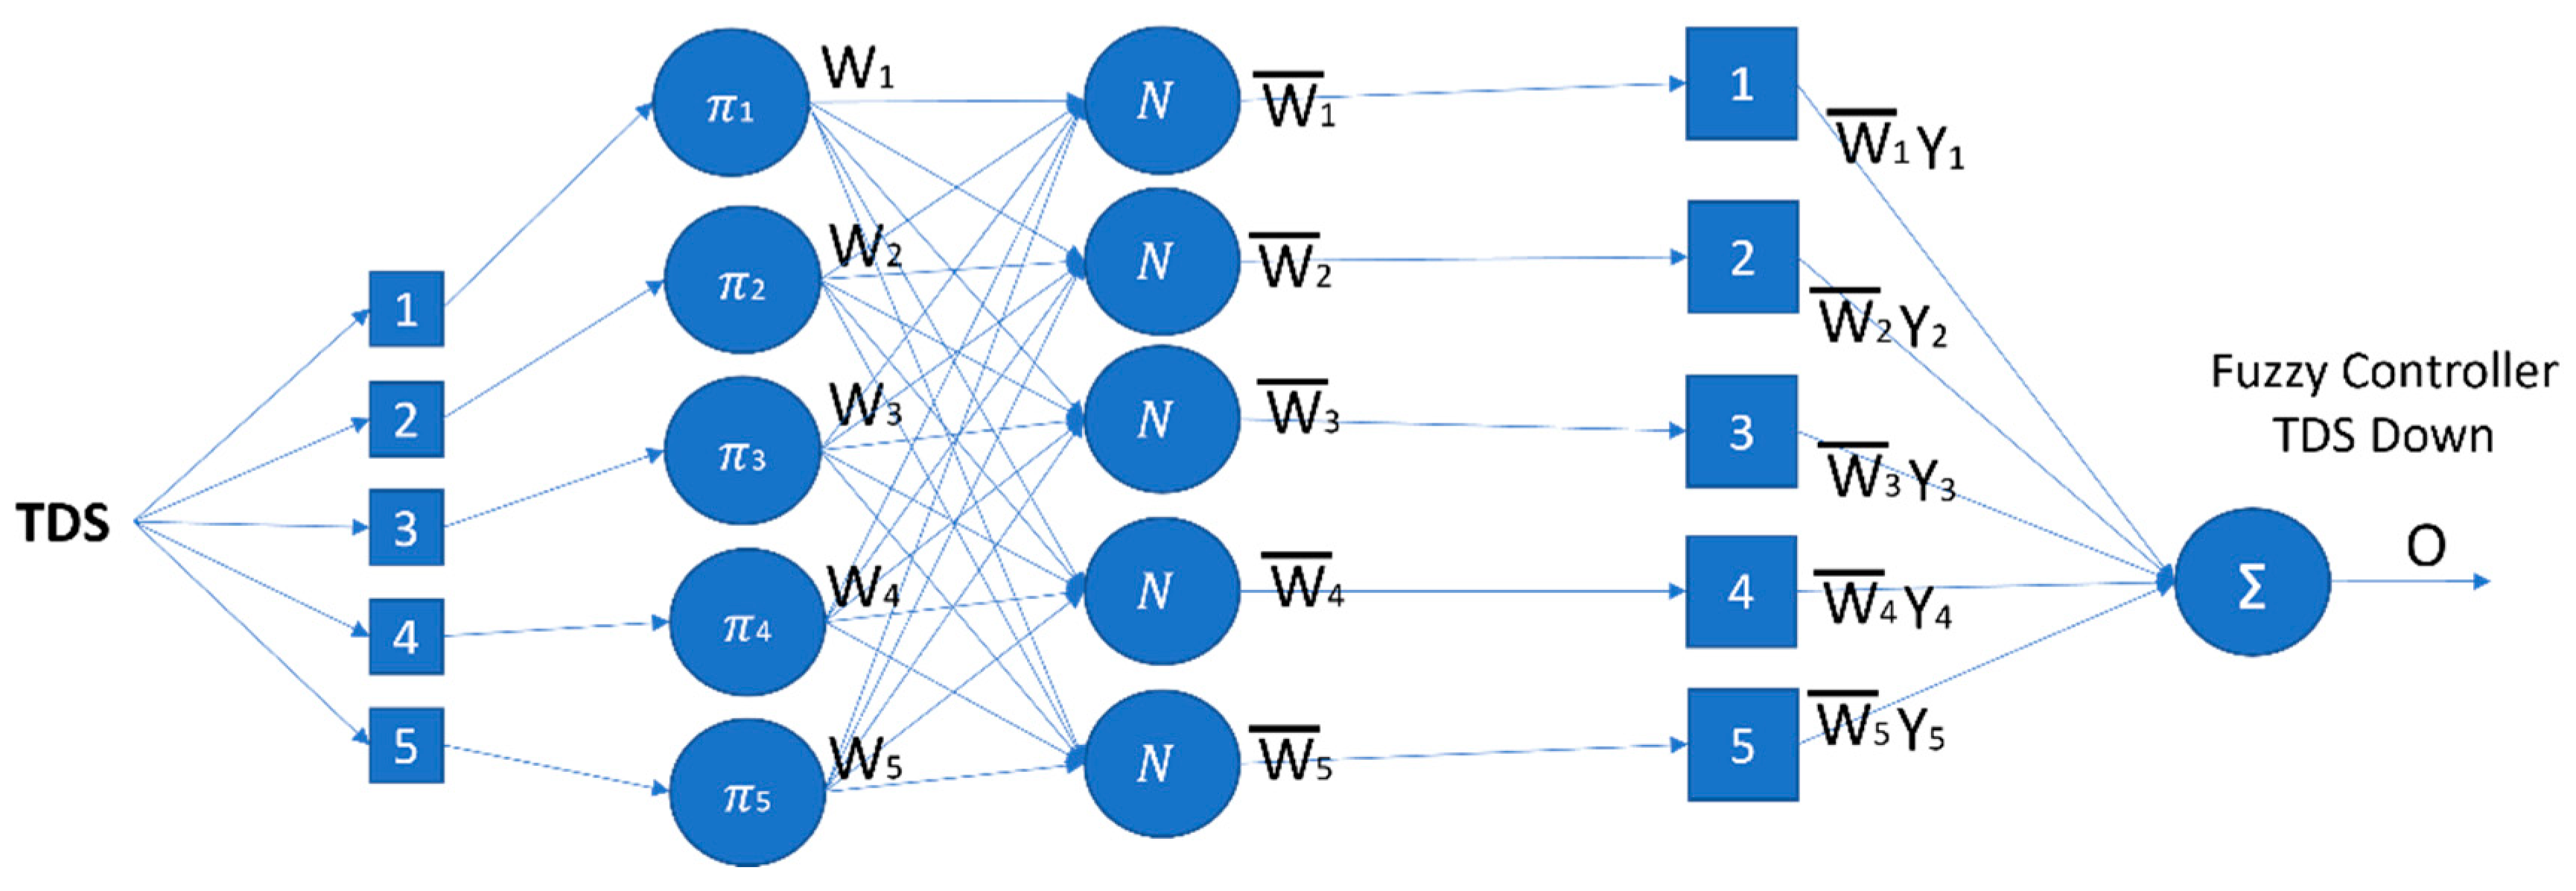
Figure 11. ANFIS TDS Down structure.
Figure 12 shows the system workflow. When the system runs, there will be two processes that run at the same time. The first process is the automatic hydroponic adjustment process. When the time shows that it is measurement time, the initial step is measuring the level of the water inside the reservoir. If the level does not reach the threshold, which is 10 liters, then it needs to be redetermined whether the water level is below the threshold or not. If it is below the determined level, then the water pump to add water into the reservoir will turn on to add water until the water level is at 10 L. Meanwhile, if the water level is not below the threshold, then a validation needs to be carried out again to confirm whether the water is above the threshold. If it is true, then the water pump coming out of the reservoir will turn on to reduce the water in the reservoir until the water level is at 10 L. If the water level is currently at 10 L, then there will be a validation to ensure the status of the water pump that adding water into the reservoir is already off. If the status is still on, then a trigger will be sent to turn the pump off, but if it is off, then there will be a validation sent to ensure the status of the water pump that the function of pumping water out of the reservoir is switched off. If the status is still on, then a trigger is sent to turn off the pump, and if it is off, then the process will continue to measure pH and TDS. Next, an order will be given to Arduino to perform the pH measurement process and TDS measurement process. The captured pH and TDS data will be input into the ANFIS pH model. If the computational results of ANFIS pH is not 0, then the pH needs to be manipulated by adding a pH Up liquid or adding a pH Down liquid until it produces an output result of 0. The next process is TDS evaluation, where the captured TDS data will be computed on the Raspberry based on the created model. If the computation result is not 0, then the dissolved nutrient level will be manipulated by adding nutrient liquids A and B or adding pure water to the reservoir. The process will be performed repeatedly until the computation result is 0.
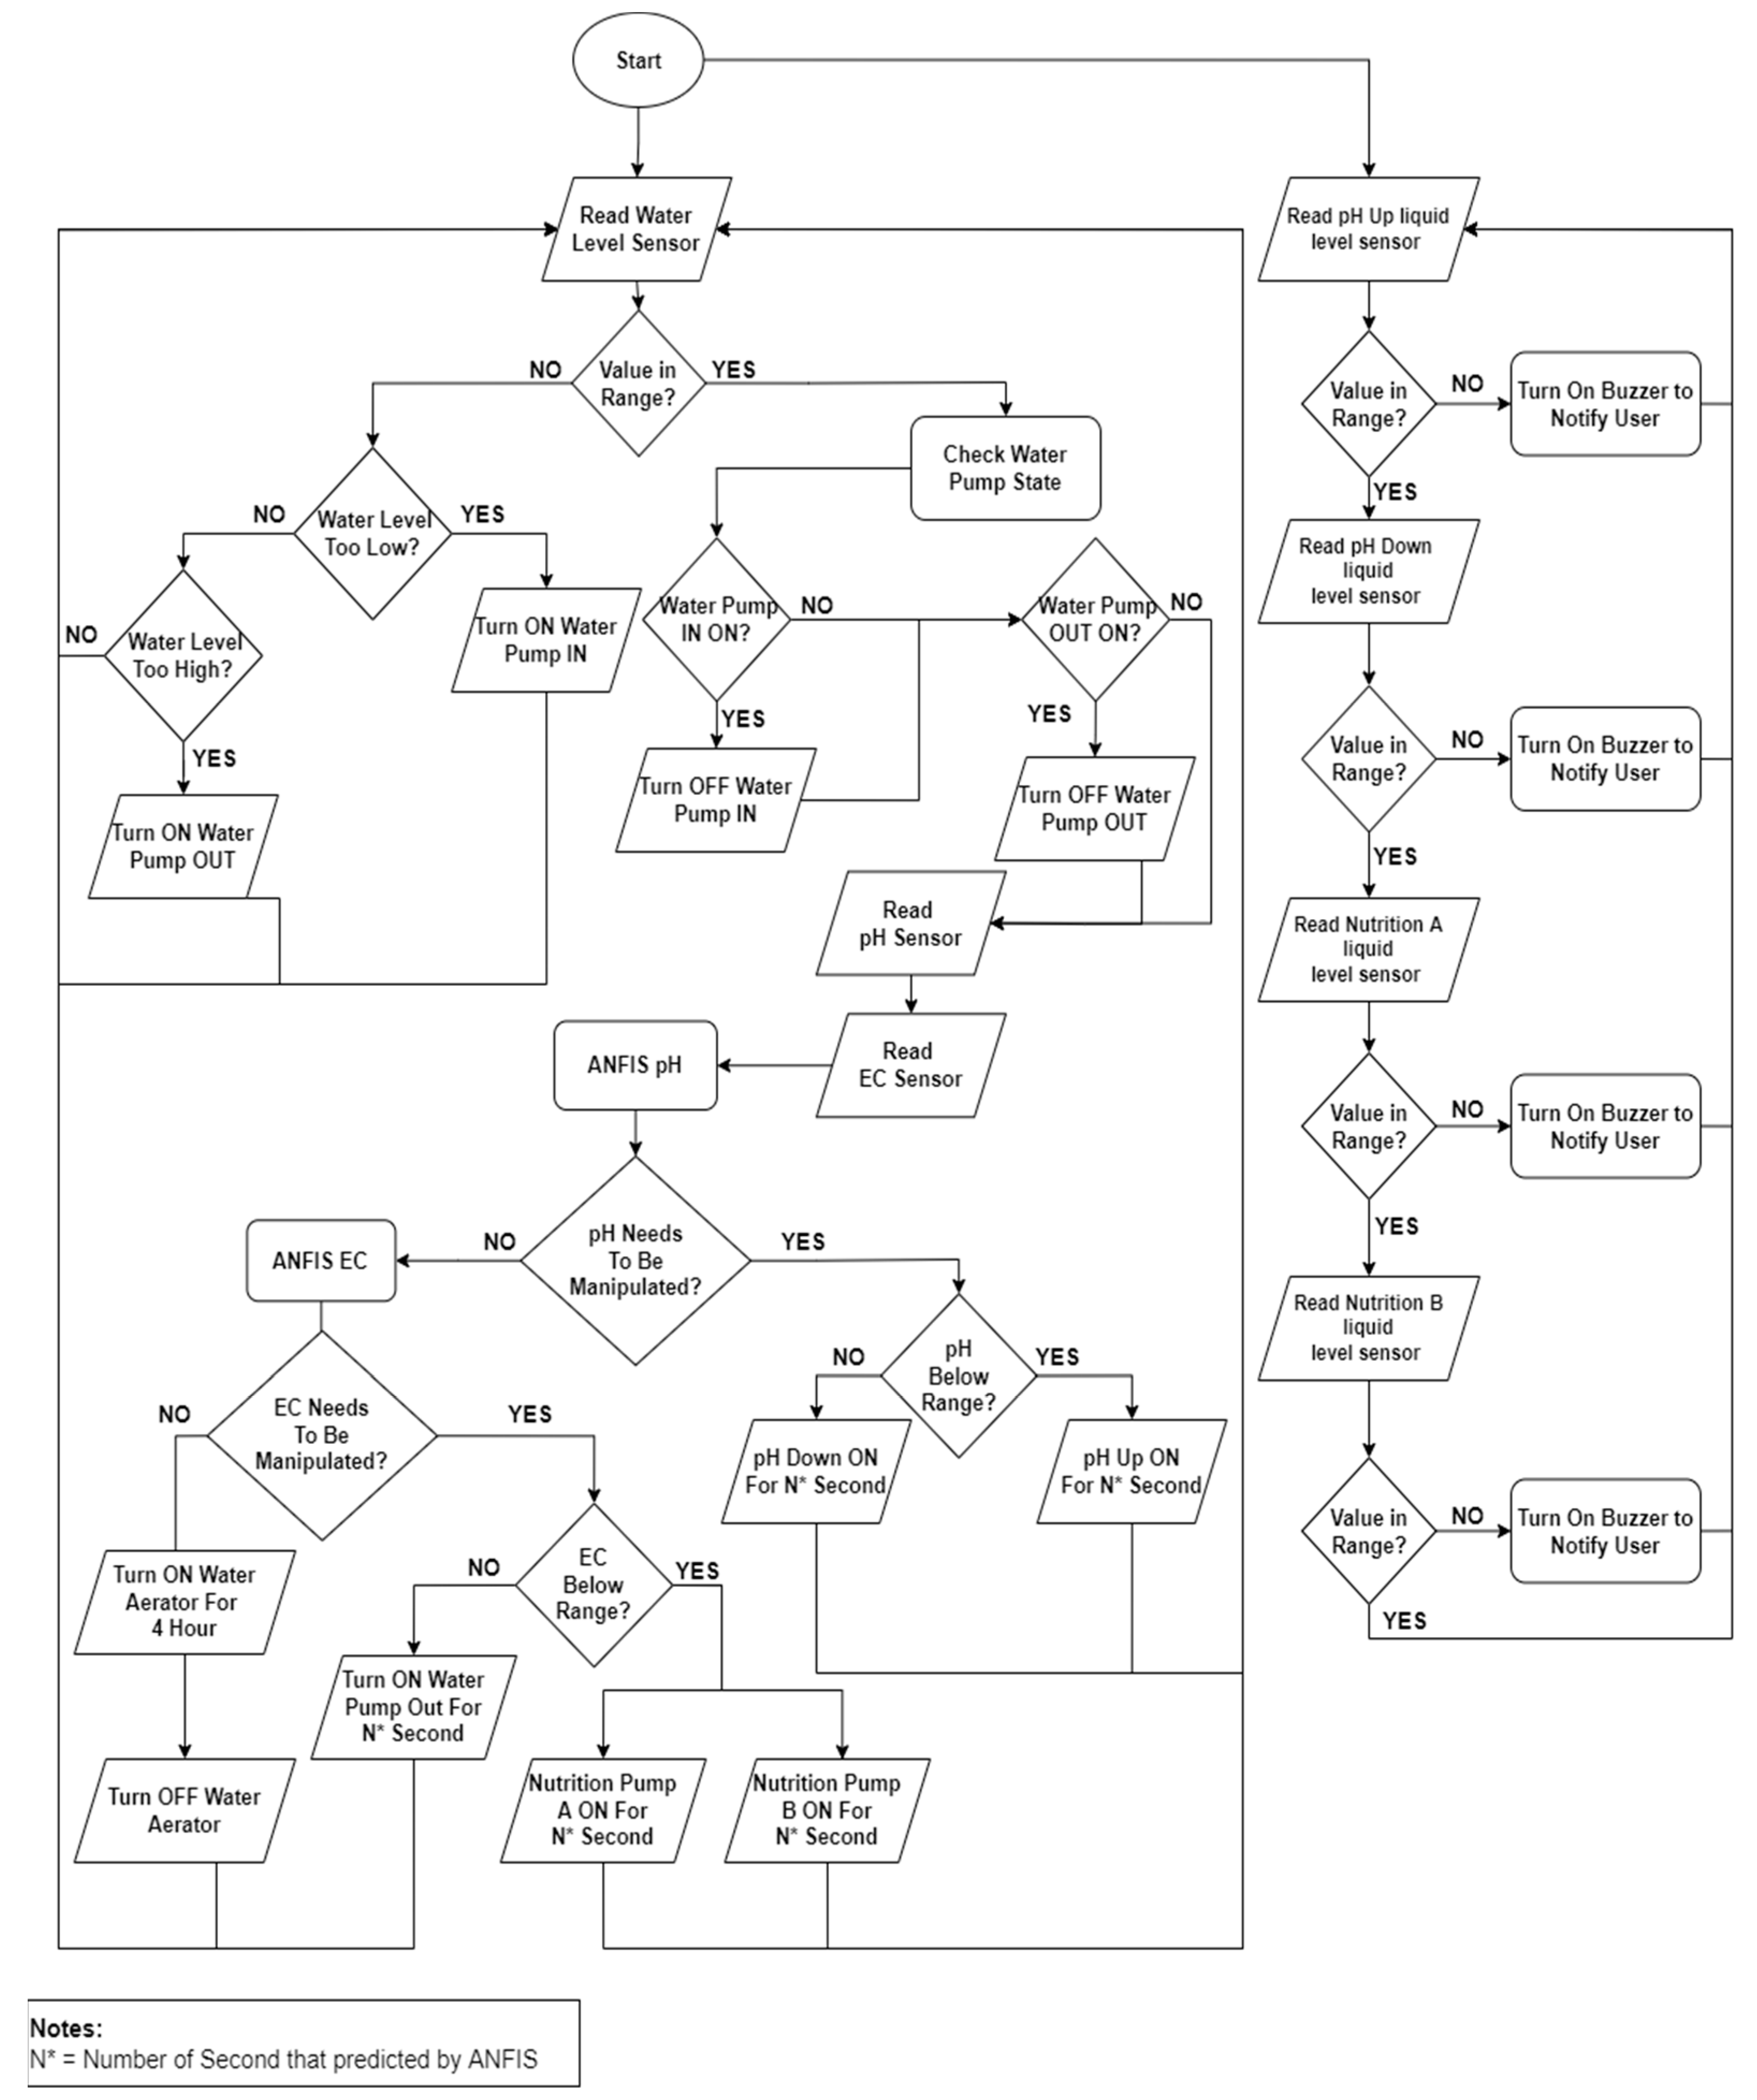
Figure 12. Flowchart system.
The second process is detecting the level of chemical liquid. There are four liquid chemicals used to manipulate the hydroponic system. Each liquid is stored inside a bottle with a height of 12 cm, and above the bottle, an ultrasonic sensor is embedded to measure the height of the liquid level. The first liquid to measure is pH Up. The ultrasonic pH Up sensor will read the liquid level. If the liquid level is below 3 cm, the Piezo buzzer will make a sound to notify the user that the pH Up liquid has run out. However, if the measurement results are above 3 cm, then the next liquid level measurement will continue until the last chemical liquid.
References
- Asaduzzaman, M.; Asao, T. Vegetables; IntechOpen: London, UK, 2018.
- Gashgari, R.; Alharbi, K.; Mughrbil, K.; Jan, A.; Glolam, A. Comparison between Growing Plants in Hydroponic System and Soil Based System. In Proceedings of the 4th World Congress on Mechanical, Chemical, and Material Engineering, Madrid, Spain, 16–18 August 2018; Volume 18, pp. 1–7.
- Roberto, K. How-To Hydroponics; FutureGarden Press: New York, NY, USA, 2005.
- Mehra, M.; Saxena, S.; Sankaranarayanan, S.; Tom, R.; Veeramanikandan, M. IoT based hydroponics system using Deep Neural Networks. Comput. Electron. Agric. 2018, 155, 473–486.
- Alipio, M.; Cruz, A.; Doria, J.; Fruto, R.M. On the design of Nutrient Film Technique hydroponics farm for smart agriculture. Eng. Agric. Environ. Food 2019, 12, 315–324.
- Yolanda, D.; Hindersah, H.; Hadiatna, F.; Triawan, M. Implementation of Real-Time Fuzzy logic control for NFT-based hydroponic system on Internet of Things environment. In Proceedings of the 2016 6th International Conference on System Engineering and Technology (ICSET), Bandung, Indonesia, 3–4 October 2016; pp. 153–159.
- Denai, M.A.; Palis, F.; Zeghbib, A. ANFIS based modelling and control of non-linear systems: A tutorial. In Proceedings of the 2004 IEEE International Conference on Systems, Man and Cybernetics (IEEE Cat. No.04CH37583), The Hague, The Netherlands, 10–13 October 2004; Volume 4, pp. 3433–3438.
- Aguilar, L.; Melin, P.; Castillo, O. Intelligent control of a stepping motor drive using a hybrid neuro-fuzzy ANFIS approach. Appl. Soft Comput. 2003, 3, 209–219.
- Resh, H. Hydroponic Food Production: A Definitive Guidebook for the Advanced Home Gardener and the Commercial Hydroponic Grower; CRC Press: Boca Raton, FL, USA, 2022.
More
Information
Contributors
MDPI registered users' name will be linked to their SciProfiles pages. To register with us, please refer to https://encyclopedia.pub/register
:
View Times:
857
Revisions:
2 times
(View History)
Update Date:
11 Jan 2024
Notice
You are not a member of the advisory board for this topic. If you want to update advisory board member profile, please contact office@encyclopedia.pub.
OK
Confirm
Only members of the Encyclopedia advisory board for this topic are allowed to note entries. Would you like to become an advisory board member of the Encyclopedia?
Yes
No
${ textCharacter }/${ maxCharacter }
Submit
Cancel
Back
Comments
${ item }
|
More
No more~
There is no comment~
${ textCharacter }/${ maxCharacter }
Submit
Cancel
${ selectedItem.replyTextCharacter }/${ selectedItem.replyMaxCharacter }
Submit
Cancel
Confirm
Are you sure to Delete?
Yes
No


