 +1 credit
| Version | Summary | Created by | Modification | Content Size | Created at | Operation |
|---|---|---|---|---|---|---|
| 1 | Sascha von Behren | -- | 3476 | 2023-11-26 19:23:47 | | | |
| 2 | Sirius Huang | Meta information modification | 3476 | 2023-11-27 02:44:26 | | |
Video Upload Options
To make cities more sustainable and livable and to achieve climate targets in transportation, cities around the globe must undergo sustainable transformations. However, disparities in initial conditions pose challenges when trying to implement these sustainable changes. Identifying these differences aids in the comprehension of future developments. Urban archetypes represent a typification of cities in order to investigate mobility-related homogeneity between cities.
1. Introduction
To gain a better understanding of the status quo of urban mobility, a comparison of cities and their different preconditions is necessary. Such an implementation requires a unified and consistent approach. While some studies exist, no comprehensive comparative database currently focuses specifically on motorized individual mobility and its role within urban areas.
In the following an overview of existing segmentations of cities is given. All these approaches focus mainly on one or two dimensions of urban living. Besides these existing approaches, a new comprehensive approach of so-called urban archetypes is introduced that captures multiple dimension of urban living to segment cities around the world2. Existing Segmentations of Cities
Clustering is a common and scientifically valid approach when investigating differences and commonalities between cities. Various approaches pursue the goal of creating groups of cities that are as homogeneous as possible with the greatest possible heterogeneity between the groups.
The indicators within the described segmentation approaches below can be summarized into five indicator dimensions: 1. Socio-economic indicators provide information on a city’s economic development and its influence on social, political, ecological, and spatial processes. 2. Socio-demographic indicators enable a more precise description of the urban population, its social structure, and the regional level of development of a city. 3. Geographical input values describe the spatial layout of a city. Hereby, the orientation of the transport network or divergent land use are established measures for segmentation. 4. Mobility-related indicators describe the dependence on individual modes of transport or congestion of the regional infrastructure. These form essential indicators in earlier clustering approaches. Especially urban mobility is of central importance in this work. Finally, 5. Psychographic indicators map subjective motives within the urban population. This dimension is key to achieving a holistic view of urban areas.
Figure 1 gives a non-exhaustive overview of the different segmentation approaches, facilitating a better comprehension of the various indicator dimensions. Missing arrows to individual groups do not mean that such approaches do not exist. In the following, an overview of existing segmentations of cities is given. Often, a clear separation of approaches is only possible to a limited extent.2.1. Industrial Function of Cities
More than 80 years ago, Harris [3] was the first researcher to empirically differentiate 984 American cities based on national employment statistics. Using a rule-based cluster algorithm, cities were assigned to one or multiple of the following classes, defining their core industrial functions: Manufacturing, Transportation, Tourism, Wholesale, Retail, Education, Mining, or Diversified. This clustering method established itself as a standard procedure in subsequent studies [4][5].
2.2. Urban Prosperity
Bruce and Witt [6] supplemented this analysis of socio-economic indicators with socio-demographic parameters; their analysis resulted in 13 distinct city types. Similar analyses of urban prosperity are still relevant to this day [7][8][9]. Hill et al. [8], for example, implemented a segmentation of 508 cities to analyze the regional distribution of wealth across the US. Furthermore, Martin et al. [9] describe a segmentation of 300 cities to support state-level policy decisions. Cities within the same cluster are supposed to react as similarly as possible to fiscal interventions.2.3. Urban Shape
In addition to various economic classifications, other approaches provide information on the different geographical features to describe the spatial patterns, layouts, and structures that characterize a city [10][11][12][13]. Huang et al. [11] identified seven spatial metrics to describe said measures of urban shaping using satellite imagery from 77 cities. The four city types that emerged in the process indicate urban shapes that vary greatly depending on their region. Thompson [12] used data from 30 megacities to illustrate how different urban systems attempt to solve local traffic problems. The five archetypes, Full Motorization, Weak Centre, Strong Centre, Low Cost, and Traffic Limitation, define distinct forms of urban infrastructure.2.4. Quality of Urban Mobility
A growing body of available data and methodological developments continues to provide new insights into various areas of urban research. For example, Kenworthy and Laube [14] published the Millennium Cities Database for Sustainable Transport, the first international comparison of cities based on a wide range of indicators of urban mobility. The data collection from the year 1995 contains 230 standardized indicators from 100 cities. In addition to analyzing the sustainability of various urban transport systems in Kenworthy [15], the Millennium Cities Database forms the data basis of various other studies [16][17]. Based on the database, Priester et al. [18] identified 13 relevant factors for the quantitative mapping of urban mobility in 41 megacities. These factors include car dependency, traffic fatalities, traffic congestion, and public transit use. The study lists a total of seven city typologies: Paratransit Cities, Auto Cities, Non-Motorized Cities, Hybrid Cities, Traffic-Saturated Cities, Low-Motorized Cities, and Transit Cities. Oke et al. [19] presented one of the most comprehensive urban segmentations in mobility research, subdividing 331 cities in 124 countries. Relevant indicators include urban shaping, economic performance, and urban mobility behaviors. The broad spectrum of the study is intended to support a large number of actors from politics and business in the development of new mobility solutions and an associated reduction in emissions. In total, the study presents 12 clusters.2.5. Urban Mobility Cultures
A segmentation on a national level can be found in Klinger et al. [20]. The study used data from 44 German cities to cluster different “urban mobility cultures”. In addition to established dimensions such as the socio-demographic and economic characteristics, as well as the travel behavior of the population, the study additionally considered various psychographic indicators to represent the subjective dimensions of urban mobility. Subjective dimensions are described as those characteristics whose assessment depends exclusively on the individual perception of the surveyed population. The multidimensional consideration of objective and subjective indicators describes, in part, strong contradictions between using certain mobility offerings and their general association in the population. However, the lack of comparable psychographic data collection essentially prevents a comparison within international studies.2.6. Smart and Sustainable Cities
The role of urban sustainability and energy use is also the focus of several other classifications. Shell [21] used six city archetypes to forecast future urban energy demand. Acuto et al. [22] analyzed sustainability-promoting measures in terms of their sectoral and economic origins. Cantuarias-Villessuzanne et al. [23] identified three “smart city strategies” based on seven predefined “smart city dimensions” [24].2.7. Urban Market Analysis
In addition to the areas of use illustrated so far, cluster analyses possess a high relevance in the business development context. The procedure is often used to identify suitable target markets for new products and services [25][26][27]. For example, Lang et al. [26] used an analysis of the urban spatial structure and socio-economic parameters to identify suitable cities for the deployment of autonomous vehicle fleets.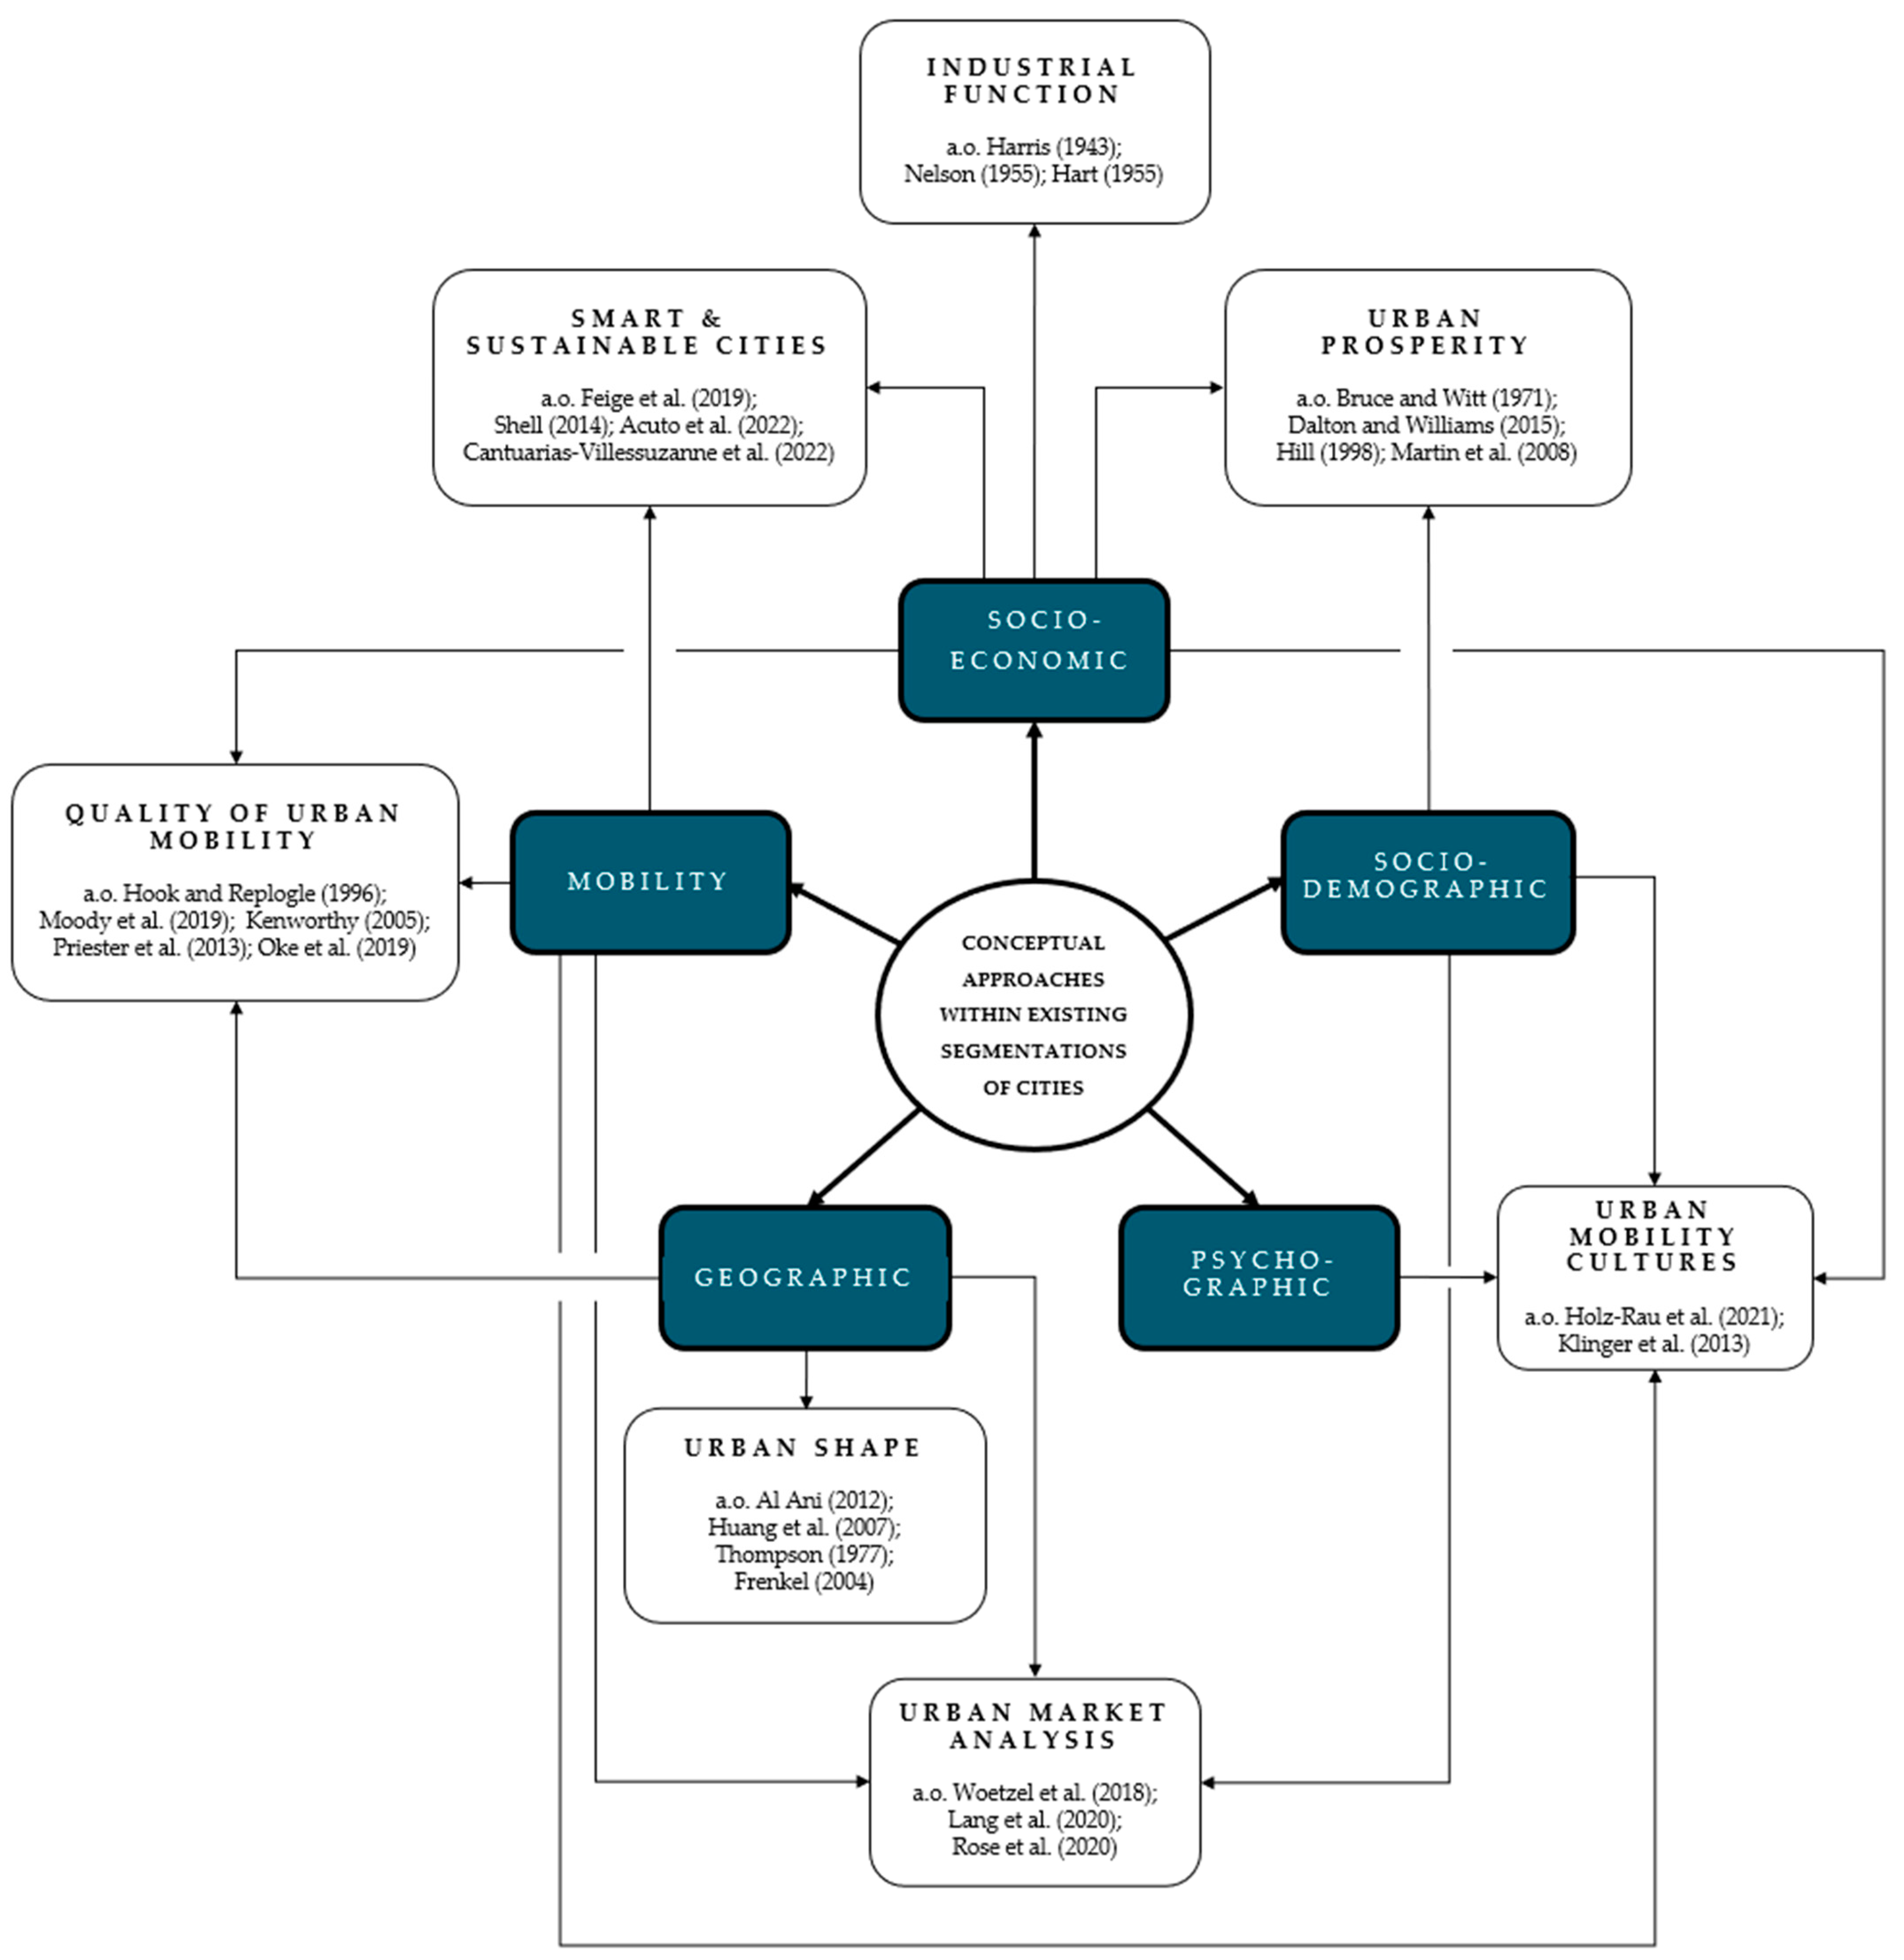
3. Decoding Nine Unique Urban Archetypes
Based on the literature review of existing approaches a new comprehensive approach with multiple indicator dimensions is developed. With the aim of achieving the most comprehensive segmentation possible, a cluster analysis of an international selection of cities is carried out. The main steps in determining a suitable solution are the selection of relevant indicators, their reduction to principal components and the implementation of a k-means clustering procedure.
The selected indicators encompass all five indicator dimensions in the literature review, namely socio-economic, socio-demographic, psychographic, geographic, and mobility (see Table 1). Notably, all values, except psychographic indicators, pertain to the corresponding administrative levels of the examined cities. In total, a set of 96 cities was found to provide sufficient data and serves as our initial base for segmentation.
Table 1. Overview of the indicators used in the clustering process.
Indicator |
Unit / Range |
Description |
Year |
Source |
|
Mobility Dimension |
||||
|
Micromobility sharing options |
0-3 |
Number of categorically different micromobility offerings within a city |
2023 |
NUMO [28] |
|
Modal split bike |
% |
Share of trips made by bicycle |
2017-2020 |
UITP [29] Dixon et al. [30] |
|
Modal split car |
% |
Share of trips made by car |
2017-2020 |
UITP [29] Dixon et al. [30] |
|
Modal split public transit |
% |
Share of trips made by public transit |
2017-2020 |
UITP [29] Dixon et al. [30] |
Motorization rate |
0-9999 |
Average number of registered cars per 1,000 inhabitants |
2018-2021 |
Eurostat [31] Cities official statistics |
|
Numbeo traffic index |
0-1000 |
Composite index of time spent in transit and the corresponding dissatisfaction with time spent traveling |
2023 |
Numbeo [32] |
|
Time lost in traffic |
% |
Additional time spent on transport due to traffic compared to a city's baseline conditions without congestion. |
2022 |
TomTom [33] |
|
Geographic Dimension |
||||
|
Built-up area per capita |
m2 |
Area built up by covered surfaces per capita |
2015 |
European Commission [34] |
|
Geographical agglomeration |
% |
Size of a city's urban area, including connectivity to nearby cities and suburbs. 100% indicating a densely populated area and 0% implicating an isolated location of the city |
2023 |
OpenStreetMap [35] |
|
Urban street network orientation
|
% |
Quantifying a city's adherence to a single grid road network, with 100% indicating full adherence to geometric principles and 0% indicating no adherence at all. |
2019 |
Boeing [36] |
|
Socio-economic Dimension |
||||
|
Access to public transit |
% |
Share of population with access to a public transit stop within walking distance (500 meters for buses and/or 1000 meters for rail-based services) |
2020 |
UN Habitat [37] Data-Driven EnviroLab [38] |
|
Buildings over 35m per 1,000,000 inh. |
0-1000 |
Number of buildings with a height of more than |
2023 |
Skyscraper Source Media [39] World Population Review [40] |
|
CO2 emissions per capita |
t |
A city's carbon emissions per capita |
2018 |
Moran et al. [41] |
|
Cost of living index |
0-200 |
Living cost compared to the average cost of living in New York City (=100). A city with a cost of living index of 120 is estimated to be 20% more expensive than New York City |
2023 |
Numbeo [32] |
|
Gini coefficient |
% |
Measure of statistical dispersion intended to represent income or wealth inequality |
2022 |
The World Bank [42] |
|
GRP per capita |
$ |
Monetary measure of the market value of all final goods and services produced and sold per resident |
2021 |
Neffke et al. [43] |
|
Innovation index rating |
0-60 |
Assessment of the baseline conditions for innovation in a city, including digital transformation, technology applications, startups, sustainability and others |
2022 |
2thinknow [44] |
|
License caps
|
0; 1 |
Existence of regulatory policies limiting the issuance of new license plates to residents |
2020 |
Zhuge et al. [45] |
|
Metro stations per 1,000,000 inh. |
0-1000 |
Number of metro stations per 1,000,000 inhabitants |
2023 |
Rohde [46] World Population Review [40] |
|
Monthly costs of public transit |
$ |
Cost of a monthly pass for the usage of public transit |
2023 |
Numbeo [32] |
|
Rail network length per 1,000 inh. |
m |
Total length of all tracks of a city's railway network (metro and tram) per inhabitant |
2023 |
Rohde [46] World Population Review [40] |
|
Road pricing |
0; 1 |
Existence of charging mechanisms for the use of parts of the urban road network |
2023 |
Sadler Consultants [47] |
|
Student city index |
0-100 |
Assessment of the best urban destinations for international students |
2023 |
Quacquarelli Symonds [48] |
|
Traffic fatalities per 100,000 inh. |
0 -100,000 |
Number of annual traffic fatalities per 100,000 inhabitants |
2022 |
ITF [49] |
|
Socio-demographic Dimension |
||||
|
Population growth per year |
% |
Annual increase in the number of inhabitants within a city |
2023 |
World Population Review [40] |
|
Psychographic Dimension |
||||
|
Individualism index* |
0-100 |
Quantification of the preference for a loose social fabric in which the individual only cares for himself and one's immediate family |
2001-2020 |
Hofstede Insights [50] |
3.1. Description and Interpretation of the Urban Archetypes
Based on the cluster analysis, the 96 cities can be divided into nine clusters. In the following step, these "urban archetypes" are described quantitatively as results based on the values of their main components and cluster-forming variables. To facilitate a better understanding of the cluster solution, the content analysis of each cluster is followed by a brief interpretation of the data. Additionally, Figure 2 provides an overview of the manifestation of the five primary components in each urban archetype and highlights some pertinent cluster representatives.
Cluster 1: Well-Functioning Cities (n = 18)
Well-Functioning Cities have the lowest traffic saturation of all clusters. This high efficiency of the urban infrastructure is also reflected in other factors. The cluster has a high degree of maturity of the transport system. This factor is influenced, among other things, by the most widely developed public transport and safest road transport. Characteristic of Well-Functioning Cities is a balanced distribution in the use of cars, public transport, cycling and walking. This diversity of relevant mobility offers is complemented by the widest range of micro mobility services. It can be assumed that the high degree of multimodality in this cluster contributes significantly to a reduction of road traffic. A safe transport system designed for the use of all modes of transport contributes significantly to the efficiency of the infrastructure.
Cluster 2: Ancient Hybrid Cities (n = 18)
The second cluster is characterized by the highest maturity of its transport system. Despite one of the highest access rates to public transport, this archetype has a relatively high motorization rate, which speaks for its hybrid character. In addition, cities in this group, with a high value for geographical agglomeration, are often rather isolated from other urban areas. The interplay of the aforementioned factors points to a remaining relevance of the private car outside the city borders. Lack of long-distance transport options has a potentially countervailing effect on car use. This cluster is named after narrow, densely built-up ancient city centers. The strong expansion of public transport with a remaining share of car use leads to the further designation of the cluster as dense Ancient Hybrid Cities.
Cluster 3: Transit Cities (n = 7)
The use of public transport is ubiquitous in Transit Cities. The group is differentiated by a low car dependency combined with a high level of prosperity and innovation. With an average of only 21.7% of all trips made, the car plays only a marginal role in urban transport. In contrast, the highest public transport usage rate of all clusters is over 50 %. Road pricing is used in a large proportion of the cluster. The provision of an area-wide usable public transport service is associated with high monetary costs. The high economic performance of Transit Cities facilitates their ability to act in this regard. The existence of strong regulatory measures to restrict car use indicates a politically driven shift to public transport.
Cluster 4: Auto-Cities (n = 8)
The fourth cluster forms the mental counterpart to the previously mentioned Transit Cities. In Auto-Cities, the car stands out as the only relevant mean of transport, accounting for over 75% of all trips. The cluster is characterized by the highest car dependency of all archetypes. This results, among other things, from the highest motorization rate and a strongly geometrically ordered road network. The high car dependency of the cluster suggests a high associated congestion. However, due to its infrastructure specifically designed for car use, the level of traffic saturation in this cluster remains moderate.
Cluster 5: Hybrid Commuter Cities (n = 8)
Hybrid Commuter Cities are characterized by high prosperity and innovation as well as high quality public transport. Despite a broad mobility offer, the cluster is characterized by a high car dependency. Similar to the Auto Cities, car use determines urban traffic patterns. In contrast to cluster 4, the high car use is a major burden on the infrastructure. This is reflected in the form of increased traffic saturation. This problem does not go unnoticed by the population. Dissatisfaction with urban congestion is high. Like public transport cities, the high economic importance of Hybrid Commuter Cities suggests a wide range of possibilities in the design of the public transport system. These are mainly applied in the expansion of the urban rail network. The fact that only 76% of the population has easy access to public transport, despite a high quality of public transport, indicates a strong concentration of the rail network in the inner districts of the cities. The high remaining relevance of the private car can also be deduced from this. Due to insufficient mobility alternatives in outer districts, easy access to the city center is only possible by using the car.
Cluster 6: Dynamic Megacities (n = 5)
The exclusively Chinese Dynamic Megacities have a markedly low car dependency. However, attractive mobility alternatives can only be found to a limited extent. The cluster has the lowest level of maturity of the transport system. Walking and public transport dominate urban mobility, accounting for more than 60% of all trips. Almost all cluster members use registration restrictions to regulate car numbers, so this urban archetype has the lowest motorization rate in a city comparison,. The interaction of low car dependency and low maturity of the transport system indicates that the transport infrastructure is overstretched. A core challenge of this group of cities is to accommodate a growing number of cars. It can be assumed that the frequently used registration restrictions serve the purpose of regulating a high demand for car use among the population and enabling the simultaneous expansion of a car infrastructure.
Cluster 7: Car and Bus Cities (n = 11)
Characteristic for Car and Bus Cities is the absence of any rail transport. The absence of a mobility offer detached from road traffic is reflected in the negative quality of public transport. Mostly, public transport in this cluster is covered by buses. The most relevant mean of transport remains the car. More than half of all trips are made by car. The poor development of the rail network in Car and Bus Cities is possibly related to a lack of rail connections, also at the national level. In many cases, poor interregional connections in the cities require the ownership of a car and thus have a positive effect on car dependency.
Cluster 8: Paratransit Cities (n = 12)
Paratransit Cities are characterized by the lowest level of prosperity and innovation as well as by a low degree of maturity of the transport system. The latter is determined, among other things, by a minimal coverage of public transport and high fatalities in road traffic. Compared to other city types, the quality of public transport is also low. In addition to the previously mentioned indicators, this cluster performs at the lower end of a number of other categories. These include the Gini coefficient, micro mobility offers and the length of the urban rail network. The cluster is characterized by a rapid increase in population. This is one of the core challenges for Paratransit Cities. The simultaneous poor development of urban infrastructure indicates that cities in this cluster are not able to cope with their own growth. Often, privately organized mobility services are the entrepreneurial response to the inefficiency of public transport infrastructure. As a result, Paratransit Cities are likely to face complications in fulfilling their socio-spatial function.
Cluster 9: Traffic-Saturated Cities (n = 9)
The last cluster has the highest traffic saturation of all urban archetypes. Despite a low car dependency, the infrastructure in cities in this group regularly reaches its capacity limits. Public transport is an important pillar of urban mobility, accounting for just under half of all trips. However, due to a low level of development of rail transport, it can be assumed that this is primarily served by buses. In contrast to cluster 7, the lack of mobility offers detached from road transport in this type leads to major challenges for the urban infrastructure. Few alternatives for other modes of transport direct all traffic onto the road network. In this way, avoiding traffic jams is almost impossible. Traffic-Saturated Cities describe a mobility system at its capacity limit.

Figure 2. Expressions of the five principal components in each urban archetype.
3.2. Geographic Distribution of the Urban Archetypes
The geographic distribution of the nine urban archetypes exhibits substantial heterogeneity within the locations of their associated cities. Figure 3 illustrates an accumulation of Well-Functioning and Ancient Hybrid Cities located in Europe, which also encompasses a diverse mix of Transit Cities as well as Car and Bus Cities. Auto Cities and Hybrid Commuter Cities are predominantly situated in North America, while all South American cities fall within the Traffic-Saturated categorization. Paratransit Cities predominantly exist in eastern regions, with a few individual representatives in Africa. The highest degree of regional concentration is observed in the exclusively Chinese Dynamic Megacities cluster. Most of the remaining cities are categorized as Transit Cities and Car and Bus Cities, with the latter primarily concentrated near coastal areas.
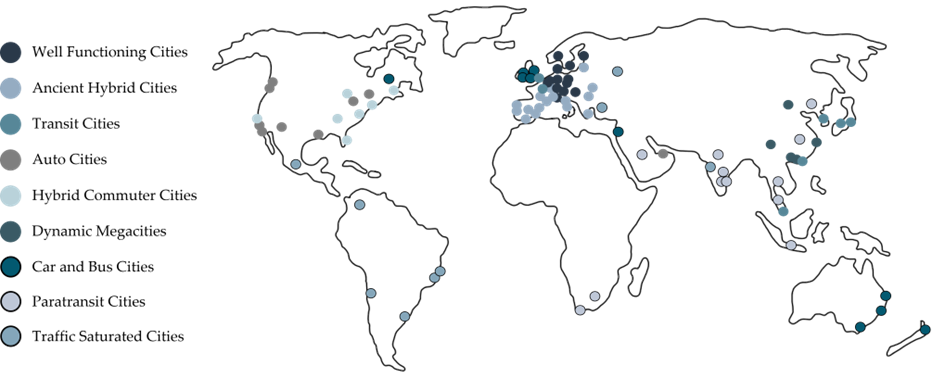
Figure 3. Geographical location of the nine clusters.
References
- United Nations. World Urbanization Prospects: The 2018 Revision; United Nations: New York, NY, USA, 2019; ISBN 978-92-1-148319-2.
- OECD Publishing. International Transport Forum ITF Transport Outlook 2021; OECD Publishing: Paris, France, 2021.
- Harris, C. A Functional Classification of Cities in the United States. Geogr. Rev. 1943, 33, 86–99.
- Nelson, H. A Service Classification of American Cities. Econ. Geogr. 1955, 31, 189–210.
- Hart, J.F. Functions and Occupational Structures of Cities of the American South. Ann. Assoc. Am. Geogr. 1955, 45, 269–286.
- Bruce, G.D.; Witt, R.E. Developing Empirically Derived City Typologies: An Application of Cluster Analysis. Sociol. Q. 1971, 12, 238–246.
- Dalton, P.; Williams, S. Grouping Minnesota Cities: Using Cluster Analysis; Minnesota House Research Department: St. Paul, MN, USA, 2015; p. 58. Available online: https://www.house.mn.gov/hrd/pubs/groupmncity.pdf (accessed on 29 June 2023).
- Hill, E.; Brennan, J.; Wolman, H. What Is a Central City in the United States? Applying a Statistical Technique for Developing Taxonomies. Urban Stud. 1998, 35, 1935–1969.
- Martin, M.; Carley, K.M.; Altman, N. 300 Cities—An Exploration in Characterizing US Cities 2008. Available online: https://papers.ssrn.com/sol3/papers.cfm?abstract_id=2726827 (accessed on 28 June 2023).
- Al Ani, M. Urban Types and Transformation of the City; Real Corp: Schwechat, Austria, 2012.
- Huang, J.; Lu, X.X.; Sellers, J. A Global Comparative Analysis of Urban Form: Applying Spatial Metrics and Remote Sensing. Landsc. Urban Plan. 2007, 82, 184–197.
- Thomson, M. Great Cities and Their Traffic; Penguin: Harmondsworth, UK, 1978; ISBN 0-14-055127-1.
- Frenkel, A. Land-Use Patterns in the Classification of Cities: The Israeli Case. Environ. Plan. B Plan. Des. 2004, 31, 711–730.
- Kenworthy, J.; Laube, F. The Millennium Cities Database for Sustainable Transport. Database 2001. Available online: https://trid.trb.org/view/708144 (accessed on 8 August 2023).
- Kenworthy, J. Sustainable Urban Transport: Developing Sustainability Rankings and Clusters Based on an International Comparison of Cities. In Handbook of Sustainability Research; Peter Lang Publishing: New York, NY, USA, 2005; ISBN 978-0-8204-7308-6.
- Karathodorou, N.; Graham, D.; Noland, R. Estimating the Effect of Urban Density on Fuel Demand. Energy Econ. 2010, 32, 86–92.
- Joly, I.; Masson, S.; Petiot, R. The Determinants of Urban Public Transport: An International Comparison and Econometric Analysis; AET: London, UK, 2004; p. 25.
- Priester, R.; Kenworthy, J.; Wulfhorst, G. The Diversity of Megacities Worldwide: Challenges for the Future of Mobility. In Megacity Mobility Culture: How Cities Move on in a Diverse World; Lecture Notes in Mobility; Springer: Berlin, Germany, 2013; pp. 23–54. ISBN 978-3-642-34735-1.
- Oke, J.; Aboutaleb, Y.; Akkinepally, A.; Azevedo, C.L.; Han, Y.; Zegras, C.; Ferreira, J.; Ben-Akiva, M. A Novel Global Urban Typology Framework for Sustainable Mobility Futures. Environ. Res. Lett. 2019, 14, 095006.
- Klinger, T.; Kenworthy, J.; Lanzendorf, M. Dimensions of Urban Mobility Cultures—A Comparison of German Cities. J. Transp. Geogr. 2013, 31, 18–29.
- Shell New Lenses on Future Cities: A New Lens Scenarios Supplement 2014. Available online: https://www.shell.com/energy-and-innovation/the-energy-future/scenarios/what-are-the-previous-shell-scenarios/new-lenses-on-future-cities/_jcr_content/root/main/section/text_407441365.multi.stream/1655892182865/4af0dbaee78537131e05449aaf5f63b3b953b52c/newlensesonfuturecities-june-2014.pdf (accessed on 28 June 2023).
- Acuto, M.; Davidson, K.; Mokhles, S. Reimagining Climate Networking between Cities: Clustering Cities Based on a Large Dataset of Mitigation Actions 2022. Available online: https://www.researchsquare.com/article/rs-1806235/v1 (accessed on 29 June 2023).
- Cantuarias-Villessuzanne, C.; Weigel, R.; Blain, J. Clustering of European Smart Cities to Understand the Cities’ Sustainability Strategies. Sustainability 2021, 13, 513.
- Ismagilova, E.; Hughes, L.; Dwivedi, Y.; Raman, R. Smart Cities: Advances in Research—An Information Systems Perspective. Int. J. Inf. Manag. 2019, 47, 88–100.
- Woetzel, J.; Lin, D.-Y.; Sridhar, M.; Yap, S.-E. Smart Cities in Southeast Asia; McKinsey Global Institute Discussion Paper; McKinsey & Company: New York, NY, USA, 2018; p. 44. Available online: https://www.mckinsey.com/capabilities/operations/our-insights/smart-cities-in-southeast-asia (accessed on 29 June 2023).
- Lang, N.; Herrmann, A.; Hagenmaier, M.; Richter, M.A. Can Self-Driving Cars Stop the Urban Mobility Meltdown? Boston Consulting Group: Boston, MA, USA, 2020.
- Rose, J.; Schellong, D.; Schaetzberger, C.; Hill, J. How E-Scooters Can Win a Place in Urban Transport; Boston Consulting Group: Boston, MA, USA, 2020; p. 10. Available online: https://web-assets.bcg.com/img-src/BCG-How-E-Scooters-Can-Win-a-Place-in-Urban-Transport-Jan-2020-rev_tcm9-237992.pdf (accessed on 29 June 2023).
- Hook, W.; Replogle, M. Motorization and Non-Motorized Transport in Asia: Transport System Evolution in China, Japan and Indonesia. Land Use Policy 1996, 13, 69–84.
- Feige, I.; Mischke, M.; Gropman, L. City Archetypes How Might Specific Needs of Cities Be Best Addressed in Considering Urban Mobility? 2020. Available online: https://population.un.org/wup/publications/Files/WUP2018-Report.pdf (accessed on 29 June 2023).
- Holz-Rau, C.; Heyer, R.; Schultewolter, M.; Aertker, J.; Wachter, I.; Klinger, T. Eine Verkehrstypologie deutscher Großstädte. Raumforschung und Raumordnung. Spat. Res. Plan. 2022, 80, 137–152.
- Moody, J.; Wang, S.; Chun, J.; Ni, X.; Zhao, J. Transportation Policy Profiles of Chinese City Clusters: A Mixed Methods Approach. Transp. Res. Interdiscip. Perspect. 2019, 2, 100053.

