1. Introduction
The improvement of the energy supply process will represent a fundamental challenge in the near future and the development of smart grids will be necessary to maintain the stability, reliability, and correct management of energy flows
[1][2][3]. In fact, the recent decarbonization processes launched by several countries to reduce the effects of environmental pollution and climate change are significantly increasing the amount of renewable energy fed into electricity grids. This requires the introduction of new power devices, electronic circuits, and energy management techniques that increase the overall complexity of national electricity systems
[4][5][6]. Therefore, one of the main aspects of this “green revolution” is the development of prognostic and diagnostic methods to ensure the reliability of new components, preventing service interruptions, and limiting the section of the network affected by failures
[7][8][9]. The prevalence of the various types of faults presents notable disparities based on the country and the specific characteristics of the national electricity grid. However, recent statistics consistently reveal that lightning, wind, sleet, and the resulting mechanical impacts collectively contribute to 50% of the faults within transmission and distribution networks
[10][11]. This highlights the importance of implementing an effective lightning location system and dedicated monitoring mechanisms to address mechanical degradation issues. By focusing on these aspects, positive impacts could be achieved in the mitigation of approximately half of the critical events. In terms of frequency, it is clear that around 50% of outages are related to overhead power lines, leaving the remainder to be distributed between cable lines, transformers, and other devices
[11]. However, the continued electrification of loads in smart grids is significantly increasing the failure rate of cable lines. This highlights the growing importance of fault management facilitated by protective devices. According to
[10], approximately 65% of disconnections on high- and medium-voltage lines are caused by transient faults and are correctly managed through automatic reclosing. The remaining 35%, however, are caused by permanent failures followed by failed reclosures. Today, localization in high-voltage networks is achieved with good success rates above 90%. However, during the distribution phase, where the network exhibits a more intricate and interconnected structure, the precision of fault localization tends to decrease. In this context, a comprehensive examination of the key methodologies for diagnosing and predicting faults in electrical power lines becomes highly valuable. Established practices and innovative approaches found in the literature, aimed at averting catastrophic failures in electrical power lines, are indispensable for researchers involved in the transition from centralized to distributed energy generation. It is important to clarify that the term “transmission lines” refers to high-voltage (HV) infrastructures connecting power generation plants and primary stations, while distribution networks encompass medium-voltage (MV) and low-voltage (LV) systems, extending from secondary substations to end users. Before starting with the overview of the main monitoring techniques, it is necessary to summarize the most frequent phenomena affecting transmission and distribution power lines. For this reason, a partial revision of the information contained in
[12] is proposed:
-
Overvoltages: In this case, the mains voltage exceeds the nominal design value. Based on the nature of the causes, they can be divided into internal and external.
- -
-
External: They are mainly caused by direct lightning strikes that determine the so-called overvoltages of atmospheric origin. The biggest damage they can cause is the failure of the insulation of one or more components. The loss of insulation is serious as it can produce short-circuits in which a large amount of energy is dissipated and this can lead to explosions. Usually, to prevent damage to the insulation of electrical components, they are rated for voltages several times greater than the nominal ones, in order to guarantee a high margin of safety. The detection of a transient overvoltage resulting from lightning is a crucial aspect. Traditional logging and online monitoring systems had limitations such as low sampling rates and inadequate electric structures that made it difficult to capture the transient overvoltage signal accurately. Today, thanks to the higher frequencies of electronic devices, this drawback has been partially overcome. Furthermore, to overcome these challenges, a novel non-contact capacitor-based overvoltage transducer has been developed in
[13]. This research was also conducted to study the decoupling technique between different phases.
- -
-
Internal: They are caused by the closing and opening operations of circuits and, therefore, they are also called switching overvoltages. They can also be determined by rapid load variations or from resonance phenomena. Finally, surges can be caused by faults, such as accidental contacts and insulation losses. These overvoltages can exceed nominal values by a few times and generally have a duration of the order of milliseconds. In this field, important considerations are reported in
[14], where the validation of power system component models for use in switching transient studies is performed. The authors consider the overvoltage data extracted from 230 kV lines and provide a summary of the switching tests and the main results derived from field measurements.
-
Overcurrents: In this case, the mains current exceeds the nominal design value. Depending on the causes that generate them, they can be divided into permanent, transient, and fault overcurrents.
- -
-
Caused by transient overloads: They are mainly due to operations such as starting asynchronous motors, which involve inrush currents up to ten times higher than the nominal ones and last a few seconds, or the insertion of vacuum transformers, which can involve currents up to three times larger than the rated ones and that last a short time. Both of these overcurrent causes are linked to transient phenomena; it is therefore not appropriate to adopt protections for the line that leads to the opening of the branch in which the overcurrent circulates. This operation would be harmful, as it causes an unnecessary outage of service.
- -
-
Caused by permanent overloads: They occur when there are loads that draw higher power to that used in the dimensioning of the line. They involve a slow heating of the conductors and, when this thermal overload is prolonged for a long time, it is necessary to break the circuit. Overload mitigation will be particularly important in future power grids that incorporate distributed and fluctuating renewable energies. Ref.
[15] proposes a distributed corrective control scheme to solve transmission line overload issues. The scheme introduces a linearized AC power flow model, which compensates for the linearization error through a closed loop of power flow control. The correct management of overload situations becomes more complex in the case of the high integration of renewable energy sources and, consequently, it is necessary to introduce a new computational method to correctly organize the protection actions
[16][17].
- -
-
Caused by faults: When an accidental electrical connection occurs between two points normally at different potentials, a low impedance mesh is created, called a fault loop, in which a short-circuit current circulates. This current has a much larger root mean square (RMS) value than the nominal one. Normally, a short-circuit can occur due to a lack of insulation caused by accidental contacts, rain, and overheating produced by long overloads, but more frequently from overvoltages that cause the striking of arcs between points with different potential. Many different types of short-circuits can occur in electrical lines and, for each of them, specific protections must be adopted
[18][19][20]. In particular, the evolution of power supply systems involves the introduction of new devices according to the standard protection systems. For example, ref.
[21] discusses the use of a saturated iron core active super-conducting fault current limiter (SISFCL) to handle high levels of fault current in smart distribution networks. When a short-circuit fault occurs in several locations, the SISFCL can reduce the fault current to an acceptable level. The paper briefly describes the operating principle and current limiting characteristics of an active SISFCL, as well as its impact on conventional protective relays.
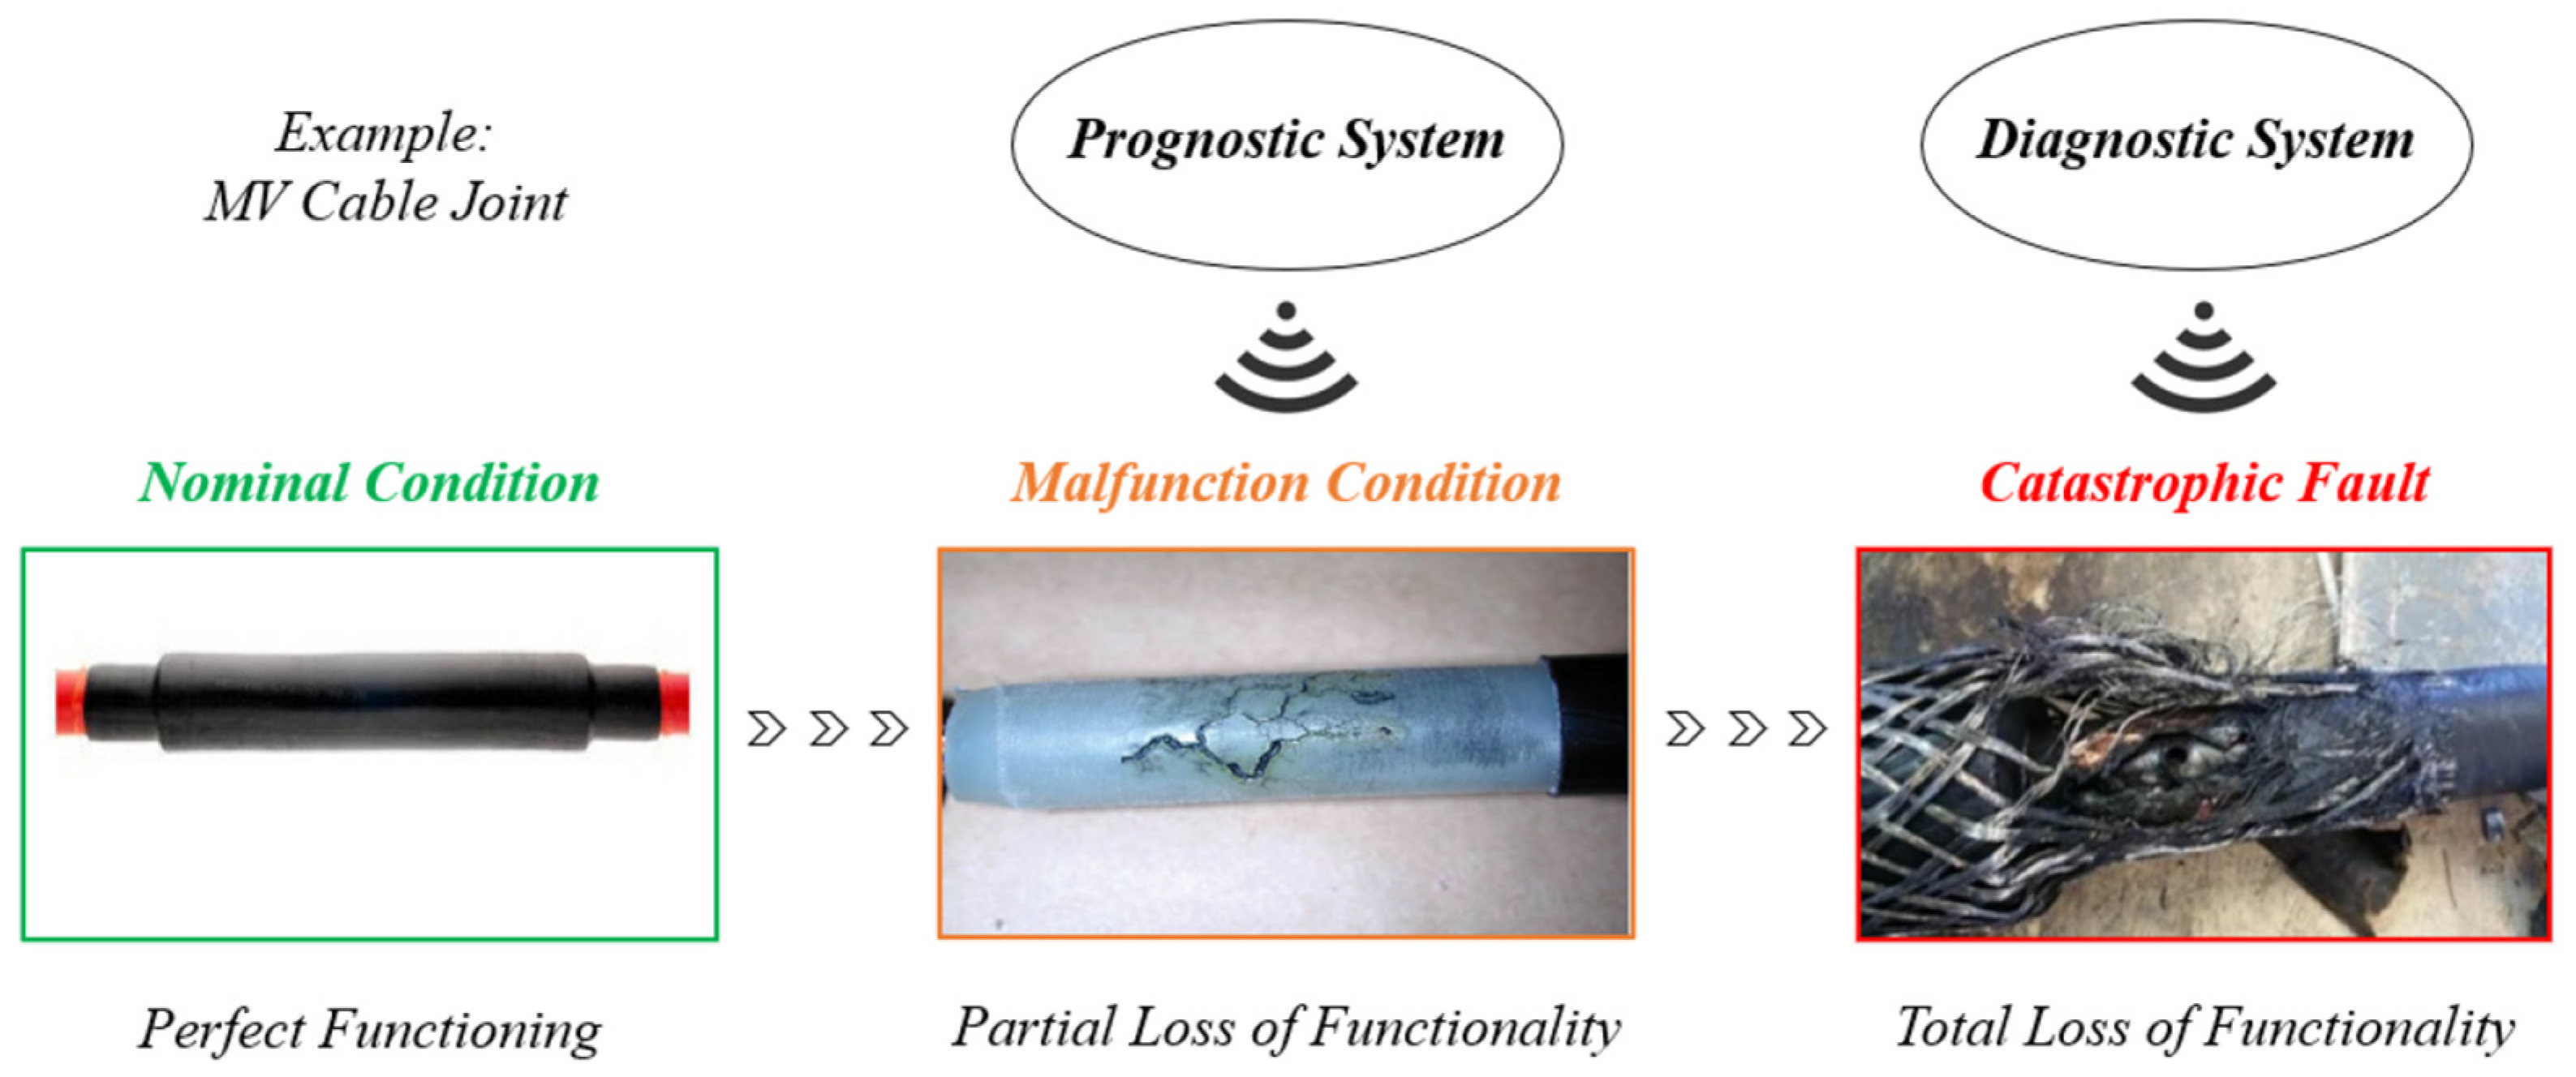
Currently, many different techniques are used in electrical power lines to detect these phenomena. From a general point of view, they can be divided into two main categories: diagnostic systems and prognostic systems. The former focus on catastrophic events that produce the interruption of the electricity service, and the main objective is the correct localization of the fault to avoid the extension of the problem and to put only the network branch in which it occurs out of service
[22]. On the other hand, prognostic systems focus on malfunction conditions, which are partial losses of functionality that precede catastrophic failures. Therefore, the identification of malfunctions allows the prevention of faults and the organization of maintenance operations avoiding service interruptions
[23].
Figure 1 offers a schematic explanation of the difference between diagnosis and prognosis of an electrical system considering power cables.
Figure 1. Main difference between prognostic and diagnostic systems.
The diagnostic systems that operate online are called protection devices and must identify the negative phenomena produced by faults to isolate the corresponding network branches. Once the protections have tripped, it is possible to use other diagnostic systems to detect the exact point where the problem has occurred (for example, in the case of insulation failure). Therefore, the response of the protection devices to the most serious problems must be the rapid and automatic disconnection of the faulty section of the line. This operation must be performed while minimizing the disconnection of non-faulty equipment and ensuring the availability of the electricity service to users without overloads in the functioning part of the network
[24]. The overall performance of a protection system can be assessed on the basis of four criteria
[25]:
-
Discrimination: This represents the ability of the protection system to decide whether to intervene or not in the event of a specific operating condition being detected. For example, anomalous situations may occur due to faults on other parts of the line (protected by other systems) which do not immediately require the circuit to be opened.
-
Stability: This is a measure of the system’s ability not to intervene under certain conditions, such as transient overloads and failures protected by other systems.
-
Sensitivity: This is the system’s ability to detect fault conditions close to the nominal situation. The correct design of the protections allows, for example, for the detection of the short-circuit current that circulates in the furthest point from the protection itself.
-
Operating time: This is the total time that elapses from the beginning of the fault to the sending of the trip signal from the relay to the circuit breaker. The intervention times must be low enough to ensure the safety of the system, equipment, and personnel, but the use of intentional time delays in protection systems allows for high levels of discrimination.
On the other hand, prognostic systems must identify the initial symptoms of failures in order to prevent catastrophic consequences. Usually, this requires the continuous analysis of specific measurements through artificial intelligence algorithms and, consequently, the computational cost plays a fundamental role in the performance evaluation.
As mentioned above, the massive integration of renewable energy sources at all levels of the national electricity system requires further developments in the field of protection and prognostic methods due to the greater complexity of modern smart grids. In fact, the presence of low-voltage production plants powered mostly by photovoltaic (PV) and wind generators creates bidirectional flows of energy in the distribution network, which must be managed to maintain the reliability of the service
[26][27]. This situation can lead to the inversion of flow in the secondary substations, just as the presence of medium-voltage renewable generators can produce at the level of the primary substation. Consequently, the introduction of the remote control of generators and dispatchable loads becomes essential, as well as the adaptation of protection devices so that they are insensitive to reverse flows and do not produce unnecessary trips
[28][29]. In this context, forecasting algorithms focused on production and consumption, together with controllers based on artificial intelligence, allow problems to be prevented
[30]. Control actions are also essential to avoid unwanted island operations that could feed the faulty branches of the network and to manage the emergency supply from renewable sources
[31][32]. Indeed, various types of energy management systems (EMSs) leverage forecast algorithms to enhance their functionalities. These algorithms play a pivotal role in optimizing energy consumption, improving efficiency, and aiding decision-making processes across different sectors. In the context of demand response management, forecast algorithms predict energy demand patterns, allowing EMSs to proactively adjust loads and allocate resources efficiently. For these reasons, the EMS can be considered a real controller of the network. In smart grids, the forecast algorithms are integral to predicting renewable energy generation, such as solar and wind, enabling the controller to balance the supply and demand effectively. They facilitate grid stability by forecasting the fluctuations in energy production and consumption, allowing for pre-emptive measures. Additionally, in industrial energy management, forecast algorithms are employed to anticipate production schedules and energy requirements. This enables the controller to optimize energy usage during peak and off-peak hours, resulting in cost savings and reduced environmental impact. The integration of machine learning algorithms within the controller further refines the forecasting accuracy. These algorithms analyze historical data, weather patterns, and other relevant variables to enhance the prediction capabilities. This is particularly beneficial in microgrid scenarios, where local energy generation and consumption patterns are dynamic. In summary, the incorporation of forecast algorithms into different energy management systems empowers them to make informed decisions, anticipate changes in energy demand and supply, and ultimately enhance the overall system efficiency and sustainability.
Furthermore, the energy injection from renewable sources is characterized by a high variability and is difficult to predict. This introduces new problems in the organization of dispatching operations provided by the transmission system operator (TSO)
[33][34]. In fact, the instantaneous balance between production and consumption plays a fundamental role in the stability of the electricity system, guaranteeing the absence of frequency variations. From a general point of view, when the global production is lower than the consumption of the loads, the frequency of the whole system decreases due to the characteristics of the rotating electric machines commonly used as generators. Similarly, when distributed generation alongside traditional plants introduces overproduction, the frequency of the system increases and further corrective actions are required. Frequency variations are especially dangerous for many industrial loads that require stable voltage and current waveforms, so frequency protection devices are traditionally used in conjunction with additional backup power systems. The same safeguards, together with overcurrent and overvoltage protections, are mandatory when renewable generators are connected to the grid, even if the thresholds are increasingly relaxed to avoid the black-start problem
[35][36]. It consists of the massive disconnection of distributed generators after a temporary failure which makes it impossible to restore normal operation due to the large difference between production and consumption (frequency stability cannot be guaranteed).
Finally, the presence of photovoltaic and wind energy fields characterized by high active power produces an increase in the voltage level on the corresponding network bus during the input of energy. Moreover, since the production of these generators is highly variable, voltage variations are frequently introduced which require adjustment interventions in the secondary substations of the distribution network. When this phenomenon produces short oscillations it is called flicker, which is the subject of many prognostic systems, as well as the presence of harmonic distortions. The latter are usually produced by non-linear loads and static converters used to connect renewable sources to the grid. Many of the negative situations described above fall under the general definition of power quality (PQ) disturbances. Protection devices are therefore monitoring methods that intervene immediately when disturbances exceed the unacceptable threshold due to failures or situations considered dangerous, while prognostic systems can implement artificial intelligence algorithms to classify the nature of the problem.
It might be interesting to analyze other works involved in comprehensive reviews of fault diagnosis techniques in the field of electricity networks, such as
[37][38]. For example, ref.
[37] presents an interesting summary of the emerging health monitoring applications focusing on electric machines, electric grids, electric vehicles, and even civil structures. Most of these methods are based on electrical reflectometry and the discussion focuses on their ability to detect and locate faults. In particular, Section III of
[37] provides a very in-depth review of the main theoretical aspects of the following techniques: time domain reflectometry (TDR), sequential time domain reflectometry (STDR), spread spectrum time domain reflectometry (SSTDR), orthogonal multitone reflectometry (OMTDR), noise domain reflectometry (NDR), chaos time domain reflectometry (CTDR), binary time domain reflectometry (BTDR), frequency domain reflectometry (FDR), multi-carrier reflectometry (MCR) and time-frequency domain reflectometry (TFDR). However, only a brief mention is made of their possible use for fault prevention (the analysis of soft faults). For example, the online detection of partial discharges, together with the identification of high impedance malfunctions and the prevention of arc flashes could be the most interesting developments in the near future. Furthermore, in
[37], the description of protection relays is not detailed, while the analysis methods based on electromagnetic time reversal are presented in detail. From this point of view, the proposed work and ref.
[37] are complementary. As in article
[38], in this case, the aspect of protection relays and their coordination and organization for the detection and localization of different types of faults is explored in depth. However, one of the contributions of this document compared to the content of
[38] is the categorization of relays according to the ANSI/IEEE C37.2 standard and the proposal of common applications in primary and secondary substations. Furthermore, the topic of IED integration is also expanded here with reference to the possible use of computational algorithms for the management of protection functions. Finally, it can be noted that the prognostic aspect is not explored in depth in
[38]. The work, in fact, proposes a detailed review of diagnostic methods and does not consider the prognostic systems necessary to introduce predictive maintenance.
2. State of the Art on Diagnostic and Prognostic Systems
2.1. Protection Devices
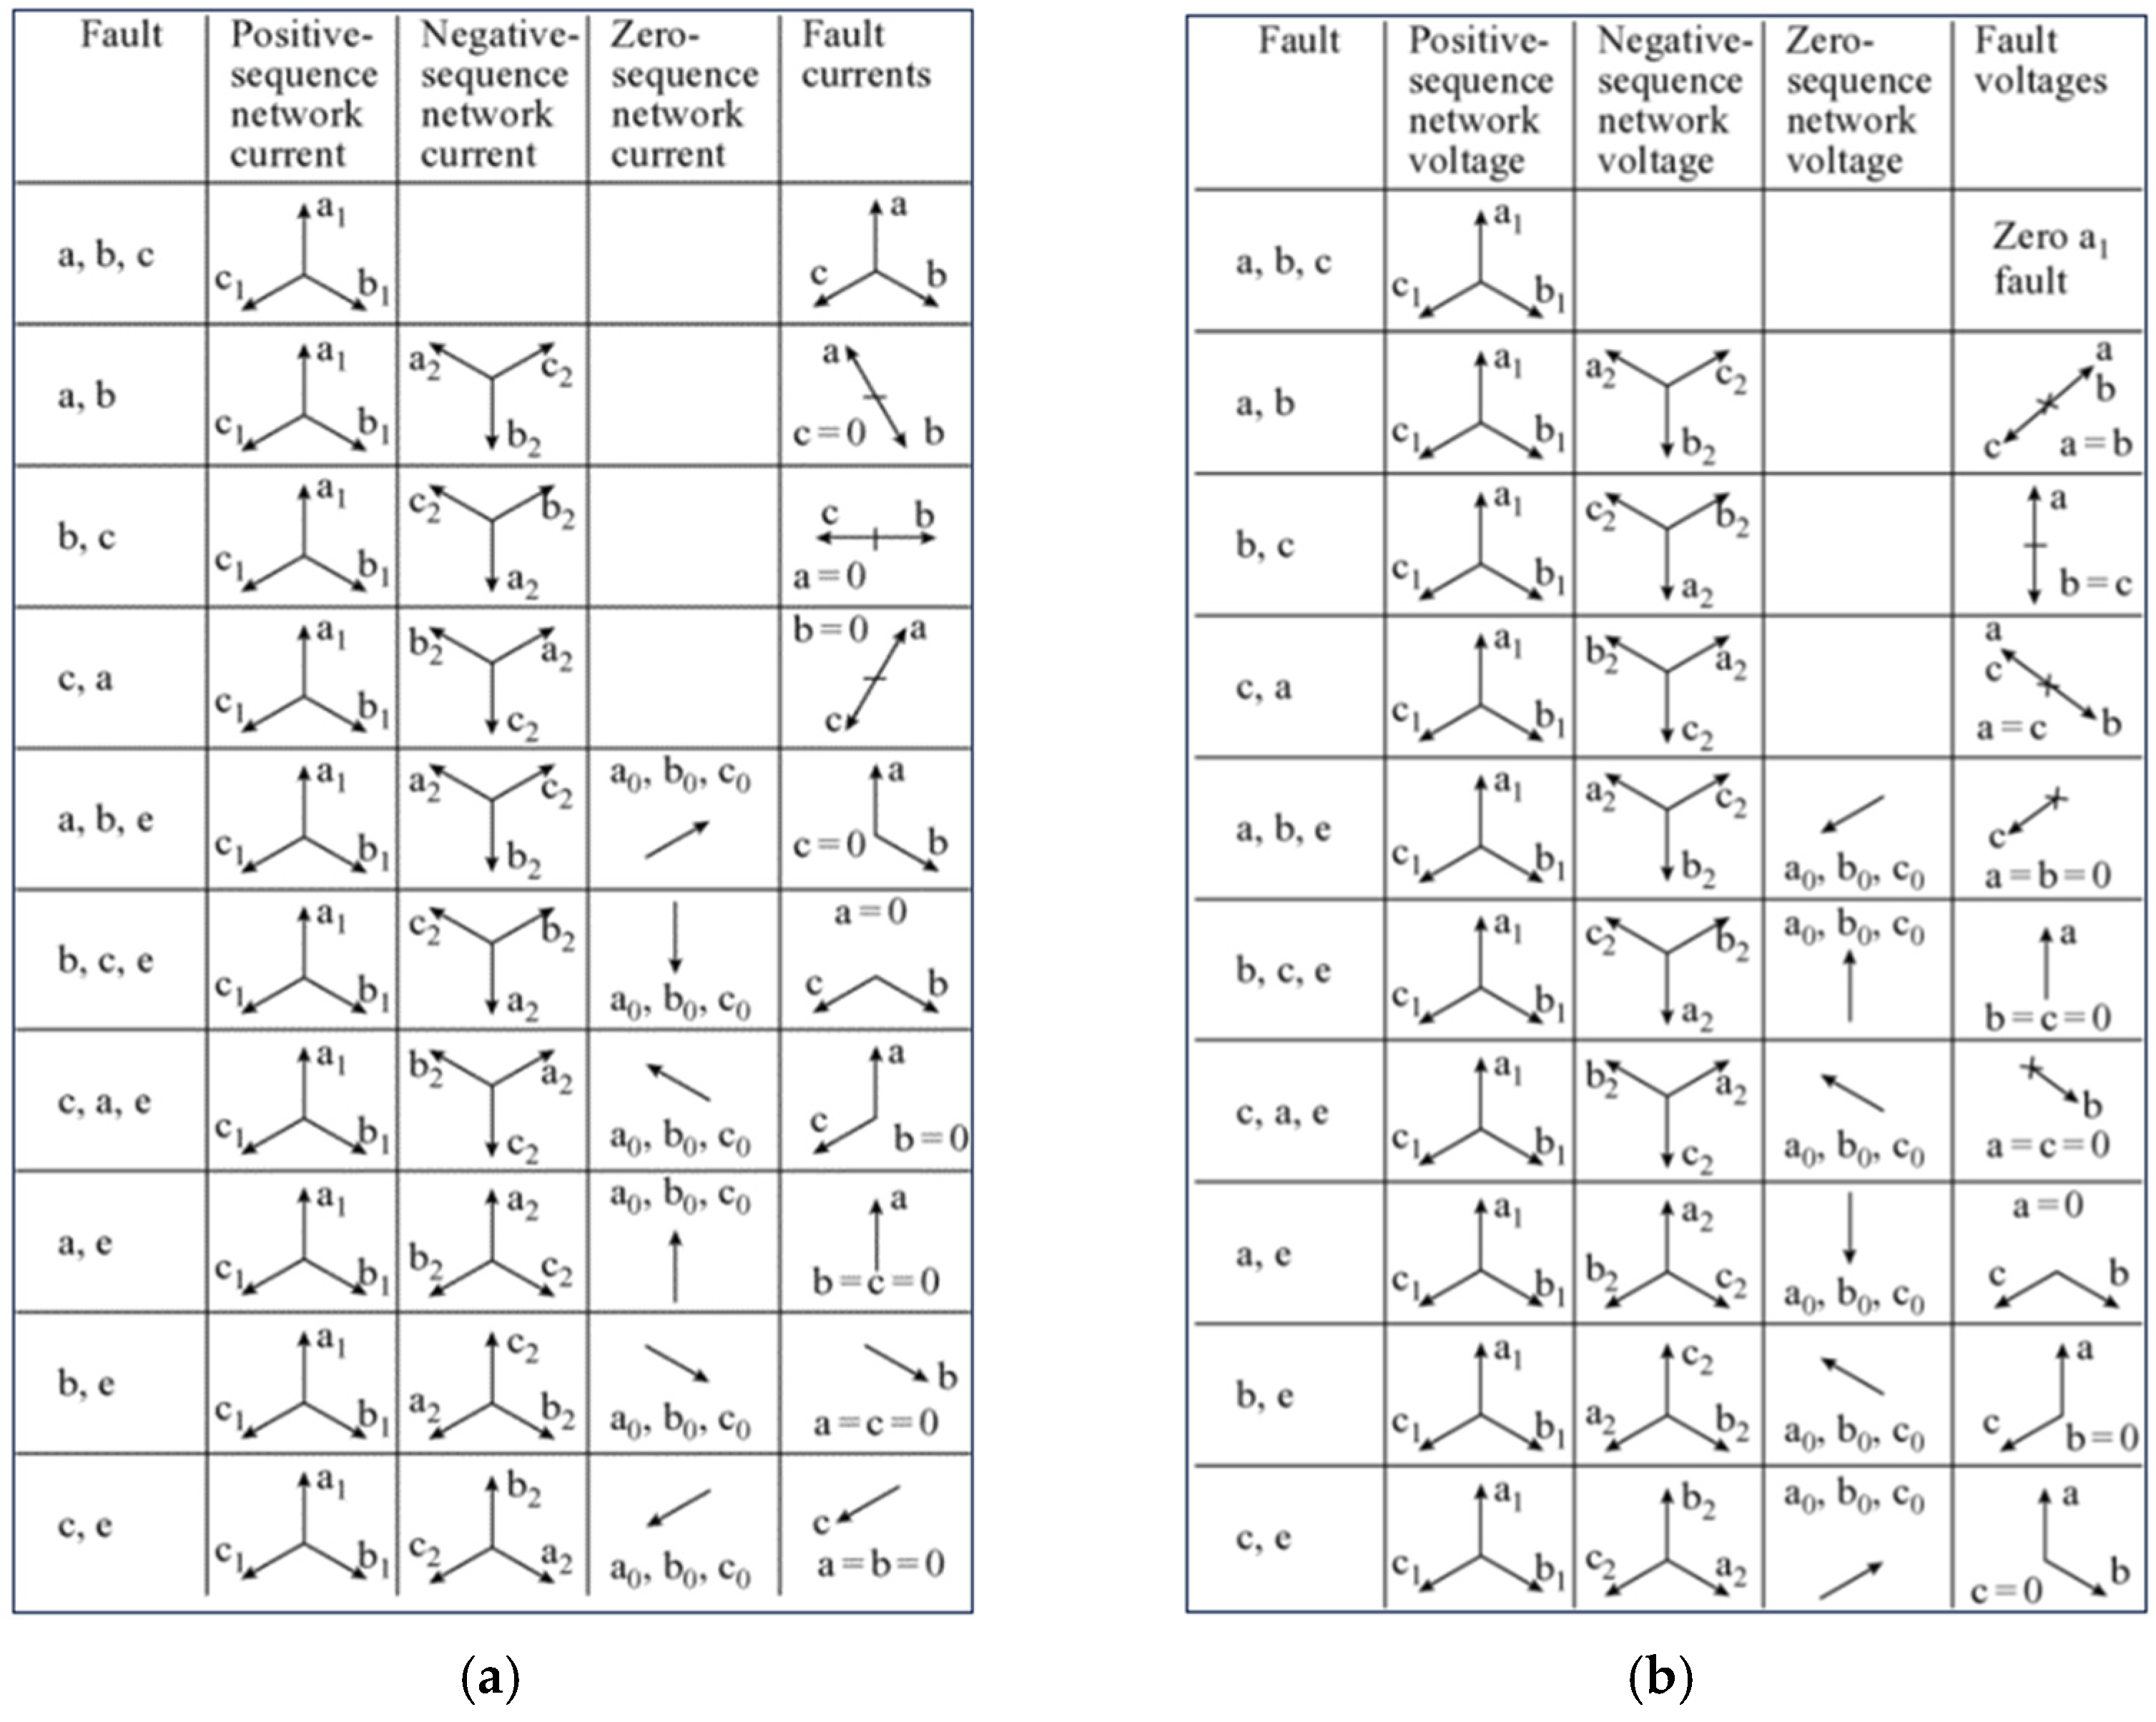
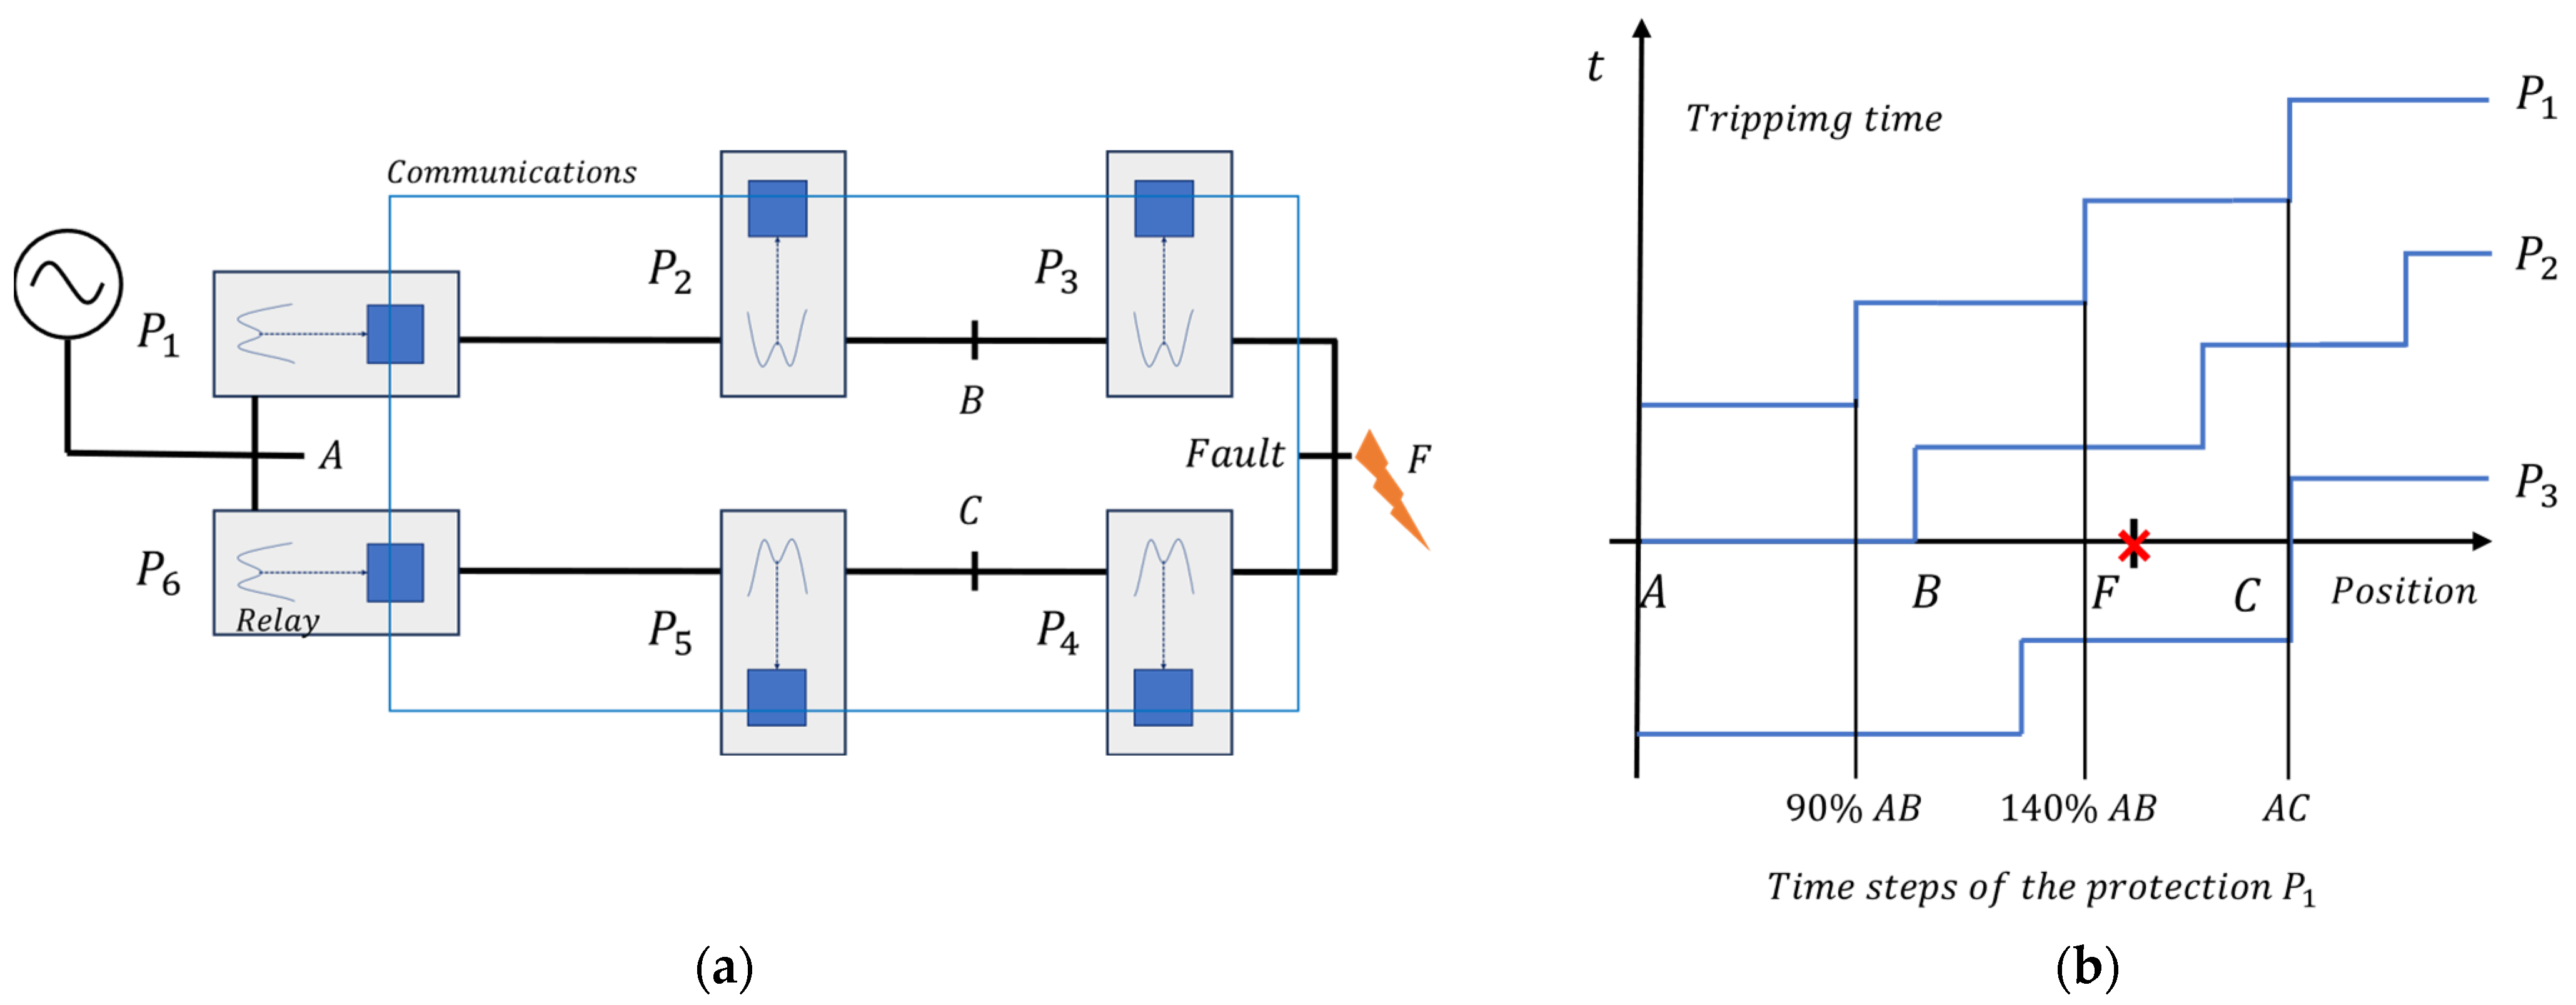
From a general point of view, the protection systems described in the introduction section change according to the configuration of the network considered and the characteristics of the fault sought. Figure 2 presents all the possible fault situations that can be detected in a three-phase electrical system.
Figure 2. Currents and voltages for various types of faults in reference to the three phases called a, b and c (note that the subscript 1 indicates the positive sequence, 2 the negative sequence and 0 the zero sequence): (a) sequence currents; (b) sequence voltages.
However, it is possible to define the general structure of this equipment
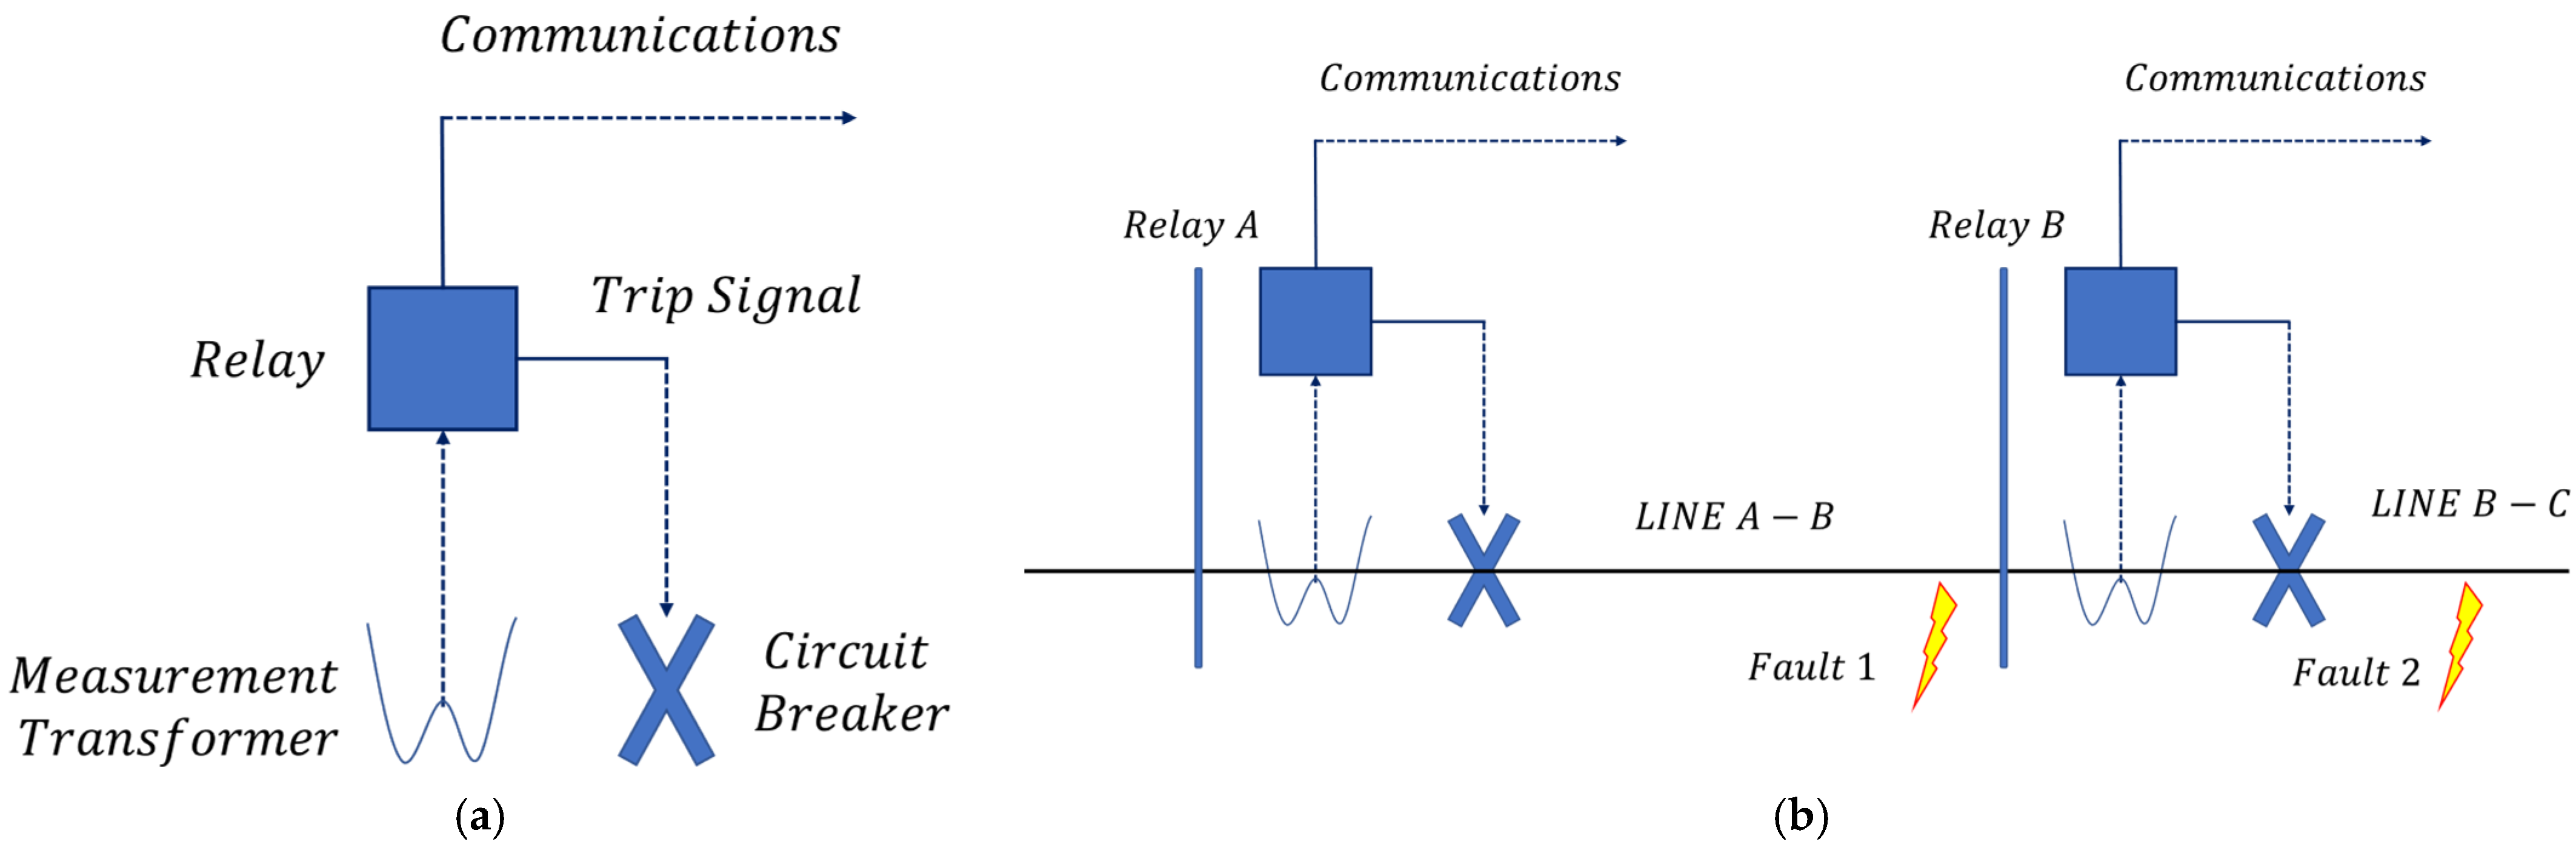
[24]. First, it is necessary to use a measuring device to detect the status of the network (e.g., voltage and current transformers). Then, the equipment must be used to make decisions and translate measures into corrective actions on the line (e.g., relays). Clearly, suitable circuit breakers must be used to carry out the actions controlled by the relays.
The overall structure of a simplified protection system is presented in Figure 3a, while Figure 3b can be used to clarify the concepts of discrimination, stability, and sensitivity mentioned above. In fact, it represents two lines connected in series, each protected by relatively simple overcurrent protection systems. Figure 3b also shows the components of each protection system, which in this case comprises an instrument transformer, a protection relay, and a circuit breaker, which is activated by the relay signal when a fault is detected. For the fault shown in Figure 3b, the sensitivity of both protection systems must be high enough to detect faults on their protected feeders, but not so sensitive that it will operate incorrectly for temporary overloads or short-term transient overcurrents, e.g., due to motors starting or transformer inrush. Moreover, in the scenario depicted in Figure 3b, the A relay needs to be sufficiently sensitive to detect faults on both lines, and must operate if a fault on line B-C is not cleared due to the failure of the protection system in B. The concepts of selectivity and stability can be explained by examining the faults in positions 1 and 2. Fault 1 must be cleared by the relay A, while fault 2 must be cleared by the relay B to maximize the availability of power to consumers and isolate only the faulty component of the system. The A relay must be capable of distinguishing between fault 1 and 2: for fault 1, the A relay must trip quickly, whereas for fault 2, it should trip only after a delay time during which, if everything is working correctly, the B relay will clear the fault, and the A relay will not operate, but will reset once the B relay has cleared the fault. Still with reference to the issue of discrimination, it is necessary for each protection to intervene when a problem affects the downstream line. The sensitivity of a device to upstream phenomena produces unwanted actions and this is usually avoided by introducing direction protections.
Figure 3. Overall structure of protection systems: (a) main components of a protection system; (b) schematic protection arrangements for a multi-section radial feeder.
Finally, the communication systems between the various protections located in different points of the line play an increasingly fundamental role for coordination on a large scale. Supervisory control and data acquisition (SCADA) systems are used in modern smart grids to coordinate protection devices and perform management and control tasks
[39]. From a general point of view, SCADA is a system that collects and analyzes data from sensors, devices, and machines in a remote or distributed environment, and provides control and feedback to operators or automated systems. It presents a hierarchical structure that can be summarized in the regional SCADA systems and in the primary control room of the “national” SCADA. The former works at the distribution level, allowing for the management of bidirectional energy flows and the immediate transmission to the control room of any change in the close/open status of the circuit breaker/isolators. In this way, it is possible to coordinate all the protection devices and define the action of the automatic reclosers to achieve the optimal network configuration. SCADA technology holds significant potential for empowering smart cities to optimize their energy services and infrastructure through intelligent grid capabilities. This can lead to reduced energy costs and emissions by optimizing consumption and integrating renewable sources. SCADA systems enhance resilience and security by detecting and responding to faults, attacks, and natural disasters, offering self-healing mechanisms and microgrid capabilities. Additionally, SCADA contributes to customer satisfaction by providing transparency, choice, and participation in the energy market, along with enabling smart metering, billing, and demand response programs. It plays a pivotal role in fostering innovation and competitiveness in the energy sector. In power grid management, SCADA is employed in central control rooms to acquire real-time electrical parameters through current transformers (CT) and voltage transformers (PT). These values are converted into digital form using analog-to-digital converters (ADC), allowing for efficient transmission. The SCADA system obtains grid parameter values from substations or generating stations through transducers, transforming electrical quantities into current values. These values are converted to digital format by ADC boards in the remote terminal unit (RTU) for transmission over communication lines. However, the adoption of SCADA introduces challenges for smart cities, such as ensuring data quality, cybersecurity, and privacy. Addressing interoperability and standardization is crucial to ensure seamless operation with different protocols and platforms. The scalability and flexibility of SCADA systems are also vital for adapting to the evolving needs of smart grids and cities.
In order to define the most suitable protections for a specific power line, the TSO and distribution system operator (DSO) must follow the indications of the technical standards (national and international). Note that the term DSO is used to indicate one or more subjects authorized to manage different parts of the electrical distribution network. Similarly, the connection of passive and active users to the public electricity network requires the installation of protection devices to avoid dangerous situations and the drawbacks described above in the event of a high penetration of distributed generation. The reference codes of the protection systems in the European countries are uniform and correspond to those reported in the ANSI/IEEE C37.2 standard
[40].
Table 1 summarizes some of the most important and commonly used protection devices for electrical transmission and distribution networks. In the following subsection, some possible fields for the use of the illustrated protections are proposed together with some specific applications extracted from the literature.
Table 1. Codes of the protection devices commonly used in high-voltage and medium-voltage lines.
| Code |
Name |
Function |
| 21 |
Distance (impedance) relay |
A device that functions when the circuit admittance or impedance crosses a boundary defined by a characteristic
in the admittance or impedance plane. |
| 87 |
Differential protective relay |
A device that operates on a percentage, phase angle, or other quantitative difference of two or more currents or other electrical quantities. |
| 79 |
AC reclosing relay |
A device that controls the automatic reclosing and locking out of an AC circuit breaker. |
| 51 |
AC inverse time overcurrent relay |
A device that functions when the AC input current exceeds a predetermined value, and in which the input
current and operating time are inversely related through a substantial portion of the performance range. |
| 67 |
AC directional overcurrent relay |
A device that functions at a desired value of AC overcurrent flowing in a predetermined direction. |
2.1.1. Protections in High-Voltage Lines
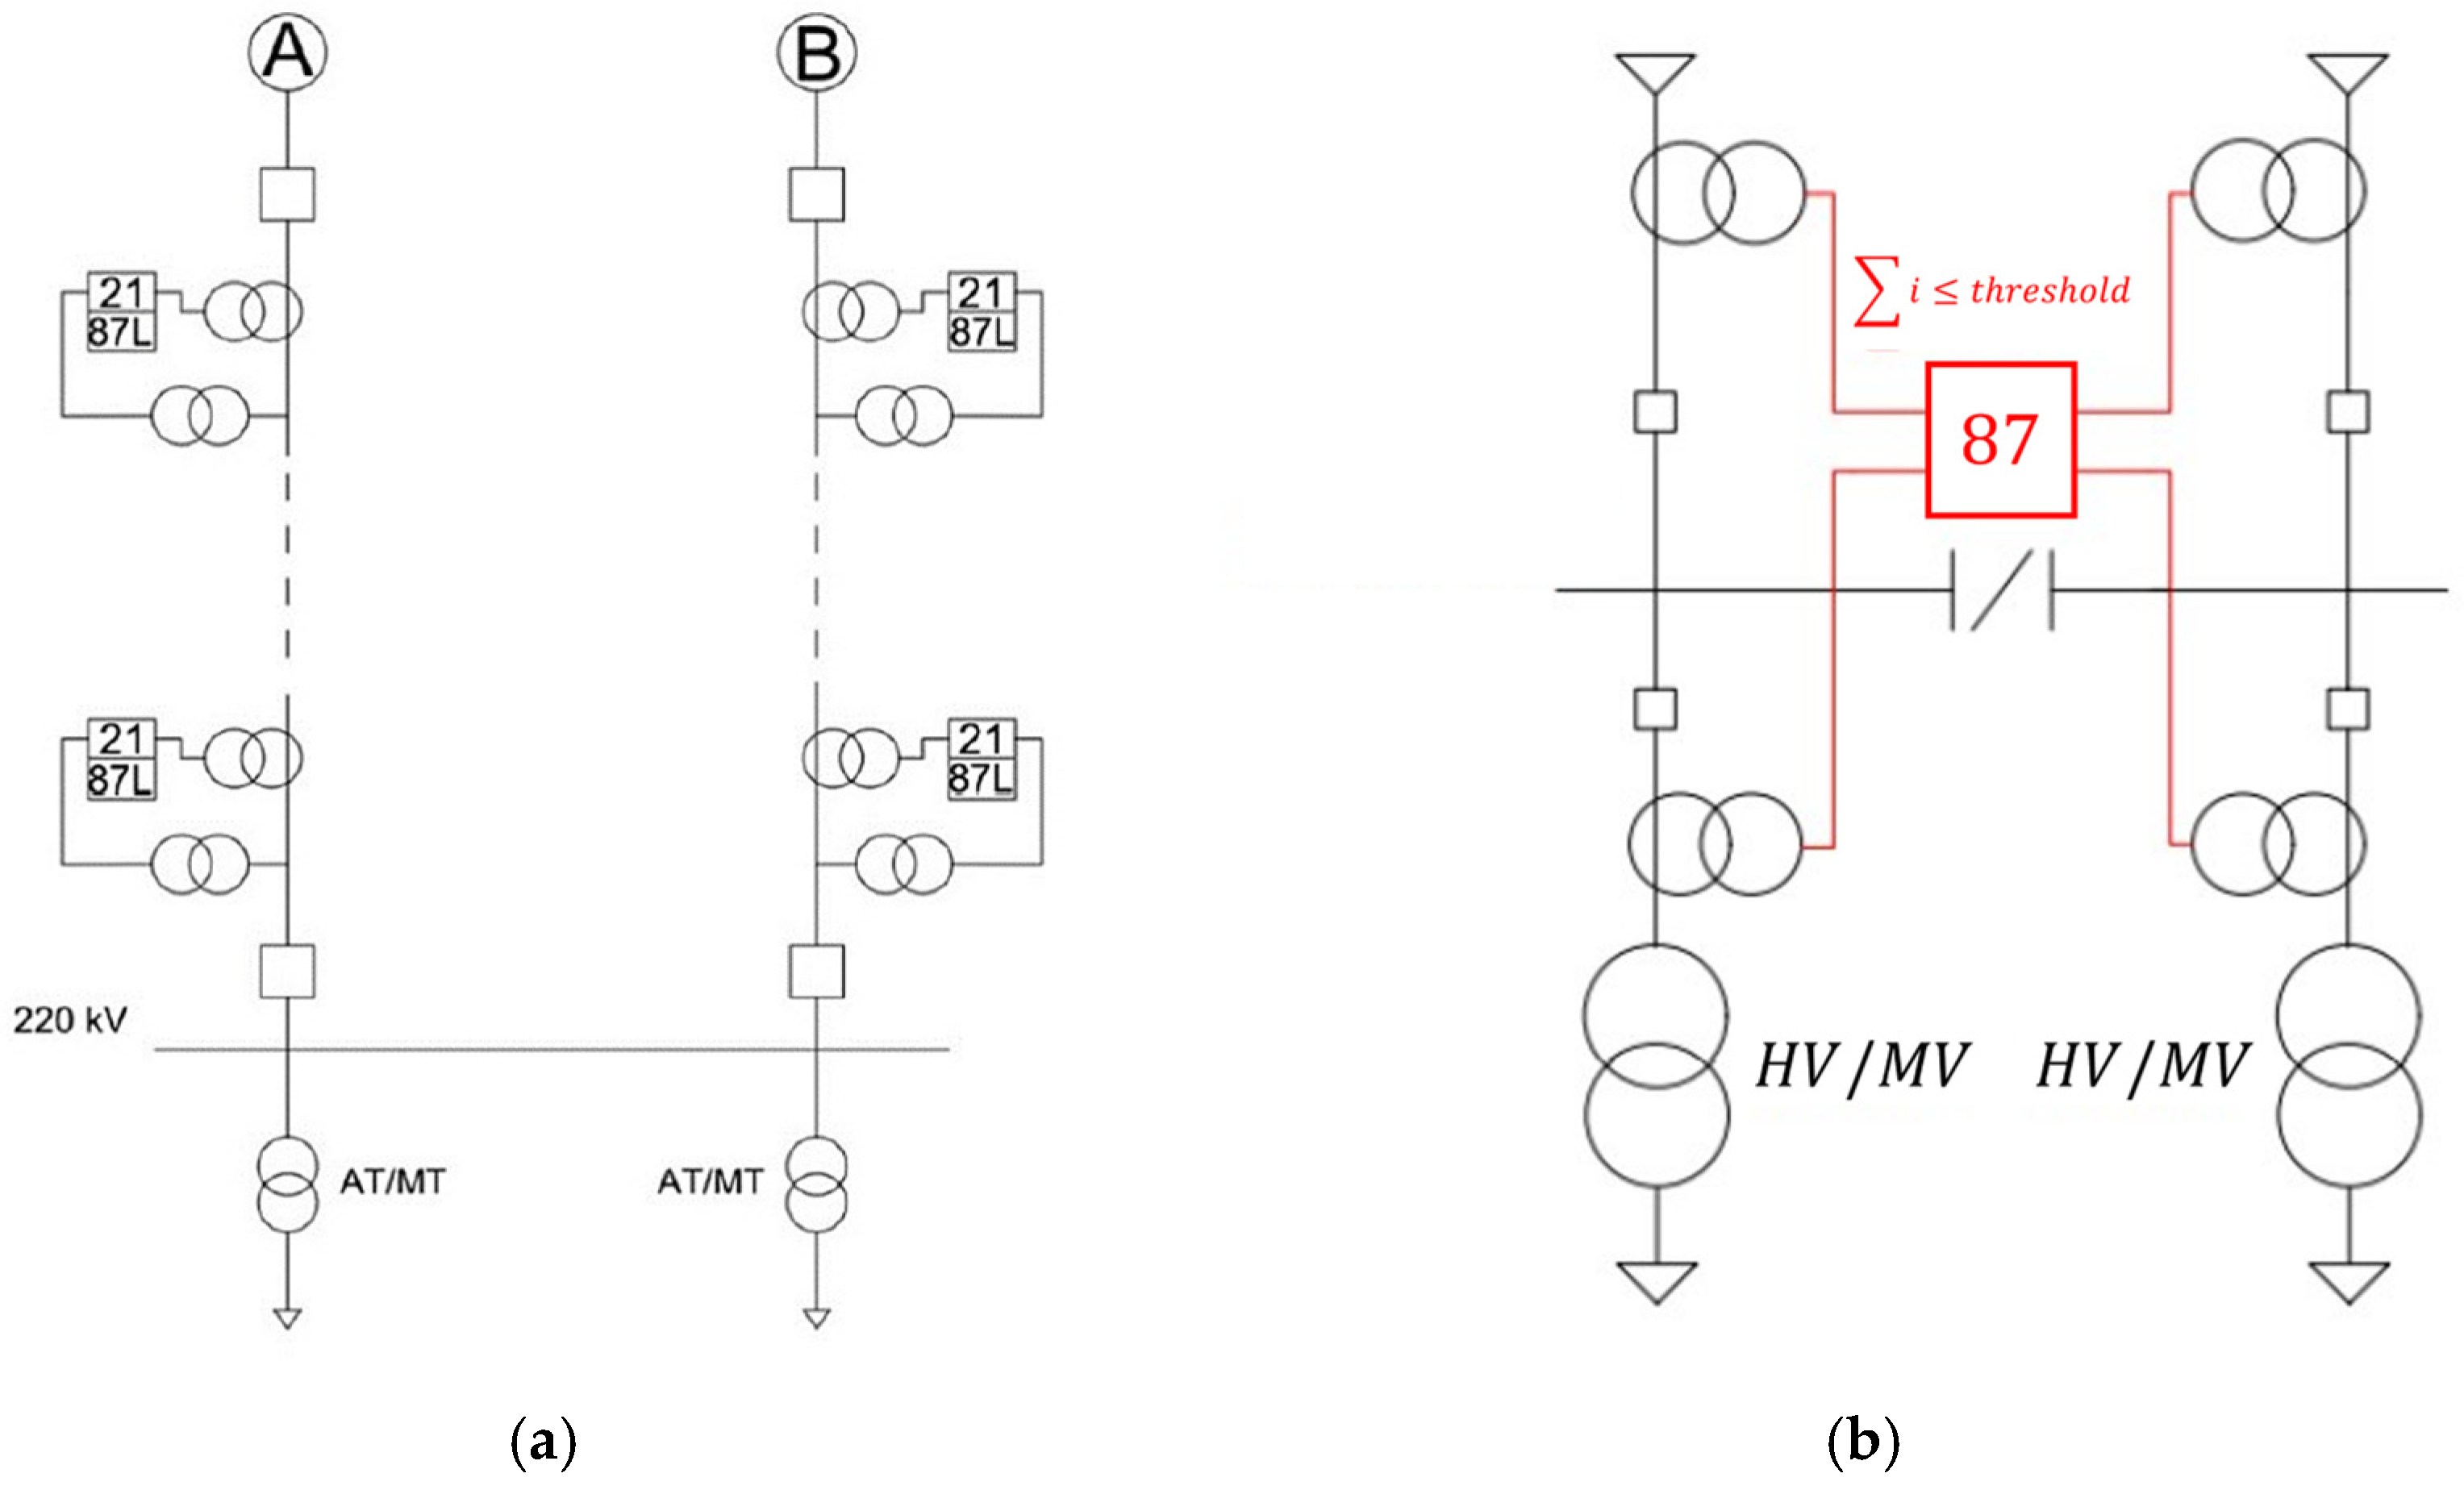
High-voltage electrical lines represent the first phase of energy delivery and are used to cover long distances from the production centers to the primary stations. The overall structure of the transmission system is meshed and it is used in this mode to optimize power flows and ensure the continuity of the power supply. This is a fundamental infrastructure for which long periods of interruption are not allowed, and in which complex systems of communication and remote management are implemented. Most of the equipment used in high-voltage networks are protected through specific devices and are designed with the criterion of redundancy to ensure continuity and increase the availability of the entire service. Given the need to cover long distances, transmission lines are generally overhead, while HV cables (much more expensive) are used only in special cases and in submarine connections. The typical protections usually used in high-voltage electrical networks are presented below. Although there are several high-voltage standards, each of which is characterized by a typical amplitude level, the considerations proposed here can be considered transversal and a valid overview for many three-phase transmission lines and equipment. Starting from the protections installed in the HV networks, the differential ones are considered mandatory by several international technical standards. Therefore, protective relays identified by the code 87 are used to detect current dispersions in high-voltage systems. There are many different types of differential protections, but the most common are following three: 87.L, 87.T, 87.S(or B). Code 87 is usually used to indicate general differential protection for overhead lines, 87.L is a specific device for the protection of cable lines, 87.T measures the current across transformers and identifies any problems in the electrical machines
[41], finally, 87.S is applied on HV Busbars.
Figure 4a,b clarify the meaning of differential measurements.
Figure 4. Differential protections identified by code 87 and schematization of operation in High Voltage (HV) and Medium Voltage (MV) systems with highlighting of the intervention threshold (red part): (a) protection of lines; (b) protection of bus-bars.
In
[42], an analysis of the errors made in the conventional phasor approach for the current differential protections is provided using the dynamic phasor concept. Furthermore, the methodology based on synchronized phasors for the protection of compensated series transmission lines is considered. Finally, the authors also evaluate the speed versus accuracy conflict using phasorlets. In
[43], a possible approach is proposed to avoid the unwanted tripping of the differential relays during the magnetization of transformers. It is based on the study of fault component network (FCN), which is free from inrush detection and computationally cheap. First, the fault component differential power (FCDP), defined as the differential active power of a transformer in the FCN, is analyzed under different conditions. Consequently, a transformer protection scheme is presented based on the FCDP and the traditional differential power. In the context of applying current differential protection to AC transmission lines, synchronous sampling at both ends becomes a requisite. The adoption of GPS synchronization introduces complexity and elevated implementation costs, whereas the utilization of ‘ping-pong’ synchronization necessitates balanced transmission and reception delays in the communication channel. To overcome these challenges, power differential protection has been introduced
[44]. However, this method is not capable of identifying the fault zone for single-line-to-ground faults. To address these limitations, a new approach to differential protection grounded in Tellegen’s quasi-power theorem is proposed in
[45]. This approach retains the merits of conventional current differential protection while remaining impervious to the variations in the load conditions and distributed capacitance influences.
The second type of protections usually used in HV stations is that of distance protections, which guarantee the localization of the fault by putting only the corresponding network branch out of service. In this case, the input quantities are the line voltage and current, suitably reduced by voltage and current transformers. These protections internally calculate the impedance in the magnitude and phase. When polyphase or earth faults occur in the network the voltage and current vary and, consequently, the impedance seen from the power supply point of the line varies. If this impedance drops below preset thresholds, the relays cause the line to open with preset times based on the distance from the fault. Different impedance thresholds are programmed, defined in steps, proportional to the distance from the fault
[25]. Therefore, tripping time plays a fundamental role in the operation of distance protections: fault location is based on the coordination between upstream and downstream devices.
Figure 5a,b show a possible configuration of distance relays in a specific situation.
Figure 5. Distance protections: (a) network configuration characterized by six primary stations (P1–P6); (b) possible coordination of the distance relays in the event of a fault indicated by the red sign.
In
[46], an ultra-high-speed protection algorithm for the distance protection of traveling waves is presented, based on the pattern recognition of the first arriving wave front in the position of the relay due to a fault. The algorithm uses principal component analysis (PCA) to preprocess data from the feed system in order to eliminate redundant information and improve patterns hidden in the traveling waves for indoor and outdoor defects. As mentioned in the introduction, one of the key issues discussed and related to distributed generation include anti-islanding, temporary overvoltages under fault conditions, and the loss of sensitivity of the overcurrent protection for long feeders. Even though distance protections are commonly used in transmission lines, ref.
[47] presents a possible application of these relays in distribution lines to solve some of the problems associated with the integration of renewable generators.
2.1.2. Protections in Medium-Voltage Lines
Distribution networks represent the last part of the energy chain and can be divided into MV lines and LV lines. The former are used to connect primary and secondary stations, secondary stations to each other, and secondary stations with large users. This is achieved by reducing the voltage and increasing the current with respect to transmission lines. In fact, these infrastructures are usually close to urban centers and are also used inside them to cover medium distances. For this reason, the energy lost due to the Joule effect is considered acceptable. In rural contexts, medium-voltage lines are made up of overhead conductors to easily reach all users along irregular paths determined by the characteristics of the territory. These networks are more exposed to accidental direct contact and lightning, but can be visually analyzed in the event of a failure. In addition, the overhead structure is the cheapest choice compared to other solutions. Instead, in large urban areas, MV lines are made up of underground cables and this makes them safer, guaranteeing a low impact on cities and citizens. However, cables are difficult to reach and inspections are time-consuming and resource-intensive. In this case, correctly identifying the broken branch plays a fundamental role. From a general point of view, medium-voltage lines have a mesh structure, but operate in a radial mode. Their extremely branched and complex configuration requires the exclusion of the faulty branch and its safety before the utilities can be powered by alternative routes. Furthermore, the presence of generators from renewable sources that feed into the distribution network introduces a further factor of complexity for the management of the line in fault conditions
[48]. Basically, in MV networks, the main protection activities are carried out by means of overcurrent relays in conjunction with auto-reclosers, fuses and/or section switches
[49]. This allows the protection of the line from long-lasting overcurrents and poly phase short-circuits by putting out of service the branch of the grid in which they occur. Furthermore, by applying directional relays it is possible to detect the single-phase earth fault and, consequently, by using the same type of circuit-breakers, the faulty line section can be isolated.
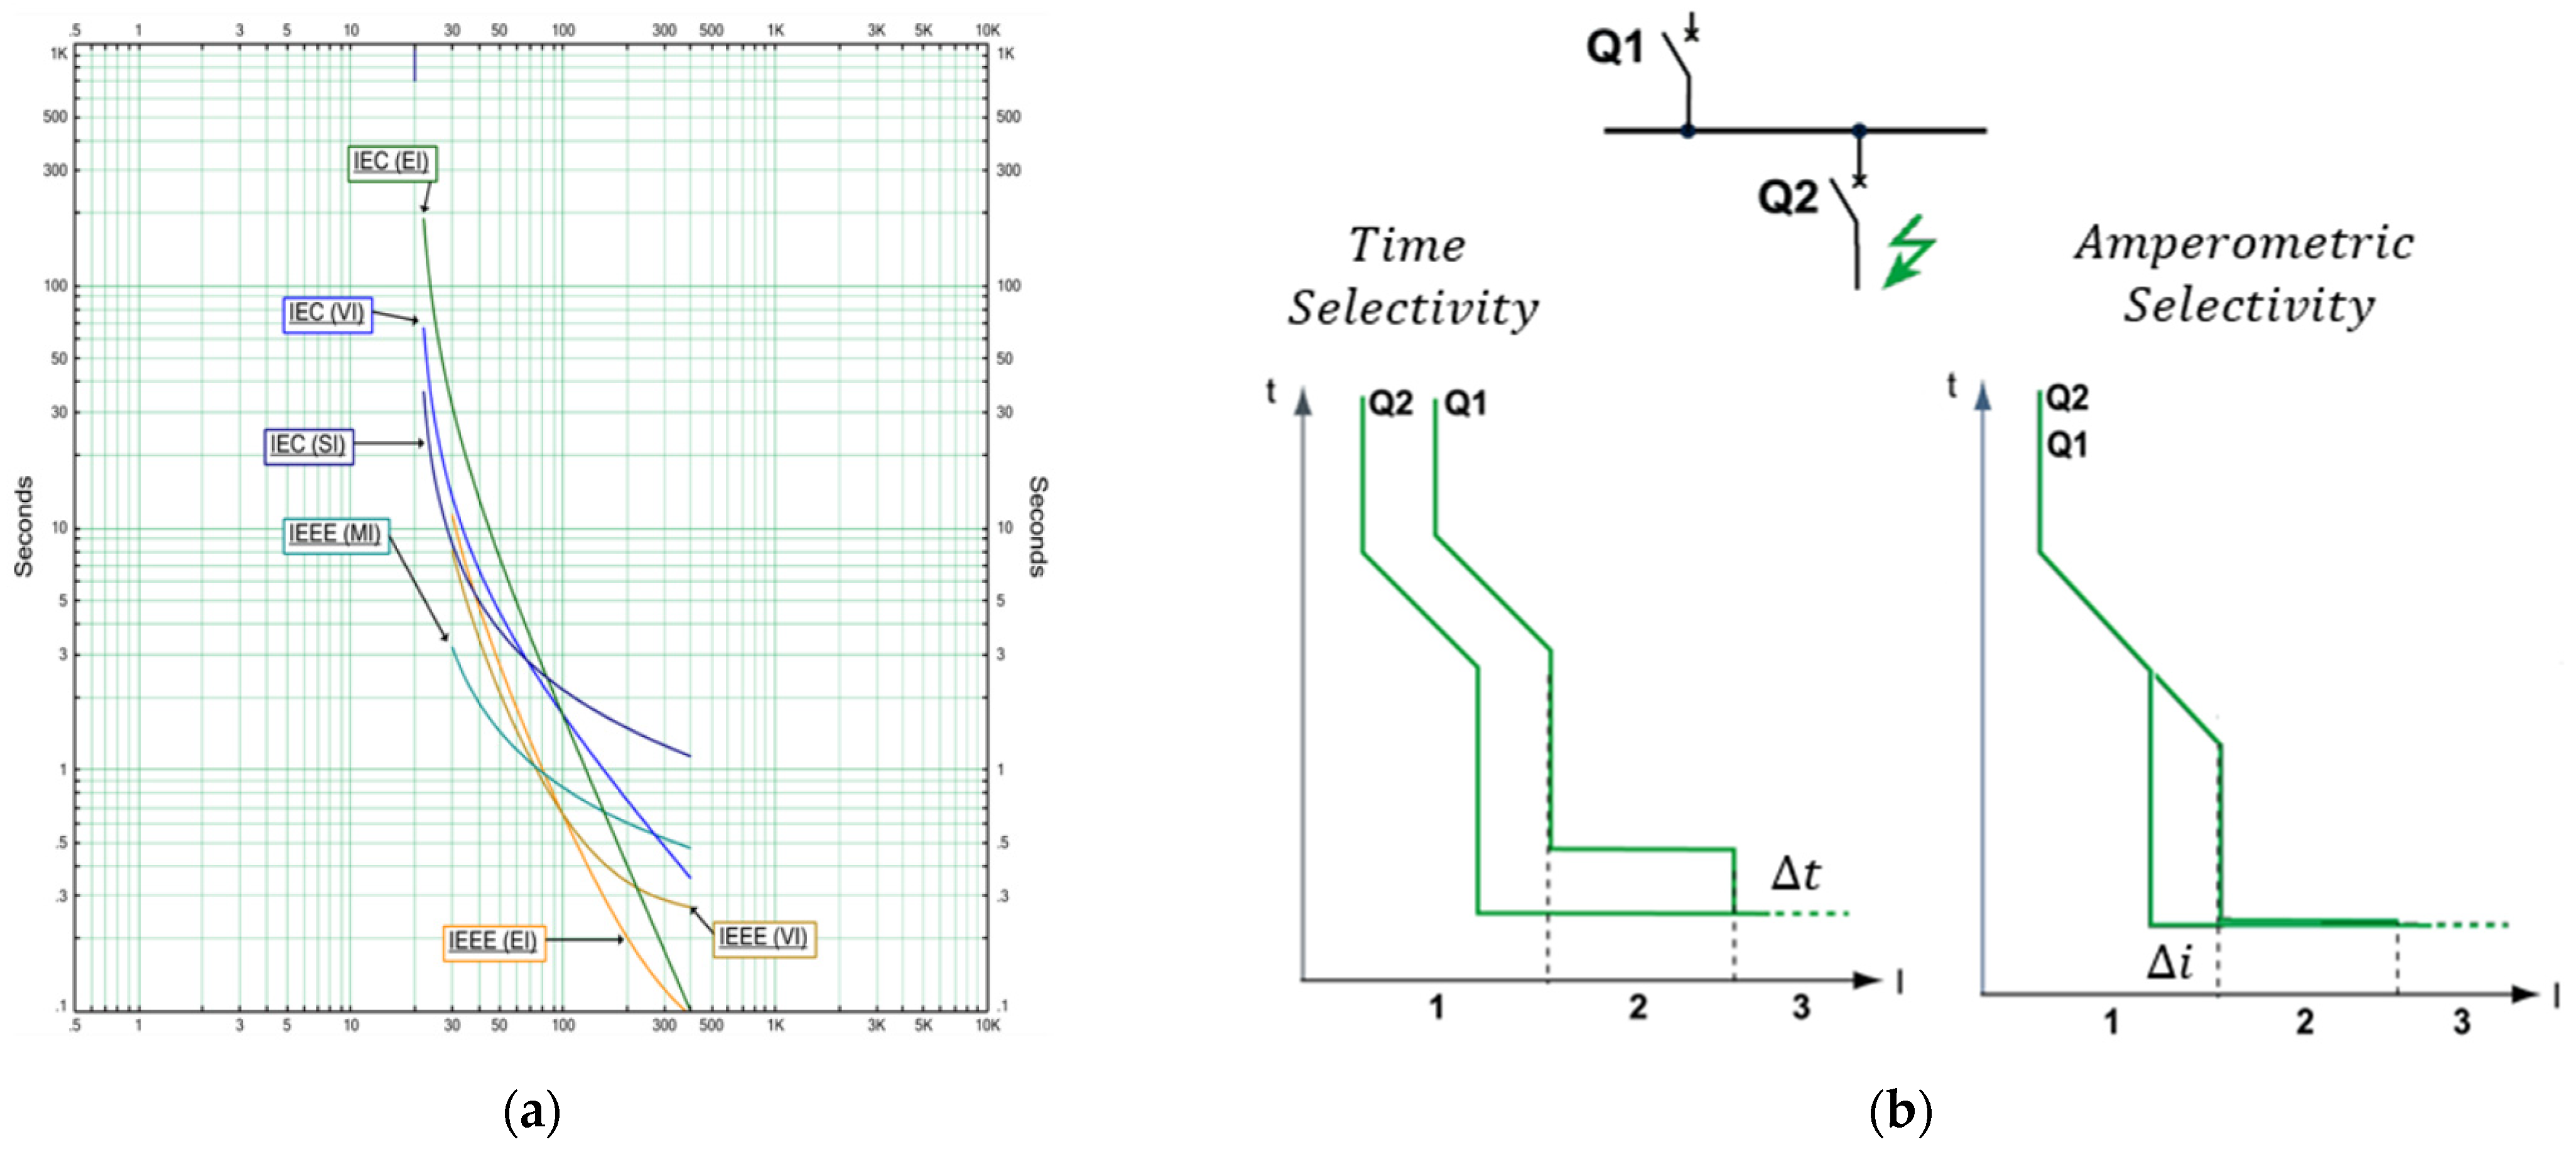
The abovementioned current overload relays play a fundamental role in increasing the selectivity of the protection system. In fact, these devices are characterized by a so-called inverse current–time operating curve. This curve results in slower tripping for low overcurrent levels and immediate tripping for critical values. The standard curves include IEC standard inverse time (SI), IEC very inverse time (VI), IEC extremely inverse time (EI), IEEE moderately inverse time (MI), IEEE very inverse time (VI), and IEEE extremely inverse time (EI). In standard relays, all curves are available. The curves have different slopes and shapes
[18].
Figure 6a summarizes some of these curves. The overcurrent relays can operate in two different programmable modes: pickup and time-multiplier configurations. In the first case, the characteristic curve is moved along the horizontal axis, thus increasing the current value for which intervention is required in a given time. By applying this strategy to the upstream relays, the necessary time is granted to those downstream to intervene without putting the entire distribution network out of service. In the second mode, the characteristic curve is shifted vertically and, therefore, the tripping time is increased for the same overcurrent. By combining these functions it is possible to achieve a high level of selectivity even in very branched networks such as medium-voltage distribution lines.
Figure 6b summarizes the possible coordination techniques. These overcurrent protections are identified by code 51 in the ANSI/IEEE C37.2 standard and the trip time must be defined according to the national technical standard.
Figure 6. Overcurrent protections: (a) standard curves; (b) coordination techniques.
It should be noted that the instantaneous overcurrent protection is entrusted to the relays 50, which in some technical standards are identified with the abbreviation 51.3. Furthermore, the delayed action is indicated by codes 51.1 (or I>) and 51.2 (or I>>), which, respectively, represent the first and second current thresholds. To recognize single-phase earth faults, a specific overcurrent protection is usually used, consisting of a toroidal current transformer, called 51 N protection. This configuration allows for the measurement of the homopolar current under fault conditions. In some specific cases, such as long electrical networks in cable with isolated neutral, the 51 N overcurrent protection can perform unwanted trips. In fact, the most common problem is the opening of the line due to an upstream fault. To overcome this malfunction it is necessary to add the measurement of the homopolar voltage using the protection device identified by the code 67 N.
In order to obtain a rapid resolution of transient faults, the auto-reclosers are applied downstream of the primary station protections, in intermediate points of the line. These devices are used to trip before the primary station protections in the event of earth faults (characterized by currents lower than the polyphase faults). After a first opening, these devices attempt two successive closings to restore the network functionality in the shortest possible time. If the transient fault has not yet been resolved after the second closing attempt, the MV line is definitively opened without triggering the protections in the primary station. In this way the selectivity is increased. Functions similar to those of auto-reclosers can also be implemented in the primary station to develop extremely detailed and precise systems for selecting the faulty branch. To obtain this result, it is necessary to introduce communication and remote control systems in the secondary stations of the network considered. In this way, it is possible to manage the switches of the substations during the opening periods and to localize the problem exactly. The basic functioning of auto-reclosers and possible approaches for their correct management are presented in
[50][51][52]. Auto-reclosers are identified by code 79 in the ANSI/IEEE C37.2 standard and the trip times for successive operations must be defined according to the national technical standard. This type of management is implemented in modern SCADA to optimize the operation of the network and all connected devices, including those of distributed generation.
All the functions described above are essential to ensure the safe availability of the electricity service, but are focused on catastrophic failures (temporary or not) of the line. When these fault conditions are caused by situations of accidental contact or lightning, it is not possible to adopt preventive countermeasures.
2.2. Prognostic Systems
This subsection presents the main prognostic methods currently used in the management of transmission and distribution networks. From a general point of view, all the techniques aimed at introducing preventive and predictive maintenance interventions can be considered prognostic approaches. In the first case, the main aspect is to use an inspection and activity program to find and fix small issues before they turn into big problems. Instead, in the case of predictive maintenance, the system under test is fully functional or with small deviations that do not affect the overall operation, and specific monitoring systems are used to predict the residual useful life of its components and organize future maintenance operations.
2.2.1. Prognostic Systems in High-Voltage Lines
In order to avoid catastrophic failures, overhead transmission line operators typically introduce a preventive maintenance program based on visual and thermal inspections. To carry out these operations, drones equipped with thermal imaging cameras are used, or helicopter inspections are scheduled. The main subjects of these analyses are the joints of the line, that are the connection points between two different parts of the phase conductor. TERNA, which is the operator of the Italian transmission network, carries out this type of inspection every two years and the check becomes more frequent for the sections of the network located in areas with critical environmental conditions
[53]. Unlike high-voltage equipment monitoring, where several operations can be performed to prevent catastrophic failures, overhead line analysis is primarily based on degradation models, inspections, and preventive replacements. For example, the corrosion control of tower legs at the foundation level requires the collection and analysis of data generated by different inspection methods and practices
[54]. In
[55], a methodology is presented to identify the towers most sensitive to the phenomenon of iron corrosion, thus facilitating risk assessment and maintenance planning. To achieve this purpose, the Delphi methodology is used, in which the variables that influence the corrosion phenomenon are correlated with geographic information to generate algebraic maps. Regarding aluminum conductor steel reinforced (ACSR), different databases can be used to identify the most common failure mechanisms
[56] and different analyses allow for the definition of the residual useful life
[57]. New methods are also available for replacing line components without interrupting service
[58]. Prognostic methods for monitoring HV cables are not presented in this subsection because they are similar to those in the following subsection for medium-voltage infrastructures and are rarer in real applications.
2.2.2. Prognostic Systems in Medium-Voltage Lines
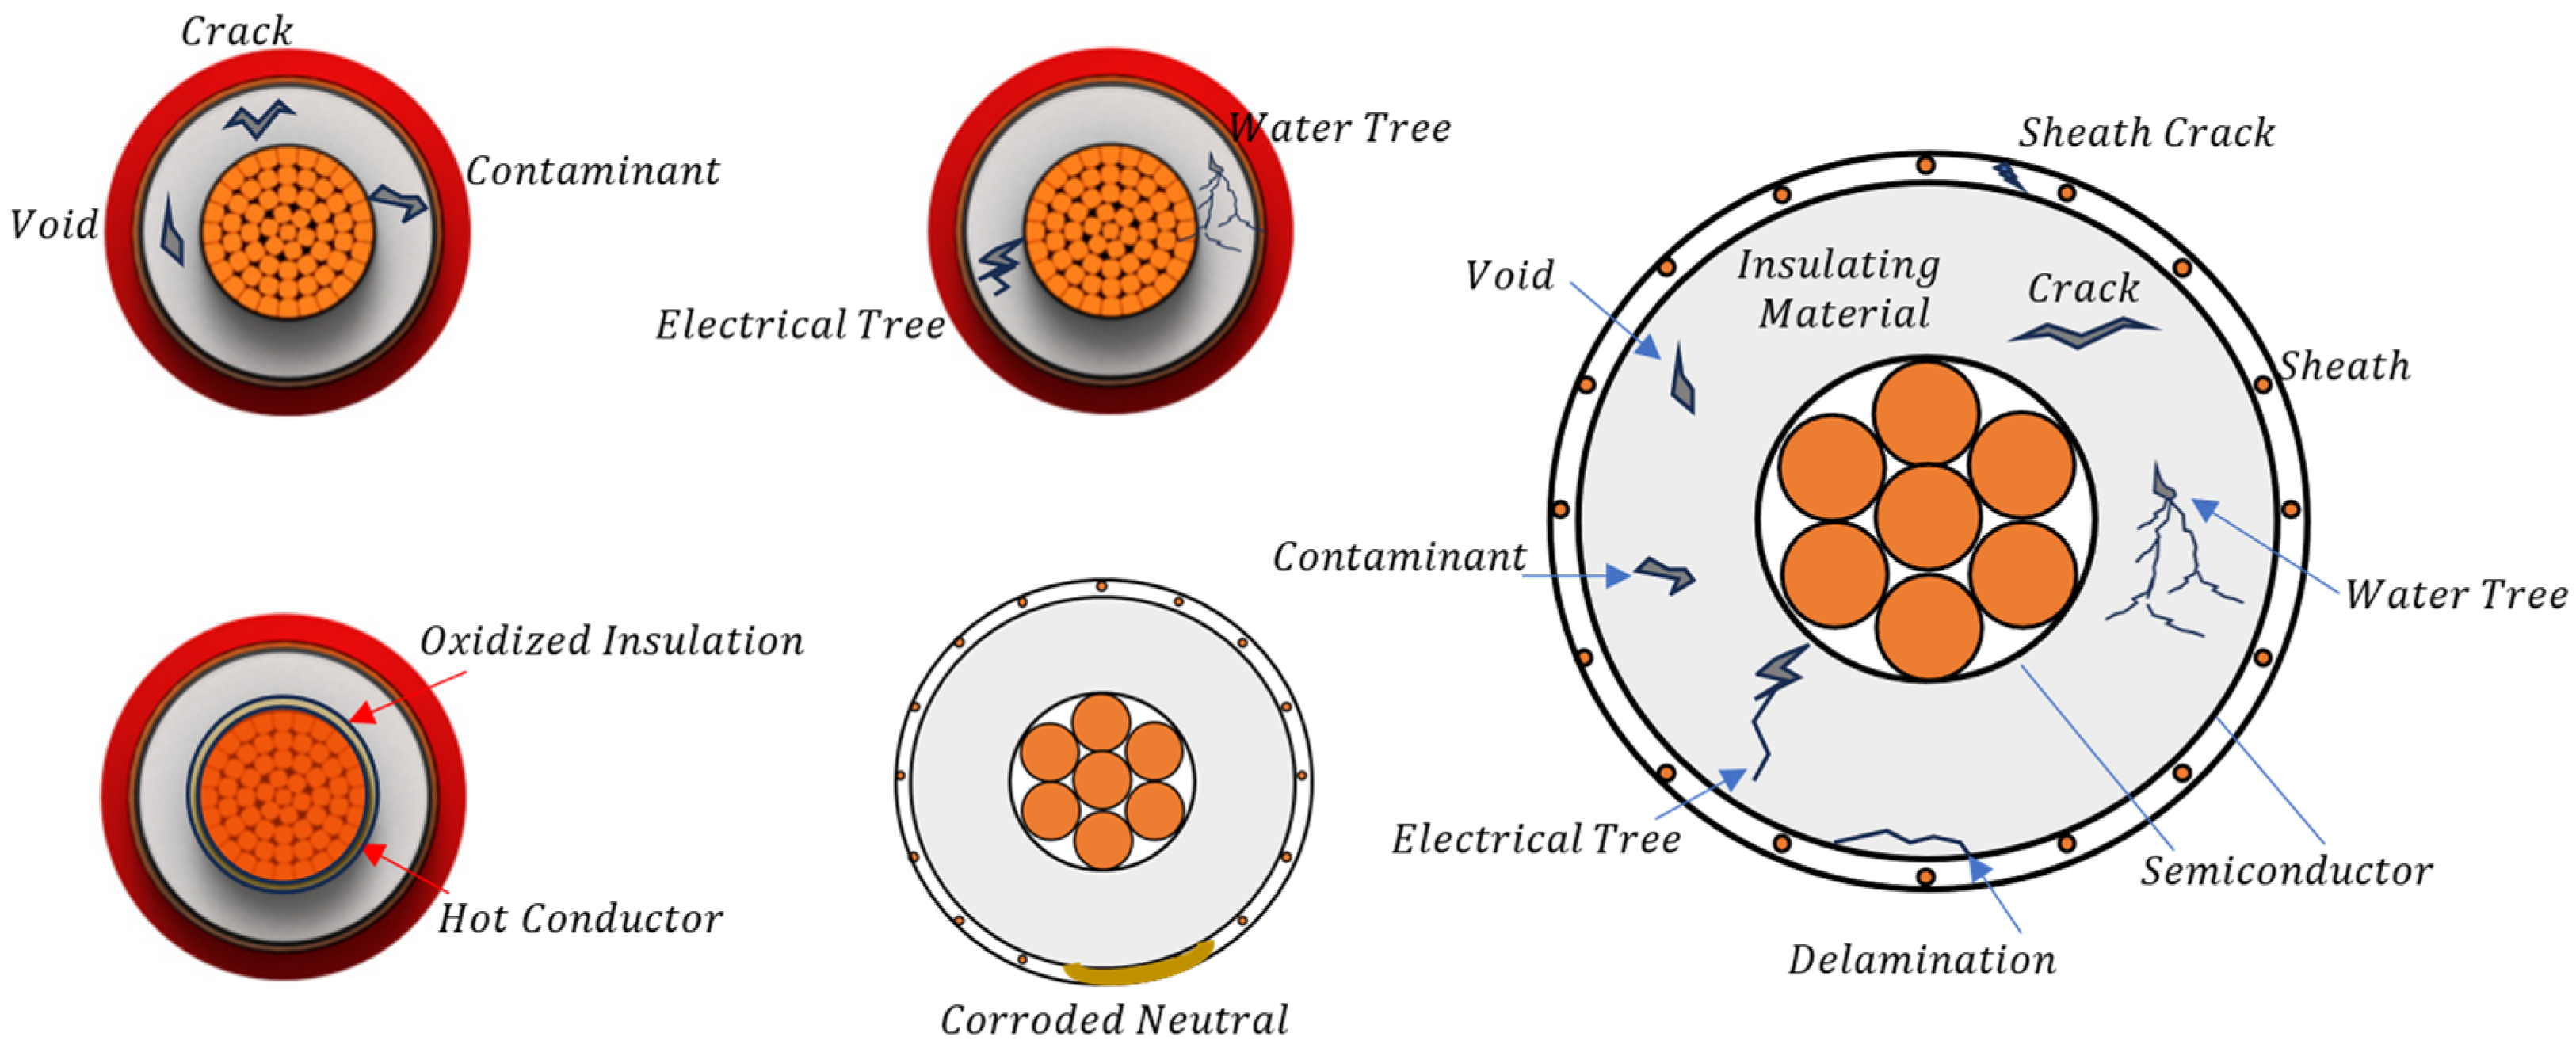
In the field MV lines, most of the infrastructures consist of underground cables and, therefore, the most widespread monitoring techniques focus on the detection of insulation malfunctions. Many of these approaches are currently used offline on de-energized cables. This means that maintenance interventions are scheduled in advance, avoiding long service interruptions to carry out tests. In this way, it is possible to identify the most common failure mechanisms and avoid excessive cable wear. Figure 7 shows the main power cable defects. Due to some defects in the manufacturing process or caused by aging, impurities can form in the material used as insulation, which can grow due to severe environmental conditions, shocks, or contamination by other external agents. When these defects compromise the external protection, they cause the corrosion of the cable sheath and the possible penetration of water and humidity. When water is present within the insulation and subjected to electrical stress, it can initiate the formation of water trees. These are small, branched channels or voids within the insulation. Furthermore, the electrical stress that occurs when the cable is energized can increase the extent of voids and small cracks. These are usually called electrical trees.
Figure 7. Typical power cable defects.
As mentioned above, problems with insulating materials are among the most frequent causes of faults in underground lines. This means that the detection of insulation degradation plays a fundamental role in preventing catastrophic consequences. The techniques most commonly used in practice to achieve this on medium-voltage cables can be summarized as follows.
-
Partial discharge (PD) measurement: it is a non-destructive test method which involves measuring the electric charges released by the cable insulation
[59][60][61].
-
Thermal imaging (TI): it is a non-contact method of detecting insulation degradation that involves taking thermal images of the cable and its components. This technique is based on the fact that insulation degradation results in increased heat generation, which can be detected through thermography
[62][63][64].
-
Electrical impedance spectroscopy (EIS): it is a non-destructive testing technique which consists of measuring the impedance of the cable insulation as a function of frequency. The technique defines the insulation resistance, which can be used to detect insulation degradation
[65].
-
Acoustic emission testing (AET): it is about detecting and analyzing the sound waves generated by the cable insulation during normal operation. In fact, the reduced elasticity of worn insulating materials causes different sound waves to be generated
[66][67].
-
Dielectric response spectroscopy (DRS): it is a testing technique that measures the dielectric response of the cable insulation to an applied AC voltage. The technique is used to detect different types of defects in medium-voltage cables
[68][69].
2.2.3. Partial Discharge Measurements
From a general point of view, partial discharge (PD) is a type of breakdown that occurs in a limited area of the insulating material due to an excessively high electric field. It is one of the most common indicators of defects and, therefore, it is widely used in prognostic systems for power equipment. The study of partial discharge measurement and location has been ongoing since the 1940s
[59], and a substantial amount of research has been performed since then
[60]. PD can occur in any equipment with insulation defects, including those with gas, oil, or solid insulation. The countermeasures for PDs can be different according to the type of system considered. Transformers and gas-insulated switchgear are among the most studied equipment in this field of application
[70]. Power lines, which include medium and high-voltage cables and related accessories, are also critical components in terms of PD
[71]. From a practical point of view, offline PD testing can easily be performed using ultra high frequency (UHF) sensors, while online monitoring is developing with many research applications
[72]. Furthermore, with the development of new application scenarios, such as DC cables, more studies on cable PD detection and analysis are being developed
[73].
The coaxial structure of a power cable constitutes a natural propagation channel for electromagnetic waves and, since PD is typically a narrow pulse containing high frequency components, it can travel within the cable as in a transmission line. Knowing the length of the cable and using specific UHF sensors, it is possible to quantify the magnitude of PD in terms of pC and then compare the magnitudes of PD obtained from different cables. As described in
[60], there are two basic conditions for having a partial discharge:
- (1)
-
An initial electron must exist for the ionization avalanche;
- (2)
-
The electric field at the specific point must be greater than the inception field.
The emission of initiatory electrons is a stochastic process which takes place after a time delay
with respect to the achievement of the inception field. In practice,
is assumed to be in the order of milliseconds or nanoseconds, and different discharge mechanisms can occur producing different voltage waveforms. To simplify, partial discharges can be divided into three categories: corona discharge, surface discharge, and internal discharge
[60]. Corona discharge is caused by the ionization of the air near the electrode, therefore it mainly concerns the conductors of the overhead lines, but it can also occur in the terminations of the cables
[74][75]. Surface discharge, on the other hand, occurs at the interface between two different dielectric materials. This problem is very common in cable joints, which are made up of several layers of solid dielectric materials
[76][77]. Finally, the internal discharge occurs within low-resistance dielectrics. The formation of cracks or air pockets in the material can cause internal partial discharges. Numerous models can be found in the literature to describe the phenomenon of partial discharges. Internal PDs are the most studied
[78]. In particular, the most common model is the three-capacity or abc model proposed by Whitehead
[79]. Further developments of this method led to the definition of the statistical distribution of PD through a Monte Carlo simulation
[80]. The main limitation of this model is that the potential along the cavity surface is not constant when PD occurs
[81]. To overcome this limitation, the induced charge model
[82] is used. The induced charge is defined as the difference between the charge on the electrode with and without discharge event. Rather than being circuit-based, this technique is field-based and allows for the derivation of analytical solutions using different defect geometries
[78]. Further considerations and other models can be found in
[60], where the first table offers a very accurate comparison.
In order to prevent PD in power cable accessories, such as joints and terminations, a possible solution is the introduction of an anti-stress cone made of a dielectric material capable of reducing electrical stress and characterized by a specially designed shape. Once PD has occurred, it is necessary to consider the cable as a transmission line to adopt effective detection methods. The lumped parameters model
[83], Bergeron model
[84], and frequency-dependent model
[85] are the three most used techniques to describe the cable behavior. The application of the model with lumped parameters is restricted to situations where the cable length is considerably shorter than the propagation time of the partial discharge (PD). Conversely, when dealing with longer cables, the distributed parameter model becomes imperative. The Bergeron model is adept at identifying the extended-wire delay of the PD throughout the cable; however, it represents line losses through lumped resistances at the line ends. The frequency-dependent model stands out as the most precise for modelling a transmission line, particularly when the distributed parameters vary with frequency. In the case of a single-core cable, a singular propagation path of the PD exists between the conductor and the shield. For multicore cables, the propagation modes become complex
[86]. The mode of propagation plays a fundamental role as it affects the position of the sensor and the detection accuracy.
The experimental procedure for offline PD testing can be summarized in the following steps:
-
Preparation: the cable is prepared for testing by isolating it from the electrical system and installing high-frequency coupling capacitors at both ends of the cable.
-
Coupling: the high-frequency signals generated by the PD are coupled into the cable using the coupling capacitors.
-
Signal amplification: the coupled signals are amplified using a high-frequency amplifier to make them easier to detect.
-
Signal detection: the amplified signals are then detected using a PD detector, which is typically a high-frequency oscilloscope or a PD analyzer.
-
Data analysis: the PD measurement data are analyzed to determine the location, type, and severity of the PD.
Once the PD signal has been generated following the above procedure, TDR is usually used to locate the problem
[87][88].
2.2.4. Thermal Imaging
Thermal imaging is commonly used for the detection of insulation degradation in medium-voltage cables
[64]. The two most widely used thermal imaging methods for medium-voltage cables are infrared (IR) thermography and lock-in thermography (LIT). Infrared (IR) thermography involves using a thermal imaging camera to detect and visualize the temperature changes in the cable insulation due to PD activity. The camera detects IR radiation emitted from the cable insulation and converts it into a visual image that can be analyzed to detect areas of PD activity. Lock-in thermography (LIT) is a more advanced thermal imaging technique that uses the lock-in principle to detect and visualize PD activity in medium-voltage cables. In this method, a modulated IR source is used to generate small temperature changes in the cable insulation, which are then detected by a thermal imaging camera. The thermal imaging camera is synchronized with the modulation frequency to enhance the sensitivity of the measurement and to reduce the influence of noise and ambient temperature fluctuations. Other results obtained by thermographic inspections in the industrial sector can be found in
[89].
2.2.5. Electrical Impedance Spectroscopy
Electrical impedance spectroscopy (EIS) is a measurement technique used to determine the electrical properties of a dielectric material. It is based on the measurement of impedance, which is a complex quantity representing resistance and reactance. EIS involves applying a small AC voltage signal to a material and measuring the resulting current. The measured impedance, which is a function of frequency, can be used to determine the electrical properties of the material such as the resistance, capacitance, and inductance. This information can be used to determine the presence and extent of defects, corrosion or other material degradation, for example in medium-voltage cables. The procedure of EIS in medium-voltage cables typically involves the following steps
[90][91]:
-
Preparation: The cable must be cleaned and insulated to ensure that the measurements are accurate and reliable. The cable must also be disconnected from any other electrical systems and grounded.
-
Connecting the measurement system: The measurement system must be connected to the cable. This is typically achieved by attaching electrodes to the cable at specific points. The measurement system consists of an AC voltage source, a current measuring device, and a data acquisition system.
-
Applying the AC voltage: The AC voltage is applied to the cable and the resulting current is measured. The voltage amplitude and frequency can be varied to obtain information about the cable’s electrical properties over a range of frequencies.
-
Data collection and analysis: The data collected from the measurement system is analyzed to obtain the impedance of the cable as a function of frequency. The impedance data can be used to calculate various electrical properties of the cable, such as the resistance, capacitance, and inductance.
2.2.6. Acoustic Emission Testing
Among the techniques capable of detecting defects in the insulating materials of medium-voltage cables, a particular approach could be the analysis of the acoustic emission. In
[66], a tool for condition-based maintenance has been developed, which allows the detection of PD through the ultrasonic measurement of the emitted signals. The partial discharge, in fact, behaves like a small local explosion giving rise to a pressure wave that propagates towards the outside. This phenomenon is characteristic of cable terminations, where it can be detected by traditional corona “guns”. A different technical solution based on a glass fiber waveguide is required for the detection of internal PDs. The waveguide introduces an attenuation level of approximately 30% into the measured signal, but is electrically insulating and, therefore, allows on-site inspection during in-service conditions. Close to the discharge, the acoustic signal has a very wide band. However, during propagation, the high-frequency components disappear due to absorption in the material. Absorption is often assumed to increase with the square root of the frequency, and can become very high for materials used in medium-voltage terminations. When choosing a sensor, the advantage of choosing a low frequency range to reduce absorption must be counterbalanced by the fact that the environmental noise is increased in the lower frequency regime. In recent papers, acoustic emission measurements are integrated into very complex systems to detect PDs. For example, ref.
[70] introduces a new on-line partial discharge monitoring system for power transformers. It is based on the simultaneous use of three methods: high frequency (HF), ultra high frequency (UHF) and acoustic emission (AE). The article discusses the design process in detail and builds individual system hardware modules and software layers. Also, the results of the analysis carried out using acoustic emission and thermal imaging for a specific oil filled power transformer are presented in
[67].
A possible practical procedure for AET in medium-voltage cables can be organized as follows:
-
Cable preparation: the cable must be taken out of service and cleaned.
-
Transducer placement: acoustic emission transducers must be placed on the cable in order to detect any acoustic signals emitted by the cable during the testing process.
-
Excitation: a high-frequency or impulse excitation is applied to the cable in order to induce partial discharges or other faults within the cable.
-
Signal detection: the acoustic emission transducers detect the acoustic signals emit-ted by the cable and send the signals to a data acquisition system for analysis.
-
Data analysis: the acoustic signals collected during the test are analyzed using spe-cialized software to determine the location, magnitude, and duration of any cable problems.
Note that acoustic emission (AE) transducers are devices used to detect and measure sound waves produced by mechanical or structural changes within materials. There are two types of AE transducers: piezoelectric and piezoresistive. The former convert mechanical stress into an electrical signal, while piezoresistive transducers change their electrical resistance in response to mechanical stress. AE transducers can be mounted on the surface of a material or embedded within it. They are not usually used online due to difficult access to underground cables.
2.2.7. Dielectric Response Spectrometry
Dielectric response spectrometry belongs to the same category as EIS, but the main difference between these two methods lies in their approach to testing and the type of information they provide. DRS measures the dielectric response of the material being tested to an applied electrical field, while EIS measures the impedance of the material to an alternating current. DRS is particularly useful for evaluating the quality and aging of insulating materials, and can provide information on the dielectric properties over a range of frequencies. On the other hand, EIS can be used to determine the presence of partial discharge or other electrical faults within the cable, and to monitor the changes in the electrical characteristics of the cable over time. In
[92], dielectric spectroscopy measurements of medium-voltage XLPE cable terminations are presented. They consist of measurements of capacitance and losses as a function of frequency. The practical procedure for performing DRS can be organized as follows:
-
Preparation: the cable must be taken out of service.
-
Connections: The cable or insulation sample is connected to the testing equipment, which consists of a frequency response analyzer and a high-voltage amplifier.
-
Voltage application: the frequency response analyzer outputs sinusoidally shaped voltages at different levels up to two times the service voltage in a frequency range from 100 Hz to 0.1 mHz. The voltage is then amplified in the high-voltage amplifier and measured through a high-voltage divider.
-
Data acquisition: The measurement data are recorded as a frequency-dependent complex capacitance ( ). These data include the ordinary capacitance ( ) and the dielectric loss component ( ), both expressed in pF.
-
Analysis: the data are analyzed to determine the loss angle ( ).
The occurrence of water trees has a significant influence on the dielectric response. The study presented in
[92] aimed to determine the impact of different types of cable terminations on the prognostic measurements of medium-voltage XLPE cables using high-voltage dielectric spectroscopy. The terminations have been divided into two groups: linear and non-linear, based on their response to voltage. The linear terminations exhibited geometric field classification, while the nonlinear terminations had a combination of nonlinear resistive and refractive classification. The results indicated that linear terminations increased the measured loss compared to cables without terminations. Nonlinear terminations not only increased the loss, but also resulted in a voltage-dependent increase in both the loss and capacitance. All terminations had less impact at higher frequencies. The critical length of a new XLPE cable, beyond which the impact of terminations decreases, was found to be between 30 m and 300 m. These considerations are essential to distinguish the response in the presence of water trees from the effect of the terminations.
 +1 credit