Your browser does not fully support modern features. Please upgrade for a smoother experience.
Submitted Successfully!
 +1 credit
Thank you for your contribution! You can also upload a video entry or images related to this topic.
For video creation, please contact our Academic Video Service.
| Version | Summary | Created by | Modification | Content Size | Created at | Operation |
|---|---|---|---|---|---|---|
| 1 | Dennis Bergmans | -- | 3881 | 2023-10-27 11:08:05 | | | |
| 2 | Rita Xu | Meta information modification | 3881 | 2023-10-27 11:15:31 | | |
Video Upload Options
We provide professional Academic Video Service to translate complex research into visually appealing presentations. Would you like to try it?
Cite
If you have any further questions, please contact Encyclopedia Editorial Office.
Heines, S.J.H.; Becher, T.H.; Van Der Horst, I.C.C.; Bergmans, D.C.J.J. Electrical Impedance Tomography. Encyclopedia. Available online: https://encyclopedia.pub/entry/50871 (accessed on 24 June 2026).
Heines SJH, Becher TH, Van Der Horst ICC, Bergmans DCJJ. Electrical Impedance Tomography. Encyclopedia. Available at: https://encyclopedia.pub/entry/50871. Accessed June 24, 2026.
Heines, Serge J. H., Tobias H. Becher, Iwan C. C. Van Der Horst, Dennis C. J. J. Bergmans. "Electrical Impedance Tomography" Encyclopedia, https://encyclopedia.pub/entry/50871 (accessed June 24, 2026).
Heines, S.J.H., Becher, T.H., Van Der Horst, I.C.C., & Bergmans, D.C.J.J. (2023, October 27). Electrical Impedance Tomography. In Encyclopedia. https://encyclopedia.pub/entry/50871
Heines, Serge J. H., et al. "Electrical Impedance Tomography." Encyclopedia. Web. 27 October, 2023.
Copy Citation
Electrical Impedance Tomography (EIT) is a non-invasive bedside imaging technique that provides real-time lung ventilation information on critically ill patients. EIT can potentially become a valuable tool for optimising mechanical ventilation, especially in patients with acute respiratory distress syndrome (ARDS).
acute respiratory distress syndrome
COVID-19
electrical impedance tomography
1. Introduction
Mechanical ventilation is used in intensive care units to support patients with respiratory failure. However, this intervention has potential adverse effects, referred to as ventilator-associated lung injury (VALI). Over the past two decades, extensive research has focused on lung-protective ventilation for mitigating VALI. ARDSNet investigators published influential work in 2000 highlighting the importance of avoiding high tidal volumes in patients with acute respiratory distress syndrome (ARDS) [1]. Subsequent studies investigating high vs. low levels of positive end-expiratory pressure (PEEP) have consistently failed to demonstrate a reduction in mortality or have been refuted by other studies [2][3][4]. Various ventilation strategies, such as stress index [5][6], transpulmonary pressure [7][8], and pressure–volume curves, have been explored to determine the optimal PEEP setting [9][10]. Other frequently used bedside parameters to evaluate the effect of recruitment manoeuvres and PEEP settings are variables that reflect changes in respiratory system compliance or oxygenation [11][12][13][14]. However, these parameters are all based on global pulmonary function and do not provide regional information. Therefore, an individualised patient-centred approach for the adjustment of tidal volume and PEEP setting seems favourable. Depending on the heterogeneous distribution of the fluid-filled and atelectatic alveoli, different lung regions are prone to collapse or overdistension. Even with low driving pressure, a low tidal volume can generate local high lung strain [15].
Electrical impedance tomography (EIT) is a non-invasive, radiation-free, bedside monitoring tool that provides functional images of the lung with a relatively low spatial but very high temporal resolution. It was invented nearly 40 years ago [16] and uses small alternating currents to generate images that represent the regional distribution of resistivity within a body. The term tomography refers to imaging the volume within the body by penetrating energy from the outside. Impedance is a complex quantity that specifically applies to alternating current circuits. It includes both a real part (resistance) and an imaginary part (reactance). In clinically available chest EIT systems, 16–32 electrodes are attached around the patient’s chest circumferences, small alternating currents are applied between pairs of electrodes, and the resulting voltage differences are recorded by the other electrodes. The internal conductivity distribution within the chest was estimated using the measured voltages in an iterative process to determine the internal conductivity distribution that best matches the measured voltages. According to the incorporated image reconstruction algorithm, this process results in a two-dimensional tomogram. One EIT frame generates one reconstructed image, usually with a 32 × 32-pixel matrix, at a given time point during breathing. EIT allows clinicians to monitor the lung response to any ventilator setting adjustment on a breath-by-breath basis, enabling visualisation of regional alveolar overdistension and collapse, ventilation delay, and flow [17][18][19]. By determining the regional ventilation distribution, EIT can individually optimise the ventilator settings and probably improve patient outcomes.
2. Clinical Applications
2.1. Positive End-Expiratory Pressure and Tidal Volume Settings
2.1.1. Calculation of Alveolar Overdistension and Collapse
The optimal PEEP for individual patients at a particular time within the treatment period remains disputed [20][21]. Assessment of proxy parameters such as oxygenation, best compliance, stress index, and low-flow pressure–volume curves may be misleading, as they are all based on global measures that exclude regional overdistension, collapse, or atelectrauma, especially in patients with ARDS because it is a heterogeneous process. Different regions of the lung have varying degrees of disease. According to Gattinoni et al., optimal PEEP is defined as the best compromise between regional overdistension and collapse. On the other hand, he stated that one “optimal” PEEP for the whole lung does not exist [22]. Regional overdistension and alveolar collapse can be visualised using EIT by calculating the regional compliance [17]. During mechanical ventilation, compliance can be calculated by dividing tidal volume by driving pressure. Electrical impedance tomography can monitor local impedance changes; in this way, local volume changes can be estimated by regional changes in lung impedance. Regional compliance can then be calculated by dividing regional tidal impedance variation by driving pressure [23][24]. In clinical practice, the most widely used method for titrating PEEP and tidal volume with EIT is the regional compliance-based approach [17]. The practical approach includes performing a decremental PEEP trial starting from the highest clinically acceptable PEEP level and then reducing the PEEP in small steps (e.g., 2 cmH2O) until the lowest clinically acceptable PEEP level is reached [25]. With this approach, the EIT can assess derecruitment and end-inspiratory overinflation within the two-dimensional electrode plane during a decremental PEEP trial.
Titrating PEEP based on regional compliance measurements is difficult because both overdistension and collapse can result in decreased compliance but would require opposite titration strategies. However, optimal regional compliance at different PEEP settings differs between the cranial and caudal levels for dependent and non-dependent lung regions [26]. Nevertheless, this method has been successfully applied in several studies [27][28][29][30][31][32][33]. Based on this method, PEEP is frequently set at the “crossover point”, representing the “best compromise” between alveolar overdistension and alveolar collapse [34][35][36][37]. Hsu et al. showed that selecting PEEP according to this method resulted in a lower PEEP, lower driving pressure, and higher survival rate compared with PEEP set at the pressure where maximal hysteresis was reached during a low-flow pressure–volume loop in moderate-to-severe ARDS [38]. However, the best balance between alveolar overdistension and collapse could result in a large amount of overdistension in combination with a large amount of alveolar collapse (i.e., overdistension and collapse coexist), particularly in patients with ARDS because of the heterogeneity of the diseased lung [29]. Therefore, others have defined optimal EIT-guided PEEP as alveolar collapse ≤ 5% [25][26] (Figure 1). Simultaneously, if a large amount of overdistension exists, the tidal volume (driving pressure) can decrease.
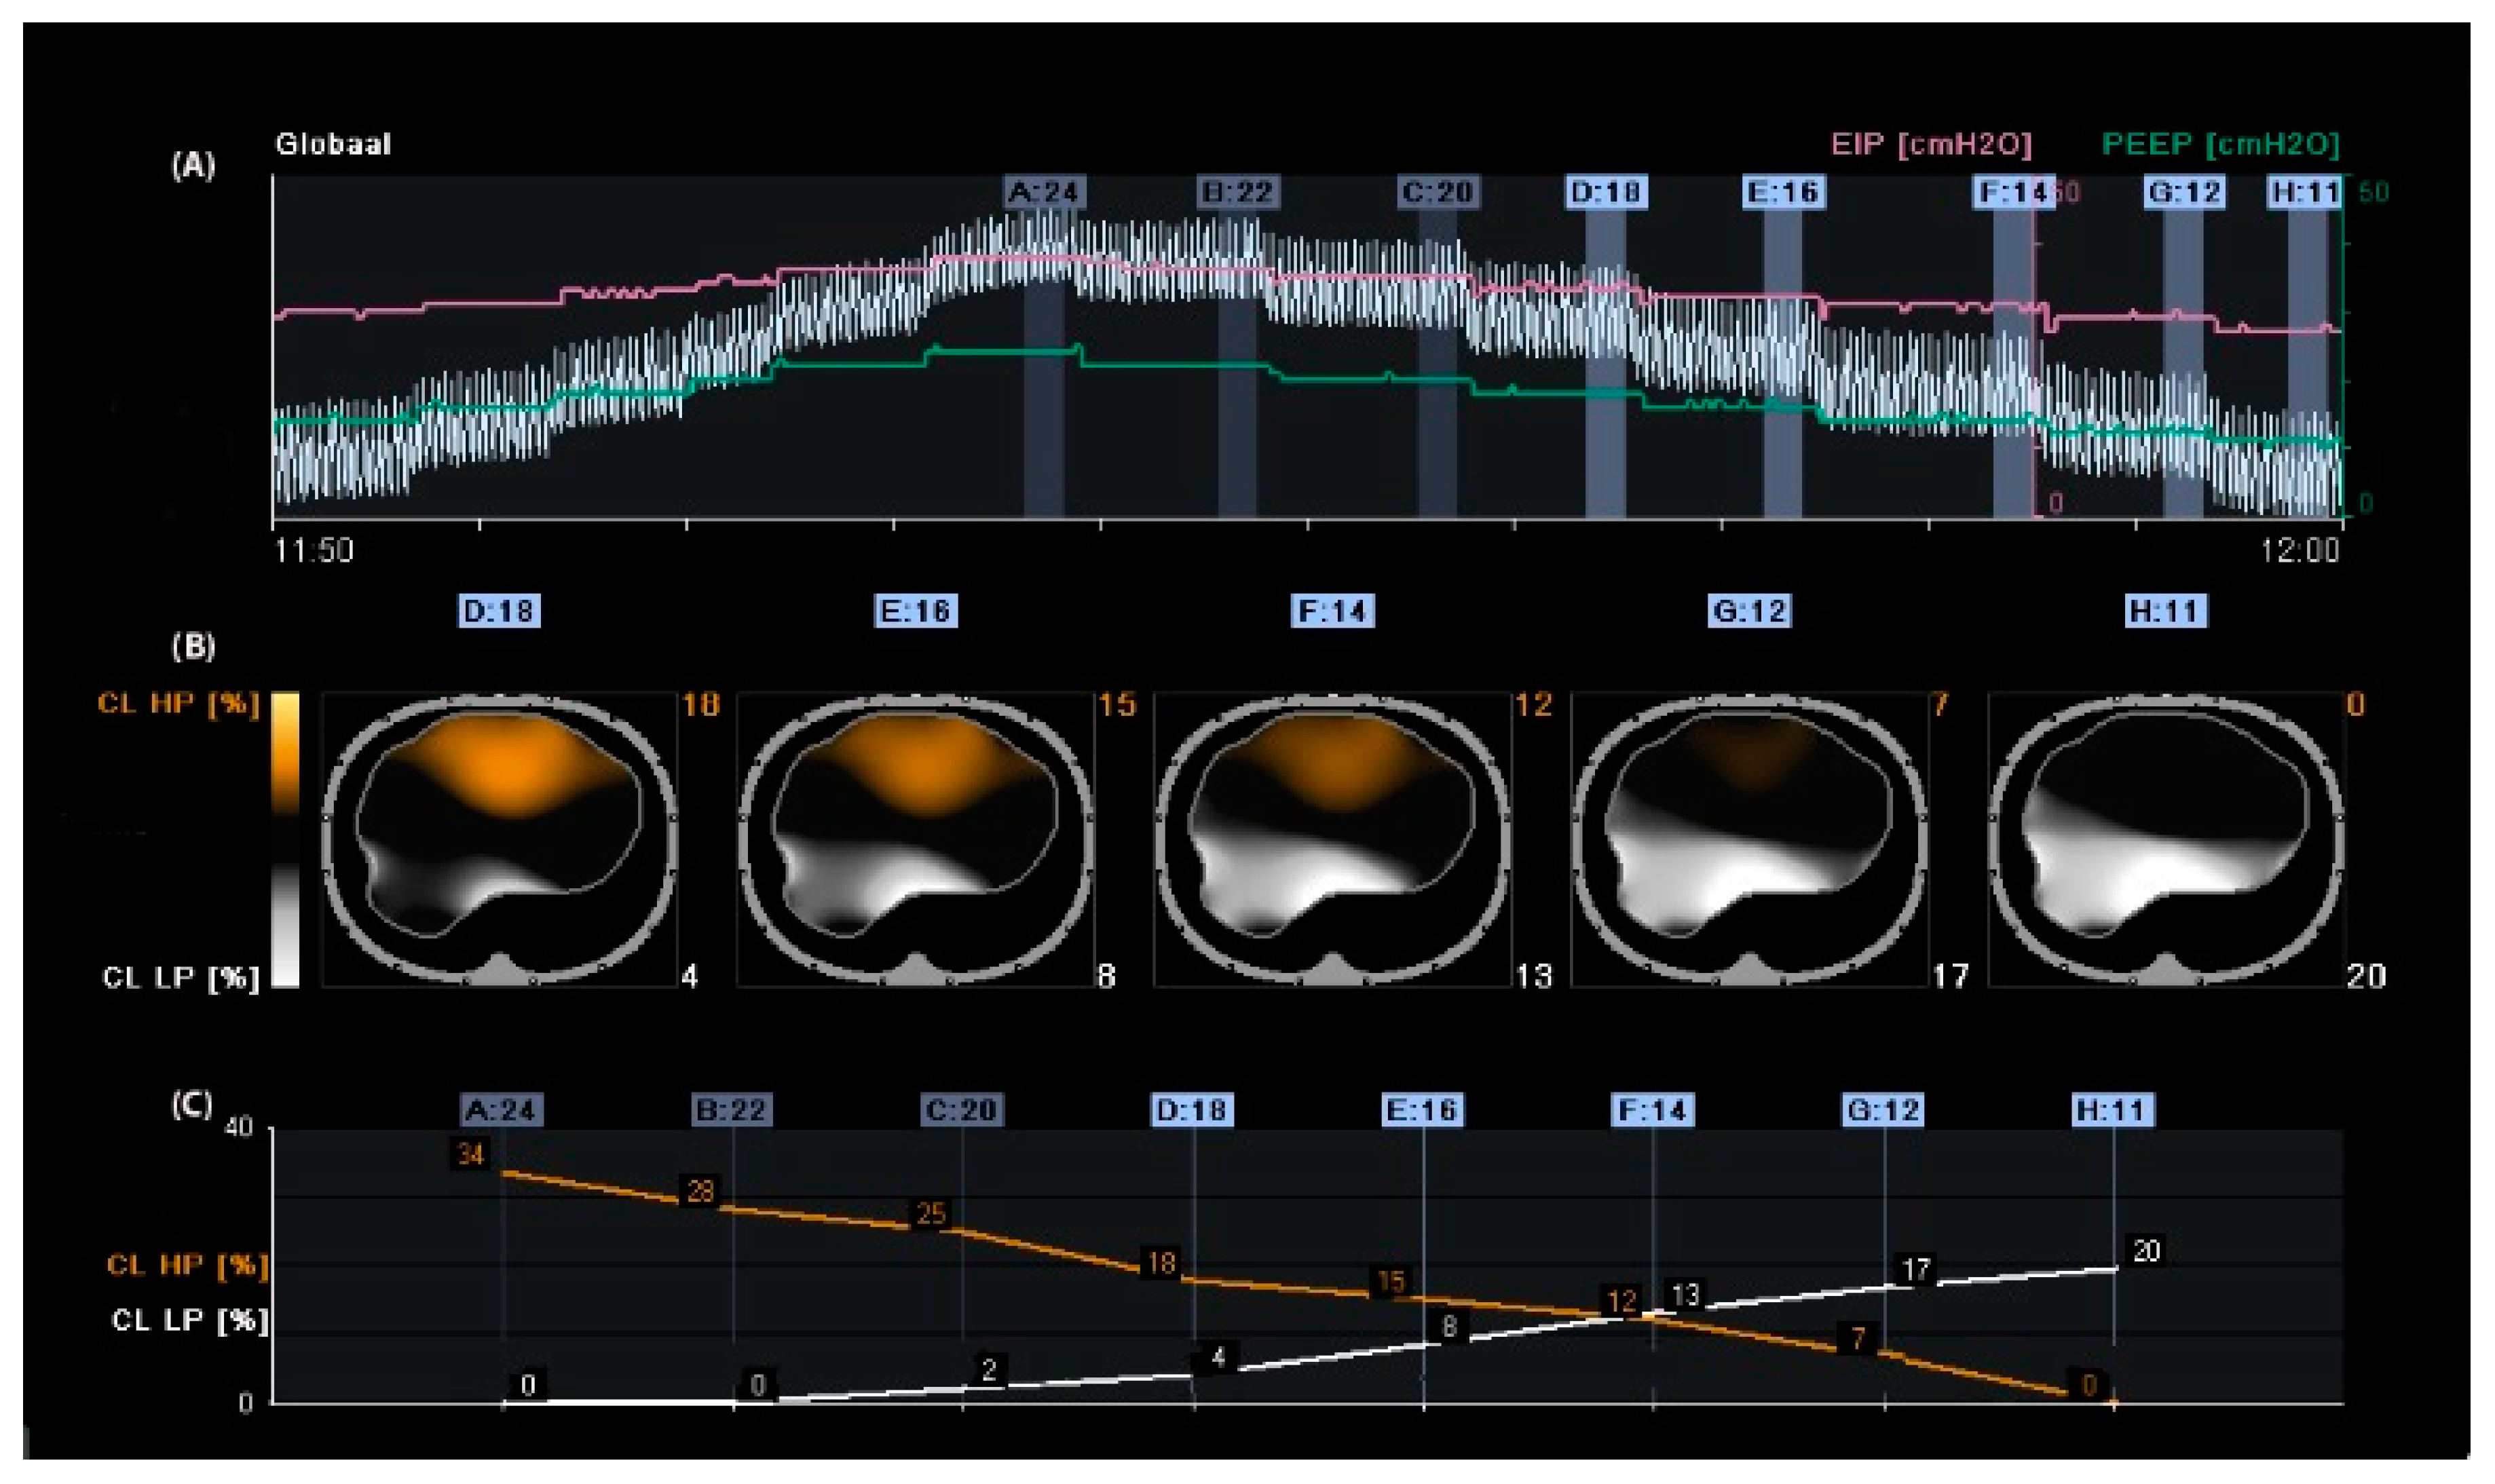
Figure 1. Regional compliance changes during the decremental positive end-expiratory pressure (PEEP) trial. Panel (A): Time course of the global impedance signal during an incremental and decremental PEEP trial. The decremental PEEP trial started from a PEEP of 24 cmH2O until a PEEP of 11 cmH2O. The last breaths of each PEEP step were averaged and used to analyse regional compliance. The green line represents the PEEP level, and the pink line represents the end-inspiratory pressure. Panel (B): Visualisation of relative compliance loss toward higher PEEP levels (CL HP, orange), which could be interpreted as relative alveolar overdistension, and compliance loss towards lower PEEP levels (CL LP, white), which could be interpreted as relative alveolar collapse. Panel (C): Time course of CL HP (orange) and CL LP (white). The PEEP level closest to the intersection of both lines represents the “best compromise” between alveolar overdistension (12%), collapse (13%), and PEEP of 14 cmH2O. The PEEP level with a CL LP of ≤5% would result in a PEEP of 18 cmH2O, resulting in a CL HP of 18%; in this case, the tidal volume would be reduced.
The debate regarding optimal PEEP remains unresolved, and using proxy parameters such as oxygenation and compliance may be misleading due to the heterogeneous nature of ARDS. The most reliable method for titrating PEEP is the regional compliance-based approach using EIT, which can visualise and calculate regional overdistension and alveolar collapse.
2.1.2. Positive End-Expiratory Pressure Based on Changes in End-Expiratory Lung Impedance
Another way to titrate PEEP and quantify lung recruitment is by measuring changes in end-expiratory lung impedance (EELI) [39]. Changes in tidal impedance have been correlated with regional tidal volumes [40][41]. Therefore, changes in EELI may be used to quantify regional changes in end-expiratory lung volume [42][43]. However, when EIT is measured at only one thoracic level, there is only moderate agreement between changes in EELI and end-expiratory lung volume during a PEEP trial [44]. As shown in Figure 1, an increase in PEEP resulted in higher EELI (end-expiratory lung volume). During a decremental PEEP trial, a gradual decrease in EELI at a fixed PEEP level may indicate loss of end-expiratory lung volume, which can be interpreted as derecruitment (Figure 2). In this case, PEEP can be set to a higher level where a decrease in EELI does not occur [27][45][46]. However, this method is less accurate; changes in the EELI at the bedside are global or divided into a few regions of interest and not pixel-wise. Furthermore, changes in EELI are sensitive to artefacts. Currently, alternating-pressure mattresses are commonly used in intensive care to prevent pressure ulcers. These can cause substantial changes in EELI, which cannot be explained by changes in end-expiratory lung volume [47].
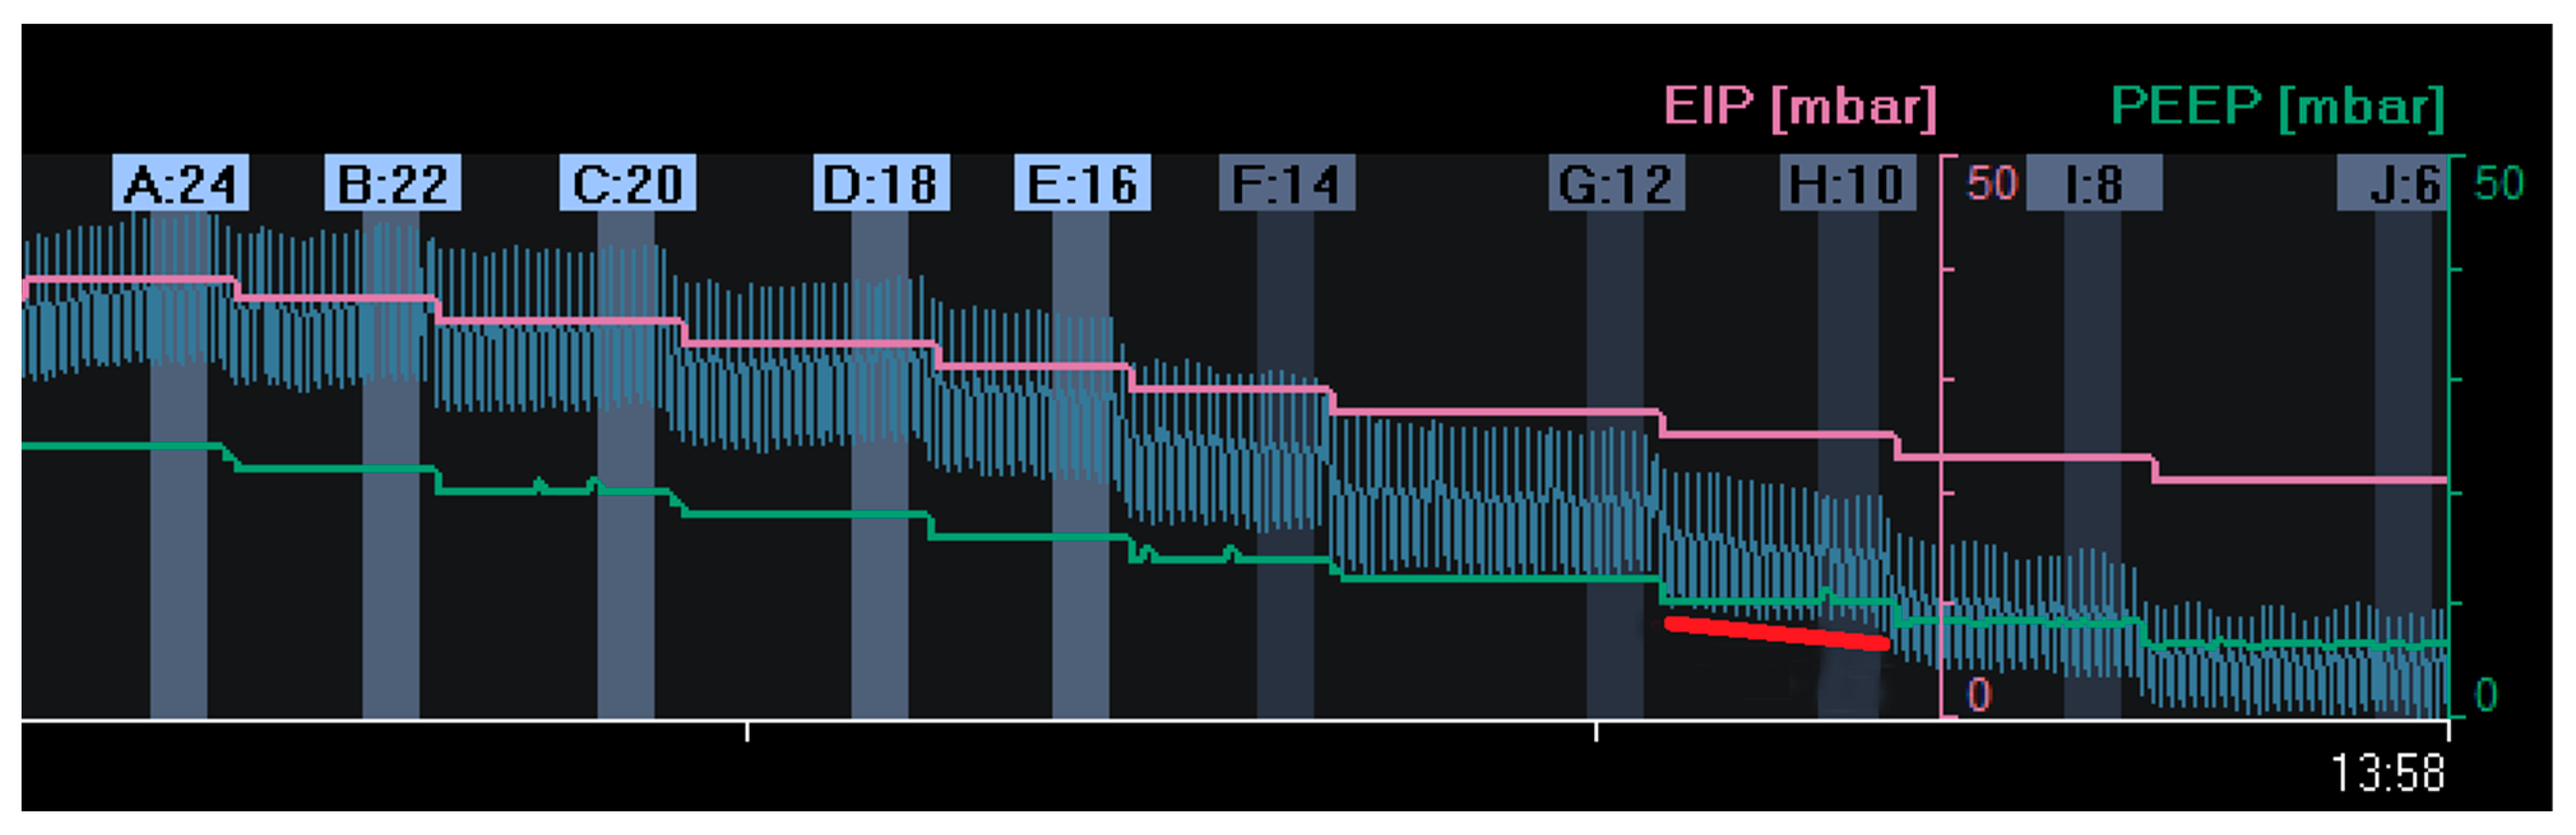
Figure 2. Changes in end-expiratory lung impedance (EELI): A decrease in EELI at different decremental PEEP levels reflects a stepwise decrease in end-expiratory lung volume with lower PEEP. At a PEEP level of 10 mbar (H:10), there was a gradual decrease in EELI (red line), reflecting alveolar derecruitment. (EIP = End Inspiratory Pressure; PEEP = Positive End Expiratory Pressure).
A simple way to counteract this problem is to set the mattress to static mode before starting the EIT measurement. Unfortunately, these artefacts also occur during patient movement [48], which may be more difficult or impossible to address in clinical practice. Intravenous fluid admission can cause substantial changes in EELI [49][50]. Positive end-expiratory pressure titration based on the EELI trend suggests higher PEEP settings than the regional compliance method [51], which may be because, in contrast to the latter, it only assesses lung recruitment and derecruitment but provides no information about regional lung overdistension. Furthermore, it was impossible to compare changes in EELI using repeated measures at different time points. Skin conditions, electrode position, and environmental conditions influence the baseline frames and corresponding EELI values. Therefore, EELI values are not comparable at different time points when the electrode belt is detached and reattached to a patient [52].
However, measuring end-expiratory lung impedance changes (EELI) can provide information on lung recruitment but may not be accurate for detecting lung overdistension. It is also challenging to interpret and compare changes over time due to the global or regional nature of the changes and the presence of artefacts.
2.1.3. Setting PEEP in Patients with Spontaneous Breathing Activity
In mechanically ventilated patients, early restoration of spontaneous breathing is beneficial for improving oxygen delivery and shortening the duration of mechanical ventilation. Excessive spontaneous breathing efforts, however, may cause additional harm via a variety of mechanisms that are nowadays referred to as “patient self-inflicted lung injury” (P-SILI) [53]. The pendelluft phenomenon, which is the movement of air within the lung from non-dependent to dependent regions without change in tidal volume, can be visualised by EIT. This phenomenon can cause cyclic alveolar recruitment and can result in local trauma, mainly in the dependent lung fields [54]. Applying higher PEEP levels may decrease the magnitude of spontaneous effort and improve lung ventilation homogeneity by opening up partially closed alveoli, suggesting that this may lead to less injurious ventilation [55][56]. In contrast, healthy lung tissue may be overdistended when PEEP levels are too high, inducing ventilator-associated lung injury [57]. Thus, determining the optimal PEEP level is challenging for patients undergoing assisted mechanical ventilation.
The drawback of most currently available algorithms for titrating PEEP is that their use is limited to patients on controlled mechanical ventilation. The regional compliance-based approach for calculating the level of alveolar overdistension and collapse is not readily feasible during assisted mechanical ventilation or spontaneous breathing. A reliable assessment of respiratory system compliance is required to obtain valid results. Elimination of spontaneous breathing requires neuromuscular paralysis or deep sedation. A fundamental assumption of the EIT respiratory system compliance measurement is that pressure changes are uniform throughout the lung when the flow reaches zero after inspiration and expiration. Within spontaneous breathing, the negative inspiratory pleural pressure swing following diaphragmatic contraction is not evenly distributed across the lungs because it acts mainly on the dorsal (dependent) lung regions, which could result in inaccurate quantification of the regional respiratory system compliance calculation during spontaneous breathing [58].
A promising new algorithm was recently developed for quantifying regional lung mechanics, independent of a stable plateau pressure phase, based on the regional peak flow using EIT. The highest regional peak flow was calculated during a decremental PEEP trial (similar to the regional compliance-based approach), and regional alveolar overdistension and collapse were calculated in patients undergoing assisted mechanical ventilation or spontaneous breathing efforts (Figure 3). This method was validated in a prospective cohort of mechanically ventilated patients with COVID-19 ARDS in a controlled mechanical ventilation mode. There was a good correlation between the levels of alveolar overdistension and collapse based on the highest regional peak flow and alveolar overdistension and collapse based on the regional compliance-based approach [19].
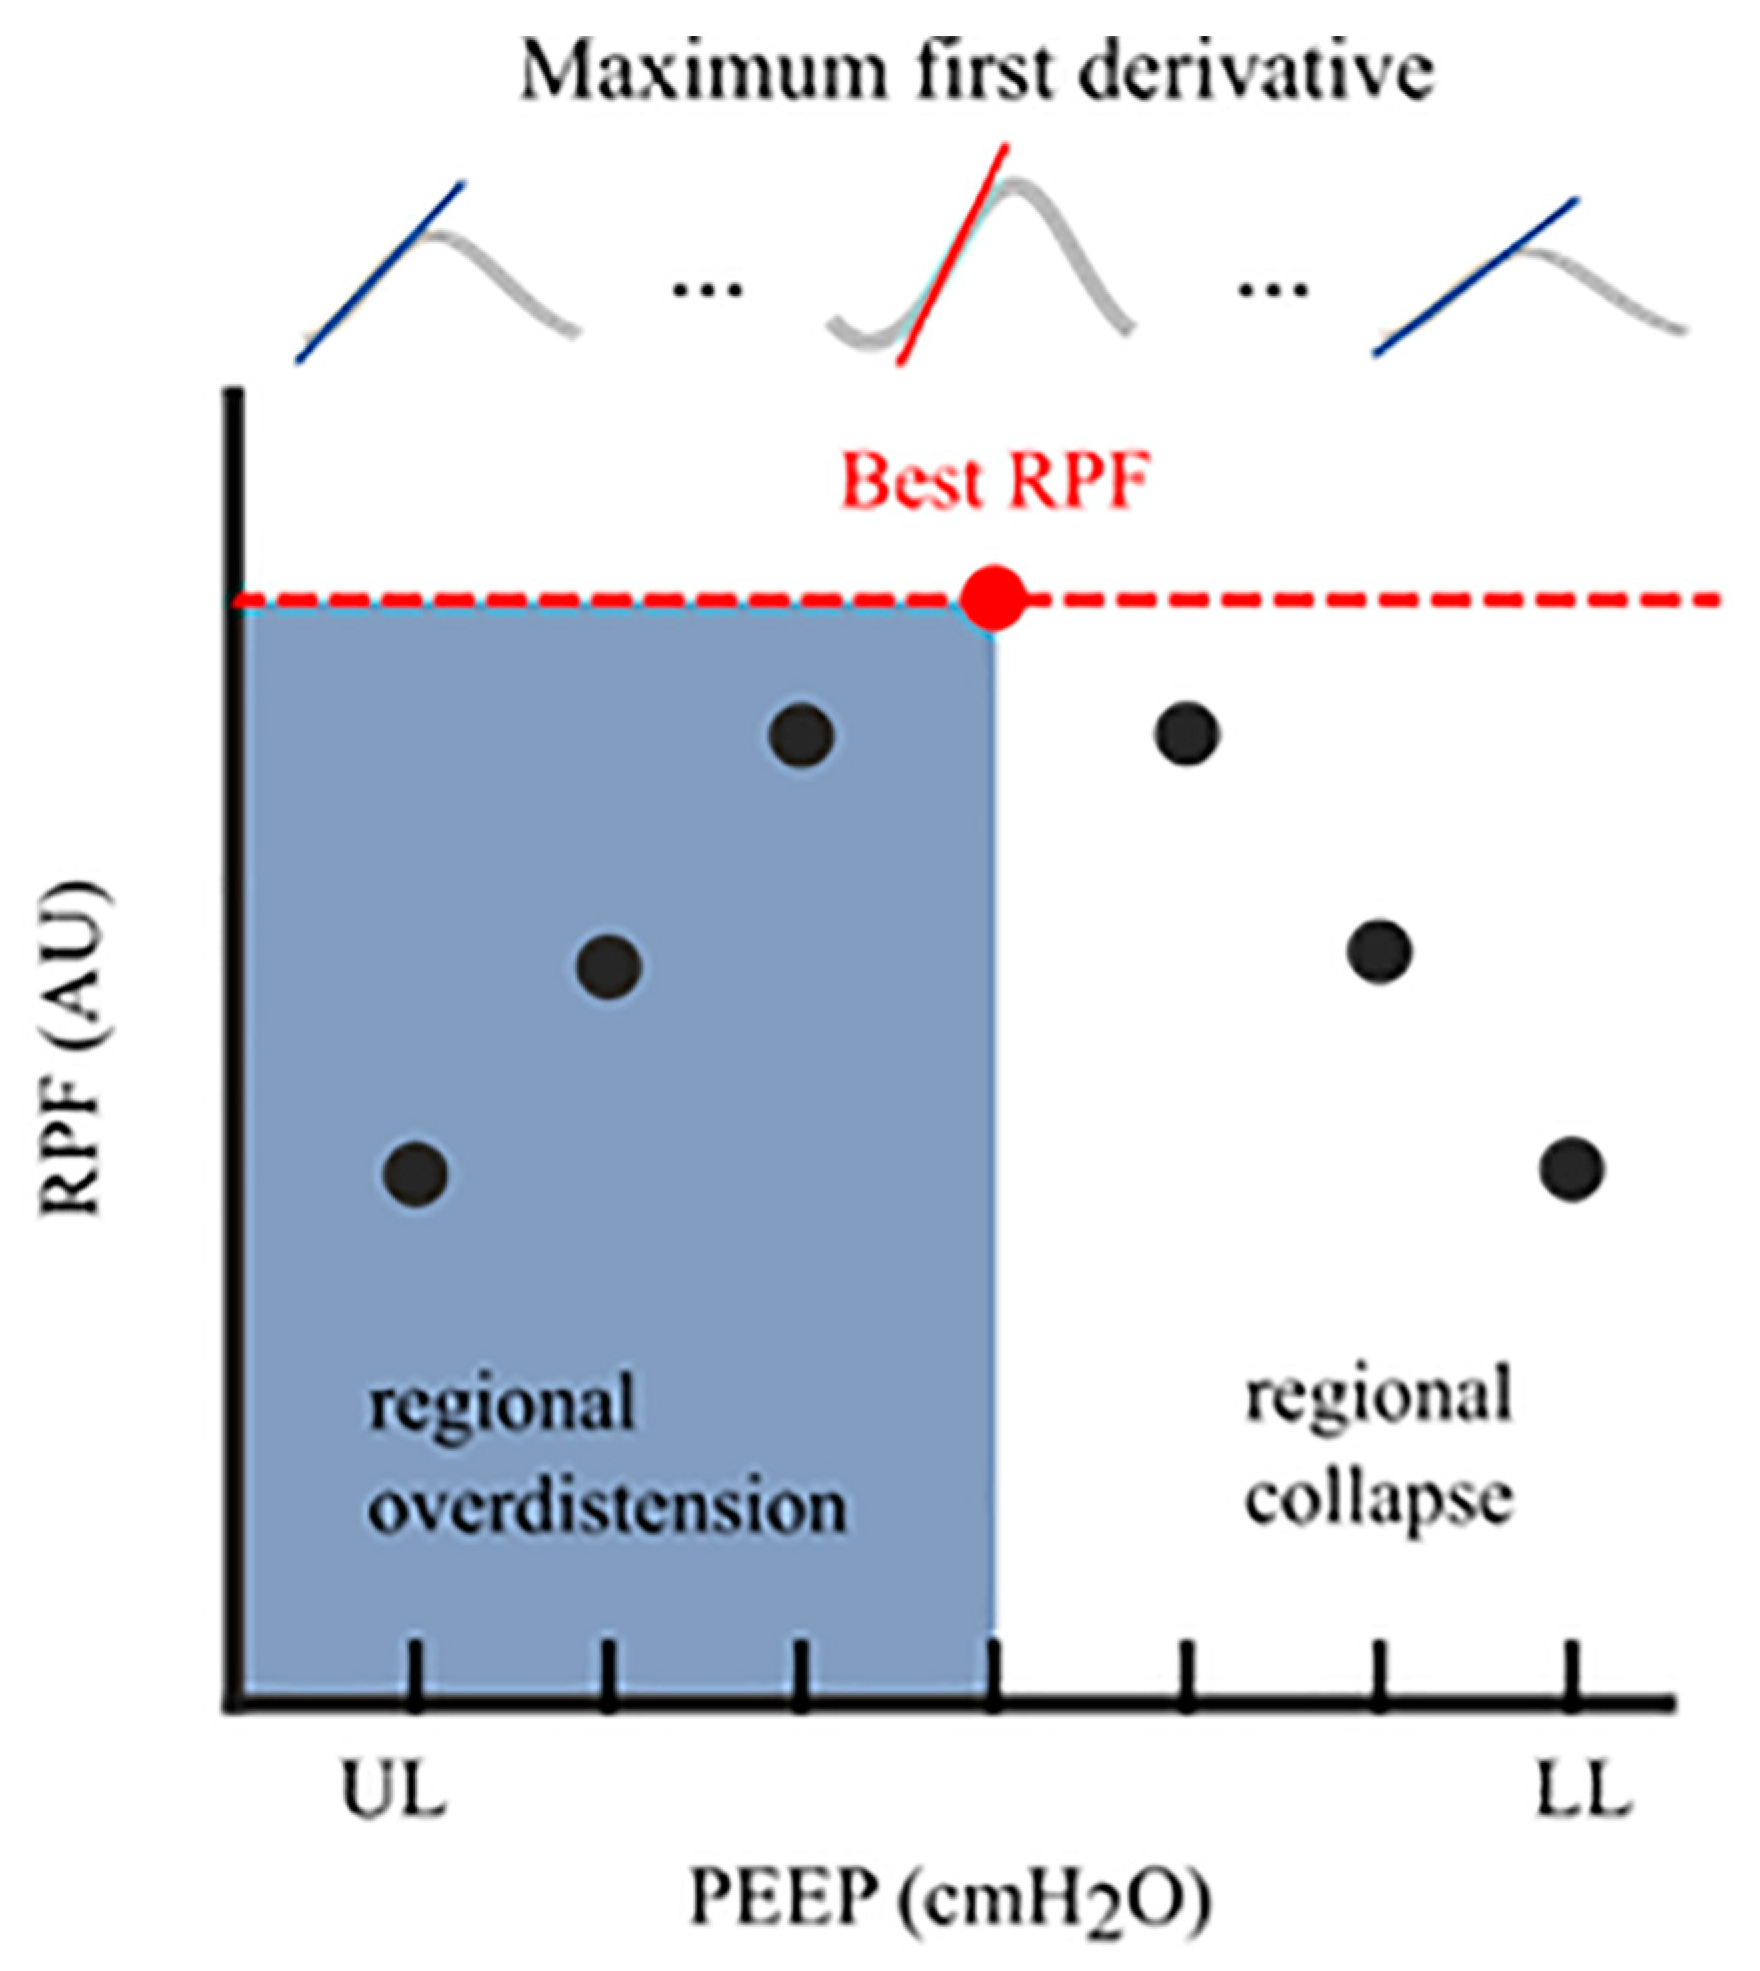
Figure 3. Regional Peak Flow (RPF): In each aerated pixel, the maximum first derivative (i.e., regional peak flow) was calculated for all segmented breaths at an arbitrary PEEP level. This resulted in median regional peak flow per PEEP level. The highest peak flow reflected the optimal PEEP level with the lowest level of alveolar collapse and alveolar overdistension. The cumulative collapse and overdistension rates were calculated identically to Costa’s algorithm. RPF, regional peak flow; AU, arbitrary unit; UL, upper limit; LL, lower limit; PEEP, positive end-expiratory pressure.
3. Measures of Ventilation Distribution
3.1. Anterior-to-Posterior Ventilation Ratio (Impedance Ratio)
A standard and easy-to-use measure of anterior–posterior ventilation distribution is the anterior-to-posterior ventilation ratio (A/P ratio) [59][60]. This ratio was initially called the Impedance Ratio (IR) [61], which is still used in the literature sometimes. The tidal impedance difference (the impedance change between the end and the beginning of inspiration) in the non-dependent part of the lung was divided by the tidal impedance difference in the dependent part of the lung. A decrease in the A/P ratio indicates an increase in ventilation in the dependent part of the lung above the non-dependent part and a ventilation distribution shift from the ventral to the dorsal parts of the lung. An A/P ratio of “1” indicates equal ventilation distribution in the ventral part of the lung compared to that in the dorsal part. As the ventral and dorsal halves of the lung are not identical, the A/P ratio is not expected to be equal to one, even in the case of healthy lungs. In ARDS patients, a higher PEEP results in a decrease in the A/P ratio [62].
In addition to a higher PEEP level, enhanced spontaneous breathing may increase the proportion of tidal ventilation reaching the dependent lung regions in patients with ARDS, likely indicating a higher efficiency of the posterior diaphragm that leads to a decrease in the A/P ratio [63]. In neonates, the A/P ratio has been used to select the “optimal PEEP” by choosing a PEEP level in which the A/P ratio is closest to “1” [59]. Another study on patients with early mild ARDS compared the optimal PEEP guided by the open lung concept strategy with the ARDS network protocol [1][64]. The anterior-to-posterior ventilation ratio was used to indicate the effect of the open-lung concept, and the PEEP selected for the open-lung concept was significantly higher than that of the ARDS network table. The A/P ratio decreased after applying the open-lung concept. The A/P ratio has been widely used; however, this measure is less robust than other measures, such as the centre of ventilation, and its specificity of ventilation shift is much smaller than that of the conventional centre of ventilation [65].
In short, the A/P ratio (A/P ratio) is a standard and easy-to-use measure of ventilation distribution in the lungs. An A/P ratio of “1” indicates equal ventilation distribution between the ventral and dorsal parts of the lung. Higher PEEP decreased the A/P ratio in patients with ARDS, indicating more homogeneous ventilation. However, the A/P ratio was less robust than other measures, such as the centre of ventilation.
3.2. Centre of Ventilation
The centre of gravity was used synonymously with the centre of ventilation (CoV) introduced by Frerichs et al. [66]. The term centre of gravity is not recommended because it is used in mechanics and is defined as the average location of the weight of an object [65]. CoV describes the distribution of ventilation between the ventral and dorsal lung regions. This calculation can be performed separately for the right and left lungs. In this case, the weighted mean was also calculated (considering the possible differences in the ventilation magnitudes for the left and right sides). A value of 50% represents equally distributed ventilation between ventral and dorsal regions. Higher values represent a shift of ventilation distribution towards the dorsal regions (Figure 4, bottom of the image), and lower values represent a shift towards the ventral regions. This may be confusing because in some papers, the values are inverted, meaning that 100% is the most ventral region [67]. CoV was first introduced to describe the ventilation distribution during spontaneous breathing before and after surgery and its difference compared with mechanically ventilated patients [66]. It is a sensitive index that describes alveolar recruitment during a decremental PEEP trial. Luepschen et al. showed that during a decremental PEEP trial, although respiratory system compliance was still increasing, CoV shifted to the ventral lung regions, coinciding with a decrease in PaO2 [68]. CoVs have been used as a measure of ventilation distribution in both experimental and clinical studies [69][70][71][72][73][74][75][76].

Figure 4. Centre of ventilation (CoV): The CoV examines the right and left halves of the ventilated area separately. Each half was divided into equally spaced horizontal regions of interest (ROI). The sum of the ventilation-related impedance changes for each ROI was calculated and presented as a bar. The results are displayed as two histograms: the right histogram represents the left lung (and vice versa). The location of CoV is indicated by a white horizontal line that divides the ventral and dorsal lung regions with equal impedance changes. Two percentages separated by a comma were specified. These percentages represent the dorsal-to-ventral ventilation distributions. The first percentage represents the left histogram (right lung), and the second is the right histogram (left lung). A percentage higher than 50 represents a shift in the ventilation distribution towards the dorsal regions.
In short, the anterior-to-posterior ventilation ratio (A/P ratio) and centre of ventilation (CoV) are measures used to describe lung ventilation distribution, with CoV being more sensitive to alveolar recruitment and derecruitment during PEEP trials.
3.3. The Global Inhomogeneity Index
The most frequently used measure of ventilation inhomogeneity is the global inhomogeneity index (GI). It provides information on the overall degree of ventilation inhomogeneity without information on how it is distributed in the lungs [77]. Global inhomogeneity was calculated as the sum of the absolute differences between the median value of tidal variation and every pixel value divided by the sum of all impedance values for normalisation. Higher values denote a greater degree of inhomogeneity in the ventilation distribution. Extrapulmonary regions should not be included in the calculation; however, if only the ventilated area is included, areas belonging to the lung that are overdistended or not ventilated due to atelectasis will be missed, leading to erroneous results [78]. Therefore, it is crucial to define the lung area within a tidal image [79][80]. The GI is reliable for inter-individual comparisons [77]. GI has been used for PEEP titration in patients with healthy lungs, and no significant differences were found between the GI method and the best dynamic respiratory system compliance method or between GI and the compliance volume curve method (stress index). The optimal PEEP level for each patient was determined according to the lowest GI index, corresponding to the most homogeneous lung ventilation distribution. GI is superior to dynamic lung mechanics in spontaneously breathing patients, where reliable lung mechanics are difficult to obtain [79][81].
The GI can also be used during spontaneous breathing trials. Patients with diaphragmatic dysfunction have larger increments in the inhomogeneities of lung aeration than those without diaphragmatic dysfunction [82]. GI is highly correlated with lung recruitment; the percentage of recruitable lung regions decreases with a decrease in GI [83]. A high tidal volume may lead to a lower GI index, especially at a low PEEP, probably because of tidal recruitment [84]. After a recruitment manoeuvre in patients with ARDS, the GI did not change in non-responders to recruitment; however, in responders, the GI improved. Thus, GI can help identify responders to recruitment manoeuvres [46].
It should be noted that homogenisation of lung ventilation became synonymous with protective ventilation, assuming that reopened lung units can improve ventilation distribution by accommodating part of the tidal volume, thus minimising hyperinflation. However, in normal lungs with minimal collapse, the heterogeneity of lung ventilation is a physiological phenomenon mirrored by the heterogeneity of lung perfusion [85]. Therefore, the measures of ventilation inhomogeneity should be interpreted with caution. Solely trying to minimise inhomogeneity without limiting the upper level of PEEP may cause severe overdistension and is potentially harmful [86].
The global inhomogeneity index (GI) is a commonly used measure of ventilation inhomogeneity that reflects the degree of inhomogeneity in the overall ventilation distribution. However, caution should be exercised when interpreting these results, as homogenisation of lung ventilation should not be the only goal of protective ventilation.
4. Regional Ventilation Delay
The regional ventilation delay (RVD) is the calculation of the delay between the global start of inspiration and the point in time at which the regional impedance curve reaches a certain impedance change threshold (Figure 5). Thus, RVD is used to identify lung regions with late opening, which could indicate the presence of cyclic opening and closing of the alveoli. Regional ventilation delay calculations have been applied during normal spontaneous breathing and conventional ventilation [87][88][89]. However, this calculation has not been validated for conventional control or support ventilation, where the inspiration time is short. Regional ventilation delay is determined during a low-flow manoeuvre, and the threshold for the inspiratory phase can be modified [18]. Global function tests such as a low-flow manoeuvre can only assess the overlapping information of several ventilatory units of different lung regions that differ in mechanical behaviour. Slow-flow inflation should promote sequential filling of different lung regions caused by alveolar recruitment of regions with different opening pressures. Regional ventilation delays during low-flow manoeuvres are useful in determining regional recruitment [18]. Regional ventilation delay inhomogeneity, therefore, provides a good estimate of the amount of tidal recruitment and may be useful for individualising ventilatory settings, such as PEEP [90][91][92][93]. The greatest drawback of performing a low-flow manoeuvre is that respiratory muscles must be inactive. Therefore, the patient needs to be deeply sedated and preferably paralysed [94][95]. To increase clinical applicability, reducing the volume delivered during a low-flow manoeuvre has been proposed [96]. More recently, there has been a trend of using lower doses of sedatives in intensive care patients to prevent muscle weakness, depression, and post-intensive care syndrome, all of which markedly affect patients’ quality of life after they leave the unit [97], making the usability of a slow-flow manoeuvre less applicable.

Figure 5. Regional Ventilation Delay (RVD). Upper panel: tidal image representing ventilation distribution (grey surrounding line of the ventilated area). The black regions indicate the beginning of inspiration simultaneously compared to the global beginning of inspiration; the yellow regions indicate a delayed and green region at the early beginning of regional inspiration compared to global inspiration. Lower panel: Delay in regional impedance change with a cutoff value of 40% set by the user. The white waveform represents the global start and end of inspiration, and the yellow waveform represents the start and end of inspiration of the pixel.
In short, the regional ventilation delay (RVD) measures the delay between the global start of inspiration and the regional impedance curve reaching a certain impedance change threshold, identifying regions with cyclic opening and closing. However, deep sedation and paralysis are required for low-flow manoeuvres.
References
- Acute Respiratory Distress Syndrome Network. Ventilation with lower tidal volumes as compared with traditional tidal volumes for acute lung injury and the acute respiratory distress syndrome. N. Engl. J. Med. 2000, 342, 1301–1308.
- The ARDS Clinical Trials Network; National Heart, Lung, and Blood Institute, National Institutes of Health. Effects of recruitment maneuvers in patients with acute lung injury and acute respiratory distress syndrome ventilated with high positive end-expiratory pressure. Crit. Care Med. 2003, 31, 2592–2597.
- Meade, M.O.; Cook, D.J.; Guyatt, G.H.; Slutsky, A.S.; Arabi, Y.M.; Cooper, D.J.; Davies, A.R.; Hand, L.E.; Zhou, Q.; Thabane, L.; et al. Ventilation strategy using low tidal volumes, recruitment maneuvers, and high positive end-expiratory pressure for acute lung injury and acute respiratory distress syndrome: A randomized controlled trial. JAMA 2008, 299, 637–645.
- Ranieri, V.I.T.O.; Rubenfeld, G.D.; Thompson, B.T.; Ferguson, N.D.; Caldwell, E.; Fan, E.; Camporota, L. Acute respiratory distress syndrome: The Berlin Definition. JAMA 2012, 307, 2526–2533.
- Ranieri, V.M.; Giuliani, R.; Fiore, T.; Dambrosio, M.; Milic-Emili, J. Volume-pressure curve of the respiratory system predicts effects of PEEP in ARDS: “Occlusion” versus “constant flow” technique. Am. J. Respir. Crit. Care Med. 1994, 149, 19–27.
- Ranieri, V.M.; Zhang, H.; Mascia, L.; Aubin, M.; Lin, C.-Y.; Mullen, J.B.; Grasso, S.; Binnie, M.; Volgyesi, G.A.; Eng, P.; et al. Pressure-time curve predicts minimally injurious ventilatory strategy in an isolated rat lung model. Anesthesiology 2000, 93, 1320–1328.
- Talmor, D.; Sarge, T.; Malhotra, A.; O’Donnell, C.R.; Ritz, R.; Lisbon, A.; Novack, V.; Loring, S.H. Mechanical ventilation guided by esophageal pressure in acute lung injury. N. Engl. J. Med. 2008, 359, 2095–2104.
- Mauri, T.; Yoshida, T.; Bellani, G.; Goligher, E.C.; Carteaux, G.; Rittayamai, N.; Mojoli, F.; Chiumello, D.; Piquilloud, L.; Grasso, S.; et al. Esophageal and transpulmonary pressure in the clinical setting: Meaning, usefulness and perspectives. Intensive Care Med. 2016, 42, 1360–1373.
- Demory, D.; Arnal, J.-M.; Wysocki, M.; Donati, S.; Granier, I.; Corno, G.; Durand-Gasselin, J. Recruitability of the lung estimated by the pressure volume curve hysteresis in ARDS patients. Intensive Care Med. 2008, 34, 2019–2025.
- Hickling, K.G. The pressure-volume curve is greatly modified by recruitment. A mathematical model of ARDS lungs. Am. J. Respir. Crit. Care Med. 1998, 158, 194–202.
- Suarez-Sipmann, F.; Böhm, S.H.; Tusman, G.; Pesch, T.; Thamm, O.; Reissmann, H.; Reske, A.; Magnusson, A.; Hedenstierna, G. Use of dynamic compliance for open lung positive end-expiratory pressure titration in an experimental study. Crit. Care Med. 2007, 35, 214–221.
- Pintado, M.-C.; de Pablo, R.; Trascasa, M.; Milicua, J.-M.; Rogero, S.; Daguerre, M.; Cambronero, J.-A.; Arribas, I.; Sánchez-García, M. Individualized PEEP setting in subjects with ARDS: A randomized controlled pilot study. Respir. Care 2013, 58, 1416–1423.
- The National Heart, Lung, and Blood Institute ARDS Clinical Trials Network. Higher versus lower positive end-expiratory pressures in patients with the acute respiratory distress syndrome. N. Engl. J. Med. 2004, 351, 327–336.
- Rezaiguia-Delclaux, S.; Ren, L.; Gruner, A.; Roman, C.; Genty, T.; Stéphan, F. Oxygenation versus driving pressure for determining the best positive end-expiratory pressure in acute respiratory distress syndrome. Crit. Care 2022, 26, 214.
- Chiumello, D.; Carlesso, E.; Cadringher, P.; Caironi, P.; Valenza, F.; Polli, F.; Tallarini, F.; Cozzi, P.; Cressoni, M.; Colombo, A.; et al. Lung stress and strain during mechanical ventilation for acute respiratory distress syndrome. Am. J. Respir. Crit. Care Med. 2008, 178, 346–355.
- Brown, B.H.; Barber, D.C.; Seagar, A.D. Applied potential tomography: Possible clinical applications. Clin. Phys. Physiol. Meas. 1985, 6, 109–121.
- Costa, E.L.; Borges, J.B.; Melo, A.; Suarez-Sipmann, F.; Toufen, C., Jr.; Bohm, S.H.; Amato, M.B. Bedside estimation of recruitable alveolar collapse and hyperdistension by electrical impedance tomography. Intensive Care Med. 2009, 35, 1132–1137.
- Wrigge, H.; Zinserling, J.; Muders, T.; Varelmann, D.; Günther, U.; von der Groeben, C.; Magnusson, A.; Hedenstierna, G.; Putensen, C. Electrical impedance tomography compared with thoracic computed tomography during a slow inflation maneuver in experimental models of lung injury. Crit. Care Med. 2008, 36, 903–909.
- de Jongh, S.A.M.; Heines, S.J.H.; de Jongh, F.H.C.; Segers, R.P.J.; van der Horst, I.C.C.; van Bussel, B.C.; Bergmans, D.C. Regional peak flow as a novel approach to assess regional pulmonary mechanics by electrical impedance tomography: An observational validation study. Ann. Transl. Med. 2023, 11, 253.
- Gentile, M.A.; Cheifetz, I.M. Optimal positive end-expiratory pressure: The search for the Holy Grail continues. Crit. Care Med. 2004, 32, 2553–2554.
- Markhorst, D.; Kneyber, M.; van Heerde, M. The quest for optimal positive end-expiratory pressure continues. Crit. Care 2008, 12, 408.
- Gattinoni, L.; Carlesso, E.; Cressoni, M. Selecting the ‘right’ positive end-expiratory pressure level. Curr. Opin. Crit. Care 2015, 21, 50–57.
- Dargaville, P.A.; Rimensberger, P.C.; Frerichs, I. Regional tidal ventilation and compliance during a stepwise vital capacity manoeuvre. Intensive Care Med. 2010, 36, 1953–1961.
- Spadaro, S.; Mauri, T.; Böhm, S.H.; Scaramuzzo, G.; Turrini, C.; Waldmann, A.D.; Ragazzi, R.; Pesenti, A.; Volta, C.A. Variation of poorly ventilated lung units (silent spaces) measured by electrical impedance tomography to dynamically assess recruitment. Crit. Care 2018, 22, 26.
- Tas, J.; van Gassel, R.J.J.; Heines, S.J.H.; Mulder, M.M.G.; Heijnen, N.F.L.; Acampo-de Jong, M.J.; Bels, J.L.M.; Bennis, F.C.; Koelmann, M.; Groven, R.V.M.; et al. Serial measurements in COVID-19-induced acute respiratory disease to unravel heterogeneity of the disease course: Design of the Maastricht Intensive Care COVID cohort (MaastrICCht). BMJ Open 2020, 10, e040175.
- Bikker, I.G.; Preis, C.; Egal, M.; Bakker, J.; Gommers, D. Electrical impedance tomography measured at two thoracic levels can visualize the ventilation distribution changes at the bedside during a decremental positive end-expiratory lung pressure trial. Crit. Care 2011, 15, R193.
- Heines, S.J.H.; Strauch, U.; van de Poll, M.C.G.; Roekaerts, P.M.H.J.; Bergmans, D.C.J.J. Clinical implementation of electric impedance tomography in the treatment of ARDS: A single centre experience. J. Clin. Monit. Comput. 2019, 33, 291–300.
- Heines, S.J.H.; van Bussel, B.C.T.; Jong, M.J.A.-D.; Bennis, F.C.; van Gassel, R.J.J.; Groven, R.V.M.; Heijnen, N.F.L.; Hermans, B.J.M.; Hounjet, R.; van Koll, J.; et al. Pulmonary pathophysiology development of COVID-19 assessed by serial Electrical Impedance Tomography in the MaastrICCht cohort. Sci. Rep. 2022, 12, 14517.
- Franchineau, G.; Bréchot, N.; Lebreton, G.; Hekimian, G.; Nieszkowska, A.; Trouillet, J.-L.; Leprince, P.; Chastre, J.; Luyt, C.-E.; Combes, A.; et al. Bedside Contribution of Electrical Impedance Tomography to Setting Positive End-Expiratory Pressure for Extracorporeal Membrane Oxygenation-treated Patients with Severe Acute Respiratory Distress Syndrome. Am. J. Respir. Crit. Care Med. 2017, 196, 447–457.
- Soulé, C.; Crognier, L.; Puel, F.; Ruiz, S.; Seguin, T.; Fourcade, O.; Georges, B.; Conil, J.-M.; Minville, V.; Vardon-Bounes, F. Assessment of Electrical Impedance Tomography to Set Optimal Positive End-Expiratory Pressure for Venoarterial Extracorporeal Membrane Oxygenation-Treated Patients. Crit. Care Med. 2021, 49, 923–933.
- Puel, F.; Crognier, L.; Soulé, C.; Vardon-Bounes, F.; Ruiz, S.; Seguin, T.; Fourcade, O.; Minville, V.; Conil, J.-M.; Georges, B. Assessment of electrical impedance tomography to set optimal positive end-expiratory pressure for veno-venous ECMO-treated severe ARDS patients. J. Crit. Care 2020, 60, 38–44.
- Ferrando, C.; Mugarra, A.; Gutierrez, A.; Carbonell, J.A.; García, M.; Soro, M.; Tusman, G.; Belda, F.J. Setting individualized positive end-expiratory pressure level with a positive end-expiratory pressure decrement trial after a recruitment maneuver improves oxygenation and lung mechanics during one-lung ventilation. Anesth. Analg. 2014, 118, 657–665.
- Karsten, J.; Grusnick, C.; Paarmann, H.; Heringlake, M.; Heinze, H. Positive end-expiratory pressure titration at bedside using electrical impedance tomography in post-operative cardiac surgery patients. Acta Anaesthesiol. Scand. 2015, 59, 723–732.
- Pereira, S.M.; Tucci, M.R.; Morais, C.C.A.; Simões, C.M.; Tonelotto, B.F.F.; Pompeo, M.S.; Kay, F.U.; Pelosi, P.; Vieira, J.E.; Amato, M.B.P. Individual Positive End-expiratory Pressure Settings Optimize Intraoperative Mechanical Ventilation and Reduce Postoperative Atelectasis. Anesthesiology 2018, 129, 1070–1081.
- Liu, K.; Huang, C.; Xu, M.; Wu, J.; Frerichs, I.; Moeller, K.; Zhao, Z. PEEP guided by electrical impedance tomography during one-lung ventilation in elderly patients undergoing thoracoscopic surgery. Ann. Transl. Med. 2019, 7, 757.
- He, H.; Chi, Y.; Yang, Y.; Yuan, S.; Long, Y.; Zhao, P.; Frerichs, I.; Fu, F.; Möller, K.; Zhao, Z. Early individualized positive end-expiratory pressure guided by electrical impedance tomography in acute respiratory distress syndrome: A randomized controlled clinical trial. Crit. Care 2021, 25, 230.
- Somhorst, P.; van der Zee, P.; Endeman, H.; Gommers, D. PEEP-FiO2 table versus EIT to titrate PEEP in mechanically ventilated patients with COVID-19-related ARDS. Crit. Care 2022, 26, 272.
- Hsu, H.-J.; Chang, H.-T.; Zhao, Z.; Wang, P.-H.; Zhang, J.-H.; Chen, Y.-S.; Frerichs, I.; Moeller, K.; Fu, F.; Hsu, H.-S.; et al. Positive end-expiratory pressure titration with electrical impedance tomography and pressure-volume curve: A randomized trial in moderate to severe ARDS. Physiol. Meas. 2021, 42, 014002.
- Erlandsson, K.; Odenstedt, H.; Lundin, S.; Stenqvist, O. Positive end-expiratory pressure optimization using electric impedance tomography in morbidly obese patients during laparoscopic gastric bypass surgery. Acta Anaesthesiol. Scand. 2006, 50, 833–839.
- Karsten, J.; Stueber, T.; Voigt, N.; Teschner, E.; Heinze, H. Influence of different electrode belt positions on electrical impedance tomography imaging of regional ventilation: A prospective observational study. Crit. Care 2016, 20, 3.
- Frerichs, I.; Hinz, J.; Herrmann, P.; Weisser, G.; Hahn, G.; Dudykevych, T.; Quintel, M.; Hellige, G. Detection of local lung air content by electrical impedance tomography compared with electron beam CT. J. Appl. Physiol. 2002, 93, 660–666.
- Mauri, T.; Eronia, N.; Turrini, C.; Battistini, M.; Grasselli, G.; Rona, R.; Volta, C.A.; Bellani, G.; Pesenti, A. Bedside assessment of the effects of positive end-expiratory pressure on lung inflation and recruitment by the helium dilution technique and electrical impedance tomography. Intensive Care Med. 2016, 42, 1576–1587.
- Hinz, J.; Hahn, G.; Neumann, P.; Sydow, M.; Mohrenweiser, P.; Hellige, G.; Burchardi, H. End-expiratory lung impedance change enables bedside monitoring of end-expiratory lung volume change. Intensive Care Med. 2003, 29, 37–43.
- Bikker, I.G.; Leonhardt, S.; Bakker, J.; Gommers, D. Lung volume calculated from electrical impedance tomography in ICU patients at different PEEP levels. Intensive Care Med. 2009, 35, 1362–1367.
- Eronia, N.; Mauri, T.; Maffezzini, E.; Gatti, S.; Bronco, A.; Alban, L.; Binda, F.; Sasso, T.; Marenghi, C.; Grasselli, G.; et al. Bedside selection of positive end-expiratory pressure by electrical impedance tomography in hypoxemic patients: A feasibility study. Ann. Intensive Care 2017, 7, 76.
- Long, Y.; Liu, D.-W.; He, H.-W.; Zhao, Z.-Q. Positive End-expiratory Pressure Titration after Alveolar Recruitment Directed by Electrical Impedance Tomography. Chin. Med. J. 2015, 128, 1421–1427.
- Frerichs, I.; Pulletz, S.; Elke, G.; Gawelczyk, B.; Frerichs, A.; Weiler, N. Patient examinations using electrical impedance tomography—Sources of interference in the intensive care unit. Physiol Meas. 2011, 32, L1–L10.
- Vogt, B.; Mendes, L.; Chouvarda, I.; Perantoni, E.; Kaimakamis, E.; Becher, T.; Weiler, N.; Tsara, V.; Paiva, R.P.; Maglaveras, N.; et al. Influence of torso and arm positions on chest examinations by electrical impedance tomography. Physiol. Meas. 2016, 37, 904–921.
- Sobota, V.; Müller, M.; Roubík, K. Intravenous administration of normal saline may be misinterpreted as a change of end-expiratory lung volume when using electrical impedance tomography. Sci. Rep. 2019, 9, 5775.
- Becher, T.; Wendler, A.; Eimer, C.; Weiler, N.; Frerichs, I. Changes in Electrical Impedance Tomography Findings of ICU Patients during Rapid Infusion of a Fluid Bolus: A Prospective Observational Study. Am. J. Respir. Crit. Care Med. 2019, 199, 1572–1575.
- Zhao, Z.; Lee, L.-C.; Chang, M.-Y.; Frerichs, I.; Chang, H.-T.; Gow, C.-H.; Hsu, Y.-L.; Möller, K. The incidence and interpretation of large differences in EIT-based measures for PEEP titration in ARDS patients. J. Clin. Monit. Comput. 2020, 34, 1005–1013.
- Ling, S.; Zhao, Z. End-Expiratory Lung Impedance Measured with Electrical Impedance Tomography at Different Days Are Not Comparable. Crit. Care Med. 2023, 51, e70–e72.
- Carteaux, G.; Parfait, M.; Combet, M.; Haudebourg, A.-F.; Tuffet, S.; Dessap, A.M. Patient-Self Inflicted Lung Injury: A Practical Review. J. Clin. Med. 2021, 10, 2738.
- Morais, C.C.A.; Koyama, Y.; Yoshida, T.; Plens, G.M.; Gomes, S.; Lima, C.A.S.; Ramos, O.P.S.; Pereira, S.M.; Kawaguchi, N.; Yamamoto, H.; et al. High Positive End-Expiratory Pressure Renders Spontaneous Effort Noninjurious. Am. J. Respir. Crit. Care Med. 2018, 197, 1285–1296.
- Del Sorbo, L.; Tonetti, T.; Ranieri, V.M. Alveolar recruitment in acute respiratory distress syndrome: Should we open the lung (no matter what) or may accept (part of) the lung closed? Intensive Care Med. 2019, 45, 1436–1439.
- Yoshida, T.; Grieco, D.L.; Brochard, L.; Fujino, Y. Patient self-inflicted lung injury and positive end-expiratory pressure for safe spontaneous breathing. Curr. Opin. Crit. Care 2020, 26, 59–65.
- Tomicic, V.; Cornejo, R. Lung monitoring with electrical impedance tomography: Technical considerations and clinical applications. J. Thorac. Dis. 2019, 11, 3122–3135.
- Becher, T.; Schädler, D.; Rostalski, P.; Zick, G.; Frerichs, I.; Weiler, N. Determination of respiratory system compliance during pressure support ventilation by small variations of pressure support. J. Clin. Monit. Comput. 2018, 32, 741–751.
- Rossi, F.d.S.; Yagui, A.C.Z.; Haddad, L.B.; Deutsch, A.D.; Rebello, C.M. Electrical impedance tomography to evaluate air distribution prior to extubation in very-low-birth-weight infants: A feasibility study. Clinics 2013, 68, 345–350.
- Schramel, J.; Nagel, C.; Auer, U.; Palm, F.; Aurich, C.; Moens, Y. Distribution of ventilation in pregnant Shetland ponies measured by Electrical Impedance Tomography. Respir. Physiol. Neurobiol. 2012, 180, 258–262.
- Kunst, P.W.A.; de Anda, G.V.; Böhm, S.H.; Faes, T.J.C.; Lachmann, B.; Postmus, P.E.; de Vries, P.M.J.M. Monitoring of recruitment and derecruitment by electrical impedance tomography in a model of acute lung injury. Crit. Care Med. 2000, 28, 3891–3895.
- Kunst, P.W.; de Vries, P.M.; Postmus, P.E.; Bakker, J. Evaluation of electrical impedance tomography in the measurement of PEEP-induced changes in lung volume. Chest 1999, 115, 1102–1106.
- Mauri, T.; Bellani, G.; Confalonieri, A.; Tagliabue, P.; Turella, M.; Coppadoro, A.; Citerio, G.; Pesenti, A. Topographic distribution of tidal ventilation in acute respiratory distress syndrome: Effects of positive end-expiratory pressure and pressure support. Crit. Care Med. 2013, 41, 1664–1673.
- Cinnella, G.; Grasso, S.; Raimondo, P.; D’Antini, D.; Mirabella, L.; Rauseo, M.; Dambrosio, M. Physiological Effects of the Open Lung Approach in Patients with Early, Mild, Diffuse Acute Respiratory Distress Syndrome: An Electrical Impedance Tomography Study. Anesthesiology 2015, 123, 1113–1121.
- Frerichs, I.; Amato, M.B.P.; van Kaam, A.H.; Tingay, D.G.; Zhao, Z.; Grychtol, B.; Bodenstein, M.; Gagnon, H.; Böhm, S.H.; Teschner, E.; et al. Chest electrical impedance tomography examination, data analysis, terminology, clinical use and recommendations: Consensus statement of the TRanslational EIT developmeNt stuDy group. Thorax 2017, 72, 83–93.
- Frerichs, I.; Hahn, G.; Golisch, W.; Kurpitz, M.; Burchardi, H.; Hellige, G. Monitoring perioperative changes in distribution of pulmonary ventilation by functional electrical impedance tomography. Acta Anaesthesiol. Scand. 1998, 42, 721–726.
- Radke, O.C.; Schneider, T.; Heller, A.R.; Koch, T. Spontaneous breathing during general anesthesia prevents the ventral redistribution of ventilation as detected by electrical impedance tomography: A randomized trial. Anesthesiology 2012, 116, 1227–1234.
- Luepschen, H.; Meier, T.; Grossherr, M.; Leibecke, T.; Karsten, J.; Leonhardt, S. Protective ventilation using electrical impedance tomography. Physiol. Meas. 2007, 28, S247–S260.
- Frerichs, I.; Dargaville, P.A.; van Genderingen, H.; Morel, D.R.; Rimensberger, P.C. Lung volume recruitment after surfactant administration modifies spatial distribution of ventilation. Am. J. Respir. Crit. Care Med. 2006, 174, 772–779.
- Schibler, A.; Yuill, M.; Parsley, C.; Pham, T.; Gilshenan, K.; Dakin, C. Regional Ventilation Distribution in Non-Sedated Spontaneously Breathing Newborns and Adults Is Not Different. Pediatr. Pulmonol. 2009, 44, 851–858.
- Miedema, M.; de Jongh, F.H.; Frerichs, I.; van Veenendaal, M.B.; van Kaam, A.H. Changes in Lung Volume and Ventilation during Surfactant Treatment in Ventilated Preterm Infants. Am. J. Respir. Crit. Care Med. 2011, 184, 100–105.
- Karsten, J.; Luepschen, H.; Grossherr, M.; Bruch, H.-P.; Leonhardt, S.; Gehring, H.; Meier, T. Effect of PEEP on regional ventilation during laparoscopic surgery monitored by electrical impedance tomography. Acta Anaesthesiol. Scand. 2011, 55, 878–886.
- Blankman, P.; Hasan, D.; Erik, G.J.; Gommers, D. Detection of ‘best’ positive end-expiratory pressure derived from electrical impedance tomography parameters during a decremental positive end-expiratory pressure trial. Crit. Care 2014, 18, R95.
- Tingay, D.G.; Wallace, M.J.; Bhatia, R.; Schmölzer, G.M.; Zahra, V.A.; Dolan, M.J.; Hooper, S.B.; Davis, P.G. Surfactant before the first inflation at birth improves spatial distribution of ventilation and reduces lung injury in preterm lambs. J. Appl. Physiol. 2014, 116, 251–258.
- Pham, T.M.T.; Yuill, M.; Dakin, C.; Schibler, A. Regional ventilation distribution in the first 6 months of life. Eur. Respir. J. 2011, 37, 919–924.
- Rooney, D.; Friese, M.; Fraser, J.F.; Dunster, K.R.; Schibler, A. Gravity-dependent ventilation distribution in rats measured with electrical impedance tomography. Physiol. Meas. 2009, 30, 1075–1085.
- Zhao, Z.; Möller, K.; Steinmann, D.; Frerichs, I.; Guttmann, J. Evaluation of an electrical impedance tomography-based Global Inhomogeneity Index for pulmonary ventilation distribution. Intensive Care Med. 2009, 35, 1900–1906.
- Becher, T.; Vogt, B.; Kott, M.; Schädler, D.; Weiler, N.; Frerichs, I. Functional Regions of Interest in Electrical Impedance Tomography: A Secondary Analysis of Two Clinical Studies. PLoS ONE 2016, 11, e0152267.
- Zhao, Z.; Steinmann, D.; Frerichs, I.; Guttmann, J.; Möller, K. PEEP titration guided by ventilation homogeneity: A feasibility study using electrical impedance tomography. Crit. Care 2010, 14, R8.
- Yang, L.; Dai, M.; Möller, K.; Frerichs, I.; Adler, A.; Fu, F.; Zhao, Z. Lung regions identified with CT improve the value of global inhomogeneity index measured with electrical impedance tomography. Quant. Imaging Med. Surg. 2021, 11, 1209–1219.
- Hochhausen, N.; Kapell, T.; Dürbaum, M.; Follmann, A.; Rossaint, R.; Czaplik, M. Monitoring postoperative lung recovery using electrical impedance tomography in post anesthesia care unit: An observational study. J. Clin. Monit. Comput. 2022, 36, 1205–1212.
- Moon, D.S.; Huh, J.W.; Hong, S.-B.; Koh, Y.; Lim, C.-M. Dynamic inhomogeneity of aeration along the vertical axis of the lung may predict weaning failure regardless of diaphragm dysfunction. J. Crit. Care 2021, 65, 186–191.
- Zhao, Z.; Pulletz, S.; Frerichs, I.; Müller-Lisse, U.; Möller, K. The EIT-based global inhomogeneity index is highly correlated with regional lung opening in patients with acute respiratory distress syndrome. BMC Res. Notes 2014, 7, 82.
- Becher, T.; Kott, M.; Schädler, D.; Vogt, B.; Meinel, T.; Weiler, N.; Frerichs, I. Influence of tidal volume on ventilation inhomogeneity assessed by electrical impedance tomography during controlled mechanical ventilation. Physiol. Meas. 2015, 36, 1137–1146.
- Costa, E.L.V.; Amato, M.B.P. Can heterogeneity in ventilation be good? Crit. Care 2010, 14, 134.
- Heines, S.J.H.; de Jongh, S.A.M.; Strauch, U.; van der Horst, I.C.C.; van de Poll, M.C.G.; Bergmans, D.C. The global inhomogeneity index assessed by electrical impedance tomography overestimates PEEP requirement in patients with ARDS: An observational study. BMC Anesthesiol. 2022, 22, 258.
- Lumb, A.B.; Savic, L.; Horsford, M.R.; Hodgson, S.R. Effects of tracheal intubation and tracheal tube position on regional lung ventilation: An observational study. Anaesthesia 2020, 75, 359–365.
- Bickenbach, J.; Czaplik, M.; Polier, M.; Marx, G.; Marx, N.; Dreher, M. Electrical impedance tomography for predicting failure of spontaneous breathing trials in patients with prolonged weaning. Crit. Care 2017, 21, 177.
- Hochhausen, N.; Orschulik, J.; Follmann, A.; Santos, S.A.; Dohmeier, H.; Leonhardt, S.; Rossaint, R.; Czaplik, M. Comparison of two experimental ARDS models in pigs using electrical impedance tomography. PLoS ONE 2019, 14, e0225218.
- Muders, T.; Luepschen, H.M.; Zinserling, J.M.; Greschus, S.; Fimmers, R.M.; Guenther, U.; Buchwald, M.; Grigutsch, D.; Leonhardt, S.; Putensen, C.; et al. Tidal recruitment assessed by electrical impedance tomography and computed tomography in a porcine model of lung injury. Crit. Care Med. 2012, 40, 903–911.
- Haase, J.; Buchloh, D.C.; Hammermüller, S.; Salz, P.; Mrongowius, J.; Carvalho, N.C.; Beda, A.; Rau, A.; Starke, H.; Spieth, P.M.; et al. Mechanical Ventilation Strategies Targeting Different Magnitudes of Collapse and Tidal Recruitment in Porcine Acid Aspiration-Induced Lung Injury. J. Clin. Med. 2019, 8, 1250.
- Nestler, C.; Simon, P.; Petroff, D.; Hammermüller, S.; Kamrath, D.; Wolf, S.; Dietrich, A.; Camilo, L.M.; Beda, A.; Carvalho, A.R.; et al. Individualized positive end-expiratory pressure in obese patients during general anaesthesia: A randomized controlled clinical trial using electrical impedance tomography. Br. J. Anaesth. 2017, 119, 1194–1205.
- Girrbach, F.; Zeutzschel, F.; Schulz, S.; Lange, M.; Beda, A.; Giannella-Neto, A.; Wrigge, H.; Simon, P. Methods for Determination of Individual PEEP for Intraoperative Mechanical Ventilation Using a Decremental PEEP Trial. J. Clin. Med. 2022, 11, 3707.
- Decailliot, F.; Demoule, A.; Maggiore, S.M.; Jonson, B.; Duvaldestin, P.; Brochard, L. Pressure-volume curves with and without muscle paralysis in acute respiratory distress syndrome. Intensive Care Med. 2006, 32, 1322–1328.
- Lu, Q.; Rouby, J.-J. Measurement of pressure-volume curves in patients on mechanical ventilation: Methods and significance. Crit. Care 2000, 4, 91–100.
- Muders, T.; Hentze, B.; Simon, P.; Girrbach, F.; Doebler, M.R.; Leonhardt, S.; Wrigge, H.; Putensen, C. A Modified Method to Assess Tidal Recruitment by Electrical Impedance Tomography. J. Clin. Med. 2019, 8, 1161.
- Barr, J.; Fraser, G.L.; Puntillo, K.; Ely, E.W.; Gélinas, C.; Dasta, J.F.; Davidson, J.E.; Devlin, J.W.; Kress, J.P.; Joffe, A.M.; et al. Clinical practice guidelines for the management of pain, agitation, and delirium in adult patients in the intensive care unit. Crit. Care Med. 2013, 41, 263–306.
More
Information
Subjects:
Critical Care Medicine
Contributors
MDPI registered users' name will be linked to their SciProfiles pages. To register with us, please refer to https://encyclopedia.pub/register
:
View Times:
1.3K
Revisions:
2 times
(View History)
Update Date:
27 Oct 2023
Table of Contents


Notice
You are not a member of the advisory board for this topic. If you want to update advisory board member profile, please contact office@encyclopedia.pub.
OK
Confirm
Only members of the Encyclopedia advisory board for this topic are allowed to note entries. Would you like to become an advisory board member of the Encyclopedia?
Yes
No
${ textCharacter }/${ maxCharacter }
Submit
Cancel
Back
Comments
${ item }
|
${ item.createdUser.fullName }
${ item.createdAt }
${ item.vote }
${ item.reply }
Delete
${ reply.createdUser.fullName }
${ reply.createdAt }
${ reply.vote }
Delete
There is no reply to this comment~
${ item.replyTextCharacter }/${ item.replyMaxCharacter }
Submit
Cancel
More
No more~
There is no comment~
${ textCharacter }/${ maxCharacter }
Submit
Cancel
${ selectedItem.replyTextCharacter }/${ selectedItem.replyMaxCharacter }
Submit
Cancel
Confirm
Are you sure to Delete?
Yes
No