 +1 credit
| Version | Summary | Created by | Modification | Content Size | Created at | Operation |
|---|---|---|---|---|---|---|
| 1 | Francesco Mura | -- | 4262 | 2023-10-25 15:48:15 | | | |
| 2 | Lindsay Dong | + 5 word(s) | 4267 | 2023-10-26 03:42:16 | | | | |
| 3 | Lindsay Dong | + 1 word(s) | 4268 | 2023-10-26 03:46:26 | | | | |
| 4 | Lindsay Dong | + 10 word(s) | 4278 | 2023-10-26 03:47:46 | | |
Video Upload Options
Focused ion beam (FIB)-scanning electron microscopy (SEM) tomography is an extremely important and reliable technique for the three-dimensional reconstruction of microscopic structures with nanometric resolution, with great potential to be integrated with other analytical techniques. FIB-SEM tomography plays a crucial role in the development of innovative multiscale and multimodal correlative microscopy workflows because it can be seamlessly integrated with other imaging modalities, as the reconstruction range bridges the gap between the non-destructive X-ray families of tomographic techniques, which provide sub-micron resolution, and the nano- to atomic-scale resolution achieved by transmission electron microscopy (TEM) tomography.
1. Introduction
2. FIB-SEM TOMOGRAPHY: System and Data Analysis
Dual Beam Systems
Fig. 1 shows the dual beam FIB-SEM configuration, where the raster of the electron beam is coincident with the one of the ion beams. The electromagnetic column controlling the electron gun is vertically oriented, as in a conventional SEM, while the ion beam is tilted at an angle with respect to the electron beam. A modern 6-axis motorized stage allows rapid positioning and tilting of the sample, maintaining the visibility of the region of interest (ROI) for both beams.
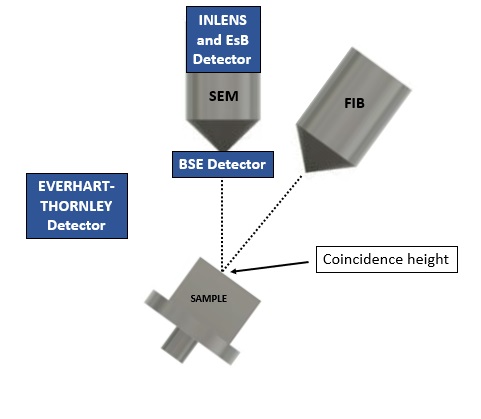
Figure 1. Schematic configuration of sample, columns, and detectors inside the dual beam FIB-SEM system, with the specimen region of interest (ROI) at the coincidence height, where both the electron and ion beam converge at the same position on the sample surface and at a specific tilt angle. The position of the different detectors inside the instrument is also shown, with the Everhart-Thornley and BSE detectors positioned laterally in the sample chamber and just above the end of the electron column, respectively [8].
By tilting the stage by about 50° degree, depending on the specific system geometry, the ion beam impinges perpendicularly and kinematically removes material from the sample surface after a nucleus-nucleus interaction between the accelerated ions and the target material of the sample [9]. This erosion progress from the surface and exposes a vertical section of the internal structure, which is readily observable with the electron beam. One of the main issues of slice-and-view reconstruction is the non-isotropy in the tomogram resolution: the resolution in the milling direction (conventionally referred to as the z- axis) is limited by the ability of the FIB to produce parallel and planar sections through the specimen, while in the x-y image plane, the resolution is determined by the physical size of the image pixel and ultimately limited by the diameter of the SEM probe. Resolution along the z-axis is inferior due to a combination of limiting factors : the width and intensity profile of the focused ion beam widens as the beam current increases, and source instability and beam drift over the inevitably long acquisition time [6]. The technological improvement of the latest systems and the introduction of drift correction and feedback of the ion emission, guarantee complete automation of the whole process and stability over the required time [10][11].
Experimental Setup
For a successful 3D reconstruction of a ROI, a preliminary preparation of the specimen is necessary: the thermal and electrical conductivity of the sample is beneficial to minimize specimen drift and electrical charging, but at the same time, especially if the study in question involves the analysis of internal porosity or heterogenous materials, we must prevent the FIB milling from creating image artefacts. To improve electrical conductivity, the top surface of the sample can be sputtered with carbon, gold, Cr, or a conductive path can be created between the sample and the sample-holder using a double-sided carbon or copper tape suitable for electron microscopy. In addition, it is possible to produce a thick, localised deposition of either Pt, C, or W over the region of interest using the Induced Ion Beam Deposition (IBID) [12]. In addition, to protect the internal porosity of a sample, the specimen can be infiltrated with a resin [13][14], which also provides a better planar section and a good contrast for the pore phase in the image processing. This method proved to be very useful for this class of samples and its use in the analysis of porous materials has now become routine.
The choice of the probe current and the dwell time for the serial sectioning depends on several factors: the area of the exposed section, the milling rate for the target material under investigation, and the instrumental properties of the FIB system [15][16]. Intense currents produce deep and smooth sections in a short time, but they also have limited accuracy due to their larger diameter and the intensity profile of the ion probe. In addition, material redeposition is so high that it can hide small features of interest [17]. Instead, low-current beams achieve a finer focusing for their small probe, but can produce artefacts due to incomplete cutting. A detailed review of all the FIB parameters is well described in the work of Kim et al. [18].
SEM Imaging
The interaction between the electron beam and the target sample produces the two fundamental signals used in SEM imaging: secondary (SE) and backscattered (BSE) electrons. SE feature a continuous energy spectrum in the 0-100 eV range [19], representing weakly bound valence electrons, or, for the metals, conduction band electrons with binding energy of 1-15 eV [20]. BSE are essentially electrons of the primary beam that are deflected at a very high angle and with low energy loss by elastic scattering with the nuclei of the target material [21]. This energy difference allows the two types of electrons to be collected separately, and then analyzed for the different information they provide. The BSE signal is highly dependent on the atomic number, giving rise to the so-called the "Z-contrast". Instead, SE has a more localized signal, although its escape depth strongly depends on the physical characteristics of the sample [22]. Besides, SE imaging is also influenced by the type of detector used. The Everhart-Thornley detector collects both SE and BSE electrons, but the position of the detector, which is off-axis respect to the primary beam, favours sensitivity to sample morphology. On the other hand, the SE detector integrated into the SEM columns (commonly referred as In-lens detector) is effective for operation at short specimen-column distances and low beam energies [20].
In the FIB tomography, two parameters need to be optimised during the SEM acquisition: the acceleration voltage of the primary beam and the contrast of the features of interest in the [23]exposed section of the sample. The first term controls the depth and the radius of the interaction volume, from which the secondary and backscattered electrons are generated. Generally, the higher is the beam energy, the larger the interaction volume, although, as mentioned above, if there also an influence from the chemical elements of the target material and its density [24]. For this reason, the use of a beam energy of 3-5 keV is recommended, resulting in an interaction depth comparable to the thickness of a single slice of the tomography.
Data Processing
The first step in data processing is the alignment of the collected SEM images. This is a very delicate part of the process as it affects the following segmentation, and subpixel accuracy is required [25]. Some algorithms, such as the StackReg [26] or TurboReg [27] plugins for ImageJ, provide a stable and fast procedure.
The next step is to remove any artefacts from the image, where one of the typical image artefacts produced by FIB milling is the "curtaining effect", where the surface of the cross-section appears to be covered by some vertical stripes. These artefacts are due to material inhomogeneities, underestimation of the ion beam exposure dose or variations in crystal orientation [28]. Artefact removal is performed by applying a Fast Fourier Transform (FFT), adopting the vertical rectangular area as a zero filter mask centred on the vertical axis of symmetry [29].
Besides, as mentioned above, the mismatch between the electron and ion column generates a compression in the pixel length of the y-direction of the collected image. This value must be corrected using the following formula:
where yr is the corrected value, yh is the measured y-value, while θ is the tilt angle of the sample-holder [30]. Other artefacts can be derived from a local charging, due to non-planar surfaces and pore edges producing extremely bright areas [20]. To improve the ability to localize and distinguish the features of interest during the segmentation process, contrast and brightness need to be adjusted directly on the single image. Filters like the Gaussian 3D filter or background equalization, such as the "GradientXTerminator", are commonly used to reduce noise [31][32], while a Sigma filter is quite effective in eliminating residual high frequency noise [33][34].
After the alignment process and the removal of artefacts, the following step is the segmentation, which Terao et al. [35] divide into three categories: manual, automatic and semi-automatic processing. The first could achieve highly accurate results, but it is also operator-dependent and time-consuming, as the user has to inspect and process all the images. Instead, automatic processing separates different features of interest in a single image by adopting a global/local thresholding method to the grayscale of the image. One example is the watershed algorithm, which is largely used in a variety of medical segmentation tasks [36].
3. FIB-SEM TOMOGRAPHY: Applications
Fuel Cells
2.2. Batteries
Solar Cells
| First Author (Reference) | Material | Voxel Resolution or Dimensions of the Reconstructed Volume | Associated Techniques | Features of the Rock |
|---|---|---|---|---|
| Wollschläger[61] | Porous TiO2 layers infiltrated with ruthenium molecular sensitizer for DSSC | 2.9 nm × 3.7 nm × 30 nm | AFM, TEM, transmission Kikuchi diffraction (TKD) | Particle size and shape, porosity, active surface area |
| Suter[62] | A: 650 nm thick hematite (α-Fe2O3) photoelectrode; B: 7570 nm thick lanthanum titanium oxynitride (LaTiO2N) | Sample A: 1 µm × 5 µm × 24 µm; Sample B: 8 µm × 8 µm × 31 µm | - | Solid phase material distribution, particle/pore size distribution, surface area |
Ceramics
Metal, Steel, and Alloys
Geology
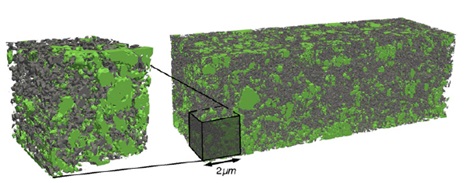
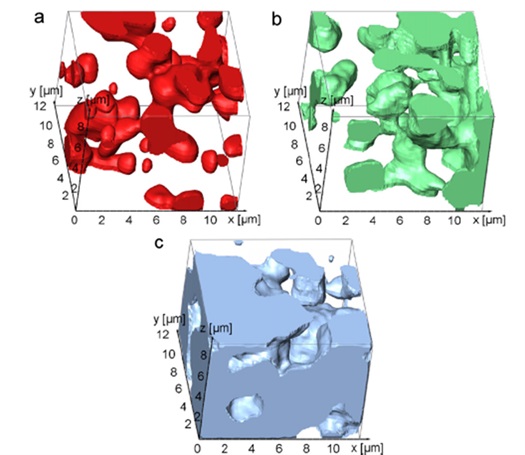
Since the work of Sondergeld in 2010 [81], where FIB-SEM tomography was performed as a technique to study the porosity of shale rock, this type of analysis has become quite common in this field of research. A precise and detailed knowledge of the real porosity of a shale rock becomes important data with which to extract information about the mechanisms that regulate the enrichment or accumulation of the gas inside the rock. Often supported by other investigation methodologies, directly (BET or mercury porosimetry) or indirectly (TEM tomography or X-ray micro-CT), the 3D FIB reconstruction has become increasingly important over the last five years, even reaching a voxel size of a few cubic nanometers. In addition, the growing interest in so-called correlative microscopy has led to the creation of workflows that bridge the gap between the nanometer scale and macroscopic observation, integrating different analysis techniques in a single result. An example can be found in the work of Ma [82], where a multiscale approach, integrating different methodologies, has been proposed (Figure 6).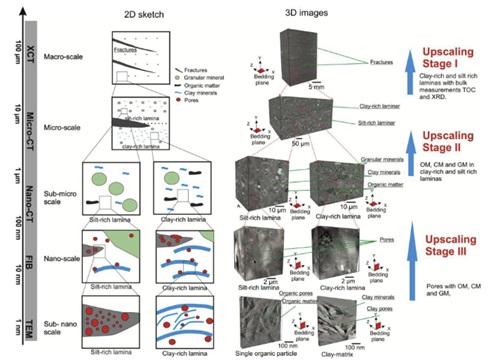
Materials for Nuclear Energy
2.8. Fibers and Polymers
References
- Angus I. Kirkland; Shery L. -Y. Chang; John L. Hutchison. Atomic Resolution Transmission Electron Microscopy; Springer Science and Business Media LLC: Dordrecht, GX, Netherlands, 2008; pp. 3-64.
- Peter Ercius; Osama Alaidi; Matthew J. Rames; Gang Ren; Electron Tomography: A Three‐Dimensional Analytic Tool for Hard and Soft Materials Research. Adv. Mater. 2015, 27, 5638-5663.
- Ahmad P. Tafti; Andrew B. Kirkpatrick; Zahrasadat Alavi; Heather A. Owen; Zeyun Yu; Recent advances in 3D SEM surface reconstruction. Micron 2015, 78, 54-66.
- M Ferroni; A Signoroni; A Sanzogni; G Sberveglieri; A Migliori; L Ortolani; M Christian; L Masini; V Morandi; STEM electron tomography in the Scanning Electron Microscope. null 2015, 644, 012012.
- Matteo Ferroni; Alberto Signoroni; Andrea Sanzogni; Luca Masini; Andrea Migliori; Luca Ortolani; Alessandro Pezza; Vittorio Morandi; Biological application of Compressed Sensing Tomography in the Scanning Electron Microscope. Sci. Rep. 2016, 6, 33354.
- Cantoni, M.; Holzer, L.. Review of FIB tomography; Oxford University Press: New York, Usa, 2012; pp. pp. 410-435.
- Jon Orloff; Mark Utlaut; Lynwood Swanson. Physics of Liquid Metal Ion Sources; Springer Science and Business Media LLC: Dordrecht, GX, Netherlands, 2003; pp. 21-77.
- Francesco Mura; Flavio Cognigni; Matteo Ferroni; Vittorio Morandi; Marco Rossi; Advances in Focused Ion Beam Tomography for Three-Dimensional Characterization in Materials Science. Mater. 2023, 16, 5808.
- Giannuzzi, L.; Prenitzer, B.; Kempshall, B. . Ion—Solid Interactions.; Giannuzzi L.A., Stevie F.A., Eds.; Springer: New York, NY, USA, 2005; pp. pp. 13-52.
- Atlas Zeiss . Atlas Zeiss. Retrieved 2023-10-25
- Thermofisher Autoslice & View . Thermofisher Autoslice & View. Retrieved 2023-10-25
- Hyoung Ho (Chris) Kang; Clive Chandler; Matthew Weschler. Gas assisted ion beam etching and deposition; Cambridge University Press (CUP): Cambridge, United Kingdom, 2007; pp. 67-86.
- Bernd Rüger; Jochen Joos; Thomas Carraro; André Weber; Ellen Ivers-Tiffée; 3D Electrode Microstructure Reconstruction and Modelling. ECS Meet. Abstr. 2009, MA2009-02, 1586-1586.
- Jochen Joos; Thomas Carraro; André Weber; Ellen Ivers-Tiffée; Reconstruction of porous electrodes by FIB/SEM for detailed microstructure modeling. J. Power Sources 2011, 196, 7302-7307.
- Mohammad Yeakub Ali; Wayne Hung; Fu Yongqi; A review of focused ion beam sputtering. Int. J. Precis. Eng. Manuf. 2010, 11, 157-170.
- Joos, J.. Microstructural Characterisation, Modelling and Simulation of Solid Oxide Fuel Cell Cathodes; KIT Scientific Publishing: Karlsruhe, Germany, 2017; pp. pp. 25–28.
- Frank Machalett; Paul Seidel. Focused Ion Beams and Some Selected Applications; Wiley: Hoboken, NJ, United States, 2019; pp. 1-39.
- Chung-Soo Kim; Sung-Hoon Ahn; Dong-Young Jang; Review: Developments in micro/nanoscale fabrication by focused ion beams. Vac. 2012, 86, 1014-1035.
- T Koshikawa; R Shimizu; Secondary electron and backscattering measurements for polycrystalline copper with a spherical retarding-field analyser. J. Phys. D: Appl. Phys. 1973, 6, 1369-1380.
- Joseph I. Goldstein; Dale E. Newbury; Patrick Echlin; David C. Joy; Charles E. Lyman; Eric Lifshin; Linda Sawyer; Joseph R. Michael. Scanning Electron Microscopy and X-ray Microanalysis; Kluwer Academic/Plenum Publishers: New York, NY, USA, 2003; pp. 88-97.
- Joseph I. Goldstein; Dale E. Newbury; Joseph R. Michael; Nicholas W. M. Ritchie; John Henry J. Scott; David C. Joy. Backscattered Electrons; Springer Science and Business Media LLC: Dordrecht, GX, Netherlands, 2017; pp. 15-28.
- Kanaya, K.; Ono, S. . Interaction of Electron Beam with the Target in the Scanning Electron Microscope; Kyser, D.F., Niedrig, H., Newbury, D.E., Shimizu, R., Eds.; SEM Inc.: Chicago, IL, USA, 1984; pp. pp. 69–98..
- K Kanaya; S Okayama; Penetration and energy-loss theory of electrons in solid targets. J. Phys. D: Appl. Phys. 1972, 5, 43-58.
- Liu, J.; Niu, S.; Li, G.; Du, Z.; Zhang, Y.; Yang, J. Reconstructing 3D digital model without distortion forpoorly conductive porous rock by nanoprobe-assisted FIB-SEM tomography. J. Microsc. 2021, 282, 258–266.
- T. Prill; K. Schladitz; D. Jeulin; M. Faessel; C. Wieser; Morphological segmentation of FIB-SEM data of highly porous media. J. Microsc. 2013, 250, 77-87.
- Stackreg . Stackreg. Retrieved 2023-10-25
- Turboreg . Turboreg. Retrieved 2023-10-25
- Thomas Henning Loeber; Bert Laegel; Sandra Wolff; Sebastian Schuff; Frank Balle; Tilmann Beck; Dietmar Eifler; Jan Henrik Fitschen; Gabriele Steidl; Alessandra Leonhardt; et al.Marcos Vinicius Puydinger dos SantosJosé Alexandre DinizLeandro Tiago ManeraLucas Petersen Barbosa LimaTihomir AngelovAhmad AhmadElshad GuliyevAlexander ReumIvaylo AtanasovTzvetan IvanovValentyn IshchukMarcus KaestnerYana KrivoshapkinaSteve LenkClaudia LenkIvo W. RangelowMathias HolzNikolay NikolovDandan WangYamin HuangBinghai LiuLei ZhuJeffrey LamZhihong MaiAntti PeltonenHung Q. NguyenJuha T. MuhonenJukka P. PekolaMohd Sharizal AliasIbrahim DursunDong ShiMakhsud Ismatboevich SaidaminovElhadj Marwane DialloDavide PrianteTien Khee NgOsman Mohammed BakrBoon Siew OoiLarry J. MilletMitchel J. DoktyczScott T. RettererHyun-Chul JinJohn R. AbelsonMartin K. ErhardtRalph G. NuzzoNikolay I. BorgardtAlexander V. RumyantsevA. J. GonzalesM. W. PowellP. L. KingR. BrowningP. PianettaI. LindauM. KeenlysideG. Knapp Reducing curtaining effects in FIB/SEM applications by a goniometer stage and an image processing method. J. Vac. Sci. Technol. B 2017, 35, 06GK01.
- Remove Streaks . Remove Streaks. Retrieved 2023-10-25
- José David Arregui-Mena; Philip D. Edmondson; Anne A. Campbell; Yutai Katoh; Site specific, high-resolution characterisation of porosity in graphite using FIB-SEM tomography. J. Nucl. Mater. 2018, 511, 164-173.
- Gaussian Blur 3D . Gaussian Blur 3D. Retrieved 2023-10-25
- Gradient X Terminator . Gradient X Terminator. Retrieved 2023-10-25
- L.F. Silva; V.R. dos Santos; S. Paciornik; J.C.E. Mertens; Nikhilesh Chawla; Multiscale 3D characterization of discontinuities in underwater wet welds. Mater. Charact. 2015, 107, 358-366.
- Jong-Sen Lee; Digital image smoothing and the sigma filter. Comput. Vision, Graph. Image Process. 1983, 24, 255-269.
- Takeshi Terao; Gen Inoue; Motoaki Kawase; Norio Kubo; Makoto Yamaguchi; Kouji Yokoyama; Tomomi Tokunaga; Kazuhiko Shinohara; Yuka Hara; Toru Hara; et al. Development of novel three-dimensional reconstruction method for porous media for polymer electrolyte fuel cells using focused ion beam-scanning electron microscope tomography. J. Power Sources 2017, 347, 108-113.
- Bernhard Preim; Charl Botha. Image Analysis for Medical Visualization; Elsevier BV: Amsterdam, NX, Netherlands, 2014; pp. 111-175.
- James R. Wilson; Worawarit Kobsiriphat; Roberto Mendoza; Hsun-Yi Chen; Jon M. Hiller; Dean J. Miller; Katsuyo Thornton; Peter W. Voorhees; Stuart B. Adler; Scott A. Barnett; et al. Three-dimensional reconstruction of a solid-oxide fuel-cell anode. Nat. Mater. 2006, 5, 541-544.
- Hiroshi Iwai; Naoki Shikazono; Toshiaki Matsui; Hisanori Teshima; Masashi Kishimoto; Ryo Kishida; Daisuke Hayashi; Katsuhisa Matsuzaki; Daisuke Kanno; Motohiro Saito; et al.Hiroki MuroyamaKoichi EguchiNobuhide KasagiHideo Yoshida Quantification of Ni-YSZ Anode Microstructure Based on Dual Beam FIB-SEM Technique. ECS Trans. 2009, 25, 1819-1828.
- E.A. Wargo; V.P. Schulz; A. Çeçen; S.R. Kalidindi; E.C. Kumbur; Resolving macro- and micro-porous layer interaction in polymer electrolyte fuel cells using focused ion beam and X-ray computed tomography. Electrochimica Acta 2012, 87, 201-212.
- Martin Göbel; Michael Godehardt; Katja Schladitz; Multi-scale structural analysis of gas diffusion layers. J. Power Sources 2017, 355, 8-17.
- Zhangwei Chen; Xin Wang; Finn Giuliani; Alan Atkinson; Microstructural characteristics and elastic modulus of porous solids. Acta Mater. 2015, 89, 268-277.
- Zhangwei Chen; Xin Wang; Finn Giuliani; Alan Atkinson; Analyses of microstructural and elastic properties of porous SOFC cathodes based on focused ion beam tomography. J. Power Sources 2015, 273, 486-494.
- C. Endler-Schuck; J. Joos; C. Niedrig; A. Weber; E. Ivers-Tiffée; The chemical oxygen surface exchange and bulk diffusion coefficient determined by impedance spectroscopy of porous La0.58Sr0.4Co0.2Fe0.8O3−δ (LSCF) cathodes. Solid State Ionics 2015, 269, 67-79.
- Laura Almar; Julian Szász; André Weber; Ellen Ivers-Tiffée; Oxygen Transport Kinetics of Mixed Ionic-Electronic Conductors by Coupling Focused Ion Beam Tomography and Electrochemical Impedance Spectroscopy. J. Electrochem. Soc. 2017, 164, F289-F297.
- Vandana Singh; Satoshi Hashigami; Hiroki Muroyama; Toshiaki Matsui; Toru Inagaki; Koichi Eguchi; Influence of Fabrication Routes on Microstructure and Electrochemical Performance of Ni–GDC Cathode for High Temperature CO2Reduction in Solid Oxide Electrolysis Cells. J. Electrochem. Soc. 2016, 163, F3084-F3090.
- Atef Zekri; Martin Knipper; Jürgen Parisi; Thorsten Plaggenborg; Microstructure degradation of Ni/CGO anodes for solid oxide fuel cells after long operation time using 3D reconstructions by FIB tomography. Phys. Chem. Chem. Phys. 2017, 19, 13767-13777.
- C.Y. Jung; S.K. Kim; S.J. Lee; S.C. Yi; Three-dimensional reconstruction of coarse-dense dual catalyst layer for proton exchange membrane fuel cells. Electrochimica Acta 2016, 211, 142-147.
- M. Okumura; Z. Noda; J. Matsuda; Y. Tachikawa; M. Nishihara; S. M. Lyth; A. Hayashi; K. Sasaki; Correlating Cathode Microstructure with PEFC Performance Using FIB-SEM and TEM. J. Electrochem. Soc. 2017, 164, F928-F934.
- Severin Vierrath; Firat Güder; Andreas Menzel; Matthias Hagner; Roland Zengerle; Margit Zacharias; Simon Thiele; Enhancing the quality of the tomography of nanoporous materials for better understanding of polymer electrolyte fuel cell materials. J. Power Sources 2015, 285, 413-417.
- Andrew G. Star; Thomas F. Fuller; FIB-SEM Tomography Connects Microstructure to Corrosion-Induced Performance Loss in PEMFC Cathodes. J. Electrochem. Soc. 2017, 164, F901-F907.
- Christian Netzeband; Tobias Arlt; Klaus Wippermann; Werner Lehnert; Ingo Manke; Three-dimensional multiscale analysis of degradation of nano- and micro-structure in direct methanol fuel cell electrodes after methanol starvation. J. Power Sources 2016, 327, 481-487.
- Moses Ender; Jochen Joos; Thomas Carraro; Ellen Ivers-Tiffée; Three-dimensional reconstruction of a composite cathode for lithium-ion cells. Electrochem. Commun. 2011, 13, 166-168.
- Moses Ender; Jochen Joos; Thomas Carraro; Ellen Ivers-Tiffée; Quantitative Characterization of LiFePO4Cathodes Reconstructed by FIB/SEM Tomography. J. Electrochem. Soc. 2012, 159, A972-A980.
- Lukas Zielke; Tobias Hutzenlaub; Dean R. Wheeler; Chien‐Wei Chao; Ingo Manke; André Hilger; Nils Paust; Roland Zengerle; Simon Thiele; Three‐Phase Multiscale Modeling of a LiCoO2 Cathode: Combining the Advantages of FIB–SEM Imaging and X‐Ray Tomography. Adv. Energy Mater. 2014, 5, 1401612.
- A. Etiemble; N. Besnard; A. Bonnin; J. Adrien; T. Douillard; P. Tran-Van; L. Gautier; J.-C. Badot; E. Maire; B. Lestriez; et al. Multiscale morphological characterization of process induced heterogeneities in blended positive electrodes for lithium–ion batteries. J. Mater. Sci. 2016, 52, 3576-3596.
- Nicolas Besnard; Aurélien Etiemble; Thierry Douillard; Olivier Dubrunfaut; Pierre Tran-Van; Laurent Gautier; Sylvain Franger; Jean-Claude Badot; Eric Maire; Bernard Lestriez; et al. Multiscale Morphological and Electrical Characterization of Charge Transport Limitations to the Power Performance of Positive Electrode Blends for Lithium-Ion Batteries. Adv. Energy Mater. 2016, 7, 1602239.
- Bohang Song; Tan Sui; Siqi Ying; Liu Li; Li Lu; Alexander M. Korsunsky; Nano-structural changes in Li-ion battery cathodes during cycling revealed by FIB-SEM serial sectioning tomography. J. Mater. Chem. A 2015, 3, 18171-18179.
- Roberto Scipioni; Peter S. Jørgensen; Duc-The Ngo; Søren B. Simonsen; Zhao Liu; Kyle J. Yakal-Kremski; Hongqian Wang; Johan Hjelm; Poul Norby; Scott A. Barnett; et al.Søren H. Jensen Electron microscopy investigations of changes in morphology and conductivity of LiFePO4/C electrodes. J. Power Sources 2016, 307, 259-269.
- Aurélien Etiemble; Alix Tranchot; Thierry Douillard; Hassane Idrissi; Eric Maire; Lionel Roué; Evolution of the 3D Microstructure of a Si-Based Electrode for Li-Ion Batteries Investigated by FIB/SEM Tomography. J. Electrochem. Soc. 2016, 163, A1550-A1559.
- Roberto Scipioni; Peter S. Jørgensen; Daniel I. Stroe; Reza Younesi; Søren B. Simonsen; Poul Norby; Johan Hjelm; Søren H. Jensen; Complementary analyses of aging in a commercial LiFePO4/graphite 26650 cell. Electrochimica Acta 2018, 284, 454-468.
- Nicole Wollschläger; Laurie Palasse; Ines Häusler; Kai Dirscherl; Frédéric Oswald; Stéphanie Narbey; Erik Ortel; Vasile-Dan Hodoroaba; Characterization of the inner structure of porous TiO 2 nanoparticle films in dye sensitive solar cells (DSSC) by focused ion beam (FIB) tomography and transmission Kikuchi diffraction (TKD) in the scanning electron microscope (SEM). Mater. Charact. 2017, 131, 39-48.
- Silvan Suter; Marco Cantoni; Yannick K. Gaudy; Simone Pokrant; Sophia Haussener; Linking morphology and multi-physical transport in structured photoelectrodes. Sustain. Energy Fuels 2018, 2, 2661-2673.
- B. J. Inkson; T. Steer; G. Mobus; T. Wagner; Subsurface nanoindentation deformation of Cu-Al multilayers mapped in 3D by focused ion beam microscopy. J. Microsc. 2001, 201, 256-269.
- L. Holzer; F. Indutnyi; Ph. Gasser; B. Munch; M. Wegmann; Three-dimensional analysis of porous BaTiO3 ceramics using FIB nanotomography. J. Microsc. 2004, 216, 84-95.
- Lorenz Holzer; Beat Muench; Markus Wegmann; Philippe Gasser; Robert J. Flatt; FIB-Nanotomography of Particulate Systems—Part I: Particle Shape and Topology of Interfaces. J. Am. Ceram. Soc. 2006, 89, 2577-2585.
- Miroslava Schaffer; Julian Wagner; Bernhard Schaffer; Mario Schmied; Hans Mulders; Automated three-dimensional X-ray analysis using a dual-beam FIB. Ultramicroscopy 2007, 107, 587-597.
- M. Yan; M. Qian; C. Kong; M.S. Dargusch; Impacts of trace carbon on the microstructure of as-sintered biomedical Ti–15Mo alloy and reassessment of the maximum carbon limit. Acta Biomater. 2013, 10, 1014-1023.
- K. Kulawik; P.A. Buffat; A. Kruk; A.M. Wusatowska-Sarnek; A. Czyrska-Filemonowicz; Imaging and characterization of γ′ and γ″ nanoparticles in Inconel 718 by EDX elemental mapping and FIB–SEM tomography. Mater. Charact. 2015, 100, 74-80.
- Adam Kruk; Aleksandra Czyrska-Filemonowicz; The 3D Imaging and Metrology of Microstructural Elements in Innovative Materials for Clean Energy Systems and Aeronautics. Mater. Sci. Forum 2016, 879, 1019-1024.
- A. Kruk; G. Cempura; S. Lech; A. Czyrska -Filemonowicz; Stem-EDX and FIB-SEM Tomography of ALLVAC 718Plus Superalloy. Arch. Met. Mater. 2016, 61, 535-542.
- Adam Kruk; Grzegorz Cempura; Application of analytical electron microscopy and FIB-SEM tomographic technique for phase analysis in as-cast Allvac 718Plus superalloy. Int. J. Mater. Res. 2019, 110, 3-10.
- M. Roland; A. Kruglova; G. Gaiselmann; T. Brereton; V. Schmidt; F. Mücklich; S. Diebels; Numerical simulation and comparison of a real Al–Si alloy with virtually generated alloys. Arch. Appl. Mech. 2014, 85, 1161-1171.
- Sudhanshu S. Singh; Jose J. Loza; Arno P. Merkle; Nikhilesh Chawla; Three dimensional microstructural characterization of nanoscale precipitates in AA7075-T651 by focused ion beam (FIB) tomography. Mater. Charact. 2016, 118, 102-111.
- Y. Lu; Y.L. Chiu; I.P. Jones; Three-dimensional analysis of the microstructure and bio-corrosion of Mg–Zn and Mg–Zn–Ca alloys. Mater. Charact. 2016, 112, 113-121.
- Lena Eisenhut; Florian Schaefer; Patrick Gruenewald; Laura Weiter; Michael Marx; Christian Motz; Effect of a dislocation pile-up at the neutral axis on trans-crystalline crack growth for micro-bending fatigue. Int. J. Fatigue 2017, 94, 131-139.
- B. Dubiel; P. Indyka; T. Moskalewicz; A. Kruk; M. Zubko; I. Kalemba‐Rec; K. Berent; Characterization of the μ and P phase precipitates in the CMSX‐4 single crystal superalloy. J. Microsc. 2017, 266, 239-248.
- W. Rmili; N. Vivet; S. Chupin; T. Le Bihan; G. Le Quilliec; C. Richard; Quantitative Analysis of Porosity and Transport Properties by FIB-SEM 3D Imaging of a Solder Based Sintered Silver for a New Microelectronic Component. J. Electron. Mater. 2016, 45, 2242-2251.
- M. Ollivier; R.M. Harker; R.J. Chater; C.M. Gourlay; Thermal etching of silver: Influence of rolling defects. Mater. Charact. 2016, 118, 112-121.
- Baolei Liu; Yanhong Tian; Chenxi Wang; Rong An; Yang Liu; Extremely fast formation of Cu Sn intermetallic compounds in Cu/Sn/Cu system via a micro-resistance spot welding process. J. Alloy. Compd. 2016, 687, 667-673.
- J.W. Xian; S.A. Belyakov; M. Ollivier; K. Nogita; H. Yasuda; C.M. Gourlay; Cu6Sn5 crystal growth mechanisms during solidification of electronic interconnections. Acta Mater. 2017, 126, 540-551.
- Carl H. Sondergeld; Raymond Joseph Ambrose; Chandra Shekhar Rai; Jason Moncrieff. Micro-Structural Studies of Gas Shales; Society of Petroleum Engineers (SPE): Richardson, TX, United States, 2010; pp. 23-25.
- Lin Ma; Patrick J. Dowey; Ernest Rutter; Kevin G. Taylor; Peter D. Lee; A novel upscaling procedure for characterising heterogeneous shale porosity from nanometer-to millimetre-scale in 3D. Energy 2019, 181, 1285-1297.
- Zeyen, N.; Benzerara, K.; Li, J.; Groleau, A.; Balan, E.; Robert, J.-L.; Estève, I.; Tavera, R.; Moreira, D.; Lòpez-Garcia, P.; et al. Formation of low-T hydrated silicates in moder microbialites from Mexico and implications for microbial fossilization. Frontier Earth Science 2015, 3, 64.
- Yang Liu; Helen E. King; Marijn A. Van Huis; Martyn R. Drury; Oliver Plümper; Nano-Tomography of Porous Geological Materials Using Focused Ion Beam-Scanning Electron Microscopy. Miner. 2016, 6, 104.
- Guillaume Desbois; Janos L. Urai; Susanne Hemes; Birgit Schröppel; Jens-Oliver Schwarz; Monika Mac; Dominik Weiel; Multi-scale analysis of porosity in diagenetically altered reservoir sandstone from the Permian Rotliegend (Germany). J. Pet. Sci. Eng. 2016, 140, 128-148.
- D. A. Matthijs de Winter; Florian Meirer; Bert M. Weckhuysen; FIB-SEM Tomography Probes the Mesoscale Pore Space of an Individual Catalytic Cracking Particle. ACS Catal. 2016, 6, 3158-3167.
- Kiho Bae; Jun Woo Kim; Ji-Won Son; Tonghun Lee; Sangkyun Kang; Fritz B. Prinz; Joon Hyung Shim; 3D Evaluation of Porous Zeolite Absorbents Using FIB-SEM Tomography. Int. J. Precis. Eng. Manuf. Technol. 2018, 5, 195-199.
- Joshua F. Einsle; Richard J. Harrison; Takeshi Kasama; Pádraig Ó Conbhuí; Karl Fabian; Wyn Williams; Leonie Woodland; Roger R. Fu; Benjamin P. Weiss; Paul A. Midgley; et al. Multi-scale three-dimensional characterization of iron particles in dusty olivine: Implications for paleomagnetism of chondritic meteorites. Am. Miner. 2016, 101, 2070-2084.
- Zhou, H.; Wirth, R.; Gleeson, S.A.; Schreiber, S.; Mayanna, A. Three-dimensional and microstructural fingerprinting of gold nanoparticles at fluid-mineral interfaces. Am. Miner. 2021, 106, 97–104.
- Lukas M. Keller; Lorenz Holzer; Philippe Gasser; Rolf Erni; Marta D. Rossell; Intergranular pore space evolution in MX80 bentonite during a long-term experiment. Appl. Clay Sci. 2015, 104, 150-159.
- Susanne Hemes; Guillaume Desbois; Janos L. Urai; Birgit Schröppel; Jens-Oliver Schwarz; Multi-scale characterization of porosity in Boom Clay (HADES-level, Mol, Belgium) using a combination of X-ray μ-CT, 2D BIB-SEM and FIB-SEM tomography. Microporous Mesoporous Mater. 2015, 208, 1-20.
- Brandon W. Chung; Robert G. Erler; Nick E. Teslich; Three-dimensional microstructural characterization of bulk plutonium and uranium metals using focused ion beam technique. J. Nucl. Mater. 2016, 473, 264-271.
- Brandon W. Chung; Richard A. Torres; Microstructural characterization of plutonium oxalate and oxide particles by three-dimensional focused ion beam tomography. Mater. 2019, 6, 100294.
- Casey McKinney; Rachel Seibert; Grant Helmreich; Assel Aitkaliyeva; Kurt Terrani; Three-dimensional bubble reconstruction in high burnup UO2. J. Nucl. Mater. 2020, 532, 152053.
- A. Baris; S. Abolhassani; Y. L. Chiu; H. E. Evans; Observation of crack microstructure in oxides and its correlation to oxidation and hydrogen-uptake by 3D FIB Tomography – case of Zr-ZrO2 in reactor. Mater. High Temp. 2017, 35, 14-21.
- A. Baris; R. Restani; R. Grabherr; Y.-L. Chiu; H.E. Evans; K. Ammon; M. Limbäck; S. Abolhassani; Chemical and microstructural characterization of a 9 cycle Zircaloy-2 cladding using EPMA and FIB tomography. J. Nucl. Mater. 2018, 504, 144-160.
- Urszula Stachewicz; Farid Modaresifar; Russell J. Bailey; Ton Peijs; Asa H. Barber; Manufacture of Void-Free Electrospun Polymer Nanofiber Composites with Optimized Mechanical Properties. ACS Appl. Mater. Interfaces 2012, 4, 2577-2582.
- Urszula Stachewicz; Russell J. Bailey; Hao Zhang; Corinne A. Stone; Colin R. Willis; Asa H. Barber; Wetting Hierarchy in Oleophobic 3D Electrospun Nanofiber Networks. ACS Appl. Mater. Interfaces 2015, 7, 16645-16652.

