Submitted Successfully!
To reward your contribution, here is a gift for you: A free trial for our video production service.
Thank you for your contribution! You can also upload a video entry or images related to this topic.
Version Summary Created by Modification Content Size Created at Operation
1 -- 2865 2023-10-18 22:19:09 |
2 format change Meta information modification 2865 2023-10-19 04:37:51 |

Video Upload Options

Do you have a full video?

Confirm

Are you sure to Delete?
Cite
If you have any further questions, please contact Encyclopedia Editorial Office.
Bogdanova, O.; Viskuba, K.; Zemīte, L. Barriers and Enables in Demand Response Performance Chain. Encyclopedia. Available online: https://encyclopedia.pub/entry/50488 (accessed on 28 April 2024).
Bogdanova O, Viskuba K, Zemīte L. Barriers and Enables in Demand Response Performance Chain. Encyclopedia. Available at: https://encyclopedia.pub/entry/50488. Accessed April 28, 2024.
Bogdanova, Olga, Karīna Viskuba, Laila Zemīte. "Barriers and Enables in Demand Response Performance Chain" Encyclopedia, https://encyclopedia.pub/entry/50488 (accessed April 28, 2024).
Bogdanova, O., Viskuba, K., & Zemīte, L. (2023, October 18). Barriers and Enables in Demand Response Performance Chain. In Encyclopedia. https://encyclopedia.pub/entry/50488
Bogdanova, Olga, et al. "Barriers and Enables in Demand Response Performance Chain." Encyclopedia. Web. 18 October, 2023.
Barriers and Enables in Demand Response Performance Chain
Edit

The role of demand response increases considerably with a higher share of renewable energy sources in the energy mix, characterized with more frequent energy market price fluctuations due to mismatch between uncontrollable weather-dependent production and currently relatively inflexible energy consumption. Reallocation of energy consumption from high-price hours to lower price hours helps to avoid extra costs to the entire economy and ensures the possibility to minimize fossil-based energy generation, therefore contributing to the achievement of zero-emission goals.

demand response demand-side management pricing mechanisms incentives

1. Introduction

The world’s energy experts recognize that it would be possible to considerably facilitate energy transition and move faster towards the largest share of renewable energy sources (thereafter—RES) in the energy portfolio, in case an adequate public involvement is ensured. Involvement is necessary both by implementing extensive energy efficiency measures and by actively engaging society in demand response (thereafter—DR) measures, by maximally adapting the energy user’s consumption to variable generation. Supporting the development of RES in the vicinity also ensures the shortest possible distance between generation and consumption, reducing economic and energy losses, both by offloading the centralized network [1].
The ability to clearly reflect data increases people’s trust, while trust and economic interest are the basis for the active involvement of energy users. If there is a financial interest, then the person agrees to share the data. It is essential to ensure that the different stages of the value chain of the energy ecosystem are interested in cooperating, and financial incentives based on market principles help to ensure this interest. For example, wind or solar farm communities produce energy, and thanks to aggregation services, residents are interested in participating in DR measures adjusting their consumption to the generation intensity pattern as the initiative provides a financial interest (usually in the form of savings on electricity charges), and the data provides the necessary process transparency [2].
In the past, DR programs were not widely used and served only as an additional tool for a power system management, which was not particularly implemented often during periods of rapid and large power growth. Extensive restructuring of the energy market, evolution of technology and IT sphere, as well as a greater experience gradually fostered the development of various automatic and safe DR control methods and their successful integration into electricity system operations. In addition, it ensured cost reduction of DR management and relatively quick and easy implementation, making it a modern and effective solution for improving the flexibility of the electricity system [3].
The role of DR in ensuring a resilient and sustainable energy system increases considerably with a higher share of RES stepping in the energy mix of regions. In general, RES are characterized with more frequent energy market price fluctuations due to a mismatch between uncontrollable weather-dependent generation and currently relatively inflexible energy consumption. Shifting the energy consumption from high-price hours to lower price hours not only helps to avoid extra costs to the entire economy, but also ensures the possibility to minimize fossil-based energy generation, therefore contributing to the achievement of ambitious zero-emission goals.

2. The Nature of Demand-Side Management and Demand Response

Before diving into the layers of DR performance influencers and the coherence of their relationships, it is crucial to investigate the main characteristics and components of DSM and DR.

2.1. The Evolution of Demand-Side Management

In the late 1970s, the concept of DSM was introduced in Europe and the US with the main drivers being changes in the electricity grid, electrification progress, industrial development, technological evolution, increasing loads and the ageing of the existing electricity system [4]. Gellings and Chamberlin can be considered as the forerunners in DSM research, who primarily defined DSM as the planning and implementation of activities aimed at influencing consumers’ electricity consumption, resulting in a change in the utility’s load shape, i.e., a change in the time pattern and volume of the utility’s load [5][6][7][8]. In 1993, Gellings and Chamberlin refined the previous definition of DSM, emphasizing the inclusion of activities commonly referred to as load management, electrification, strategic growth or intentional market share gains [9].
In the 1970s and most of the 1990s, DSM was implemented by vertically integrated utilities in a structured and regulated environment. This began to change in the late 1980s and early 1990s, when the energy sector entered a process of restructuring and liberalizing energy markets, which was extensively studied by Joskow, as well as by Beesley–Littlechild [10][11][12][13]. The move away from standardized cost-of-service principles allowed electricity producers to sell electricity at market prices based on supply and demand interaction. At the same time, the restructuring process shifted responsibility for grid maintenance from the electricity utilities to the system operators, which reduced the incentive for traditional utilities to maintain demand management programs [13][14].
During the 1990s, the problems of climate change accelerated the evolution of energy efficiency and renewable energy in such a way that it emphasized the need for a flexible energy system, as well as a broadened and strengthened concept of DSM and DR. In 2000, the U.S. Department of Energy highlighted that DSM programs consist of electric service planning, implementation, and monitoring activities designed to encourage consumers to change their level and pattern of electricity consumption [15]. In 2010, Greening provided a relatively broad definition, emphasizing the changes in consumer electricity consumption in response to price, and the introduction of more energy-efficient technologies [16]. Eissa, based on the research of Isaksen et al., Ashok and Banerjee, and Effler et al., discussed load management and characterized it as the process of scheduling loads to reduce electricity consumption and/or peak demand, which can be achieved through load shedding and restoration, load shifting, installation of energy efficient processes and equipment, usage of energy storage, cogeneration and non-conventional energy sources, as well as reactive power control [17]. In 2011, the phenomenon of DSM was also explained by Kerr–Lemaire–Owen who added customer encouragement to modify patterns of electricity usage [18]. In 2015, the definition proposed by Warren reflects the aforementioned explanations and also includes the vector of energy policy towards the reduction of GHG emissions, the wider use of renewable energy sources, and maintaining the safe operation of the energy system [19].
According to the type of implementation, DSM is usually divided into two main categories: energy efficiency and DR (Figure 1) [14][17][20][21][22]. However, some authors, for instance, Stanelyte et al., based on Warren, also highlighted on-site back-up (storage, generation) as a separate category of DSM [4]. Strategic load growth was singled out separately in Lampropoulos et al.’s research [23], while Akbari–Dibavar et al., in addition to DR and energy efficiency, identified the following DSM categories: load growth, energy saving, demand shifting, spinning reserve, and virtual power plants [24].
Figure 1. Classifications of DSM and DR, based on the scope on the research.
The main characteristics of energy efficiency, which are common in the reviewed publications, are its orientation towards reduction of energy consumption by using energy-efficient technologies and equipment without diminishing comfort level, and its static nature, i.e., non-adaption to the signals of the energy system or the market [21][25][26][27][28]. Maintaining comfort level is a key aspect that distinguishes energy efficiency from energy saving. Moreover, energy efficiency measures are long-term oriented.
As part of the research project, the expert working group of the World Energy Council (WEC) have evaluated several energy policy transition scenarios up to 2050, such as Bloomberg, IPCC, IEA, IRENA, BP, McKinsey, DNV, Shell, OECD, Equinor and others. Despite different assumptions based on different methodologies and technological focuses, it can be seen that all of them, notwithstanding the positive trend of economic development and, consequently, the more intensive use of energy-intensive equipment and processes, predict a significant reduction in GHG emissions. The increasing energy demand is compensated by significant energy efficiency measures [1].
The research concludes that the main drivers of energy transition highlight electrification, decarbonization and energy efficiency. A large number of scenarios show the freedom of choice possibilities of each country’s energy system from the point of view of technology use. At the same time, when creating a balanced solution to the energy trilemma (energy affordability, security and sustainability), it is essential to take into account the peculiarities of each country, which determine the cost and safety parameters of the relevant renewable energy technology in the specific energy system. None of the scenarios believe that it is possible to achieve the ambitious net-zero aims, thus continuing the “business as usual” approach. DR and connectivity, together with storages, carbon pricing and digitalization, are the new strong indispensable players to succeed [29].

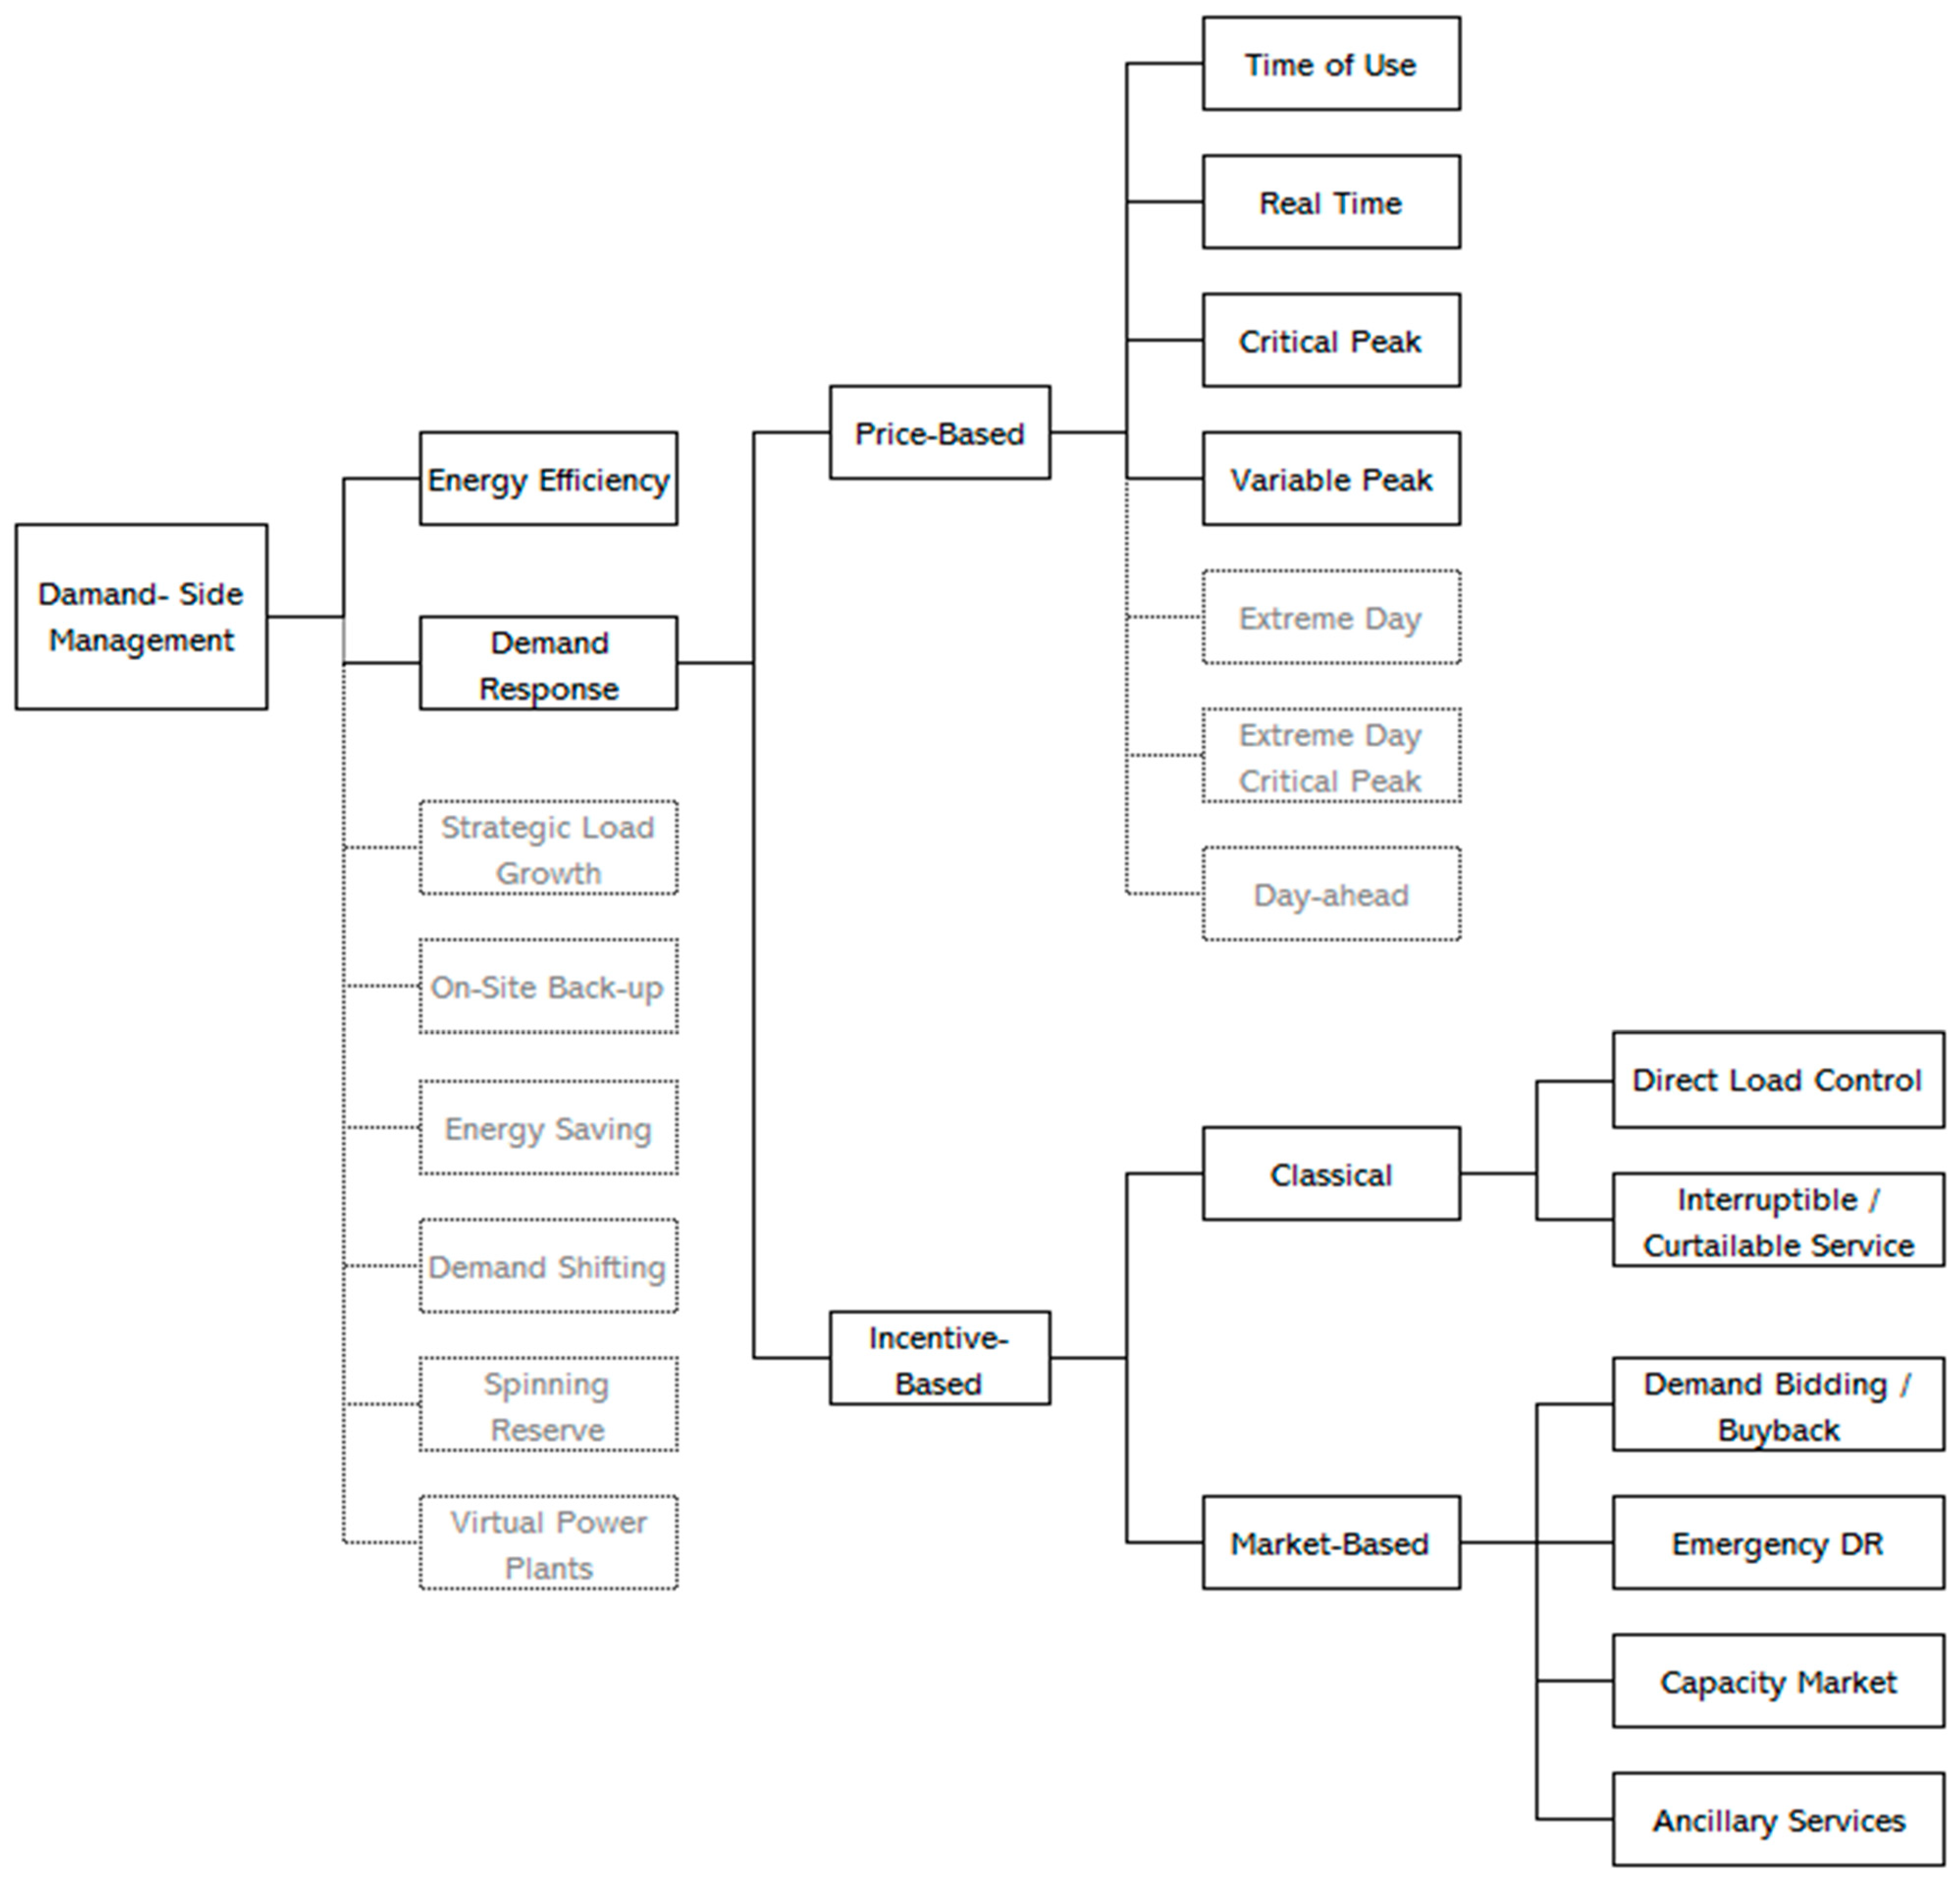
2.2. Demand Response Products and Services

DR is a more flexible tool compared to energy efficiency. In 2006, the U.S. Department of Energy defined electricity DR as “changes in electric use by demand-side resources from their normal consumption patterns in response to changes in the price of electricity, or to incentive payments designed to induce lower electricity use at times of high wholesale market prices or when system reliability is jeopardized [26]”. This definition was also supported by the Federal Energy Regulatory Commission in 2010 [30]. In 2007, Albadi and El-Saadany emphasized that DR includes all intentional changes in end-users’ electricity consumption patterns, which aim to change the timing, instantaneous demand level, or total electricity consumption [31]. In 2022, Morales–Espana et. al., as well as the International Energy Agency in the report on DR, provided its general explanation as shifting or reducing electricity demand with the aim of balancing the grid, and ensuring flexibility in wholesale and other electricity markets [21][32].
DR is a mechanism that responds to price and system signals, which can be implemented at different end-user scales and at different grid levels (system transmission, distribution, retail). DR has dynamic and event-driven nature and typically involves dynamic electricity pricing, contractual or voluntary curtailment. According to Bakr’s research, DR services can be classified differently depending on certain criteria. On the one hand, is to categorize by economic or market signals (e.g., high prices) and physical emergency signals (i.e., grid signals), whereas on the other hand, it is possible to classify the DR based on the services offered (e.g., power or ancillary services). DR programs can also be categorized based on the goals of program administrators (e.g., load shaping and congestion management) or based on the compensation they offer to program members (e.g., discounts, cheaper fares) [25]. One of the most common DR classifications is based on its stimulus or incentives. In this regard, DR can be (Figure 1):
  • An implicit or price-based scheme in which the same time is self-dispatched or a load is controlled indirectly. Electricity consumers change or reallocate their consumption reflecting electricity price or cost signals. Electricity suppliers offer different pricing products that depend on time, for example, day and night prices or dynamic pricing based on wholesale market prices. As this is an indirect load control scheme, there is no two-way communication between consumers and operators, except a response of aggregated consumers, which can be measured by operators. Consumers make decisions individually, and in order to make them more efficient, smart metering and home energy management systems are required. The main purpose of these programs is to smooth the demand curve by offering a high price during peak periods and lower prices during off-peak periods [18][21][22][33][34][35][36].
  • An explicit or incentive-based scheme, in which dispatchment is conducted by a third party classified as any of the following: transmission system operators, distribution system operators, or the utility or retailer of the energy user and a DR aggregator. An explicit DR scheme consists of direct load control and market-based mechanisms, which allow the trading of the participant’s dispatchable flexibility in energy markets. This DR case is based on two-way communication and agreements, which lowers the risk of response unpredictability but may affect the consumer’s independent decision and comfort level. Usually the incentive-based schemes are implemented by an aggregator [21][22][33][34][35][36].
Usually, when the end-users obtain the possibility to participate in explicit DR, they implement it through their supplier, who acts as an aggregator. The availability of independent aggregation—a compensation mechanism, the existence of flexible markets at the DSO level, accessible minimum bids, etc.—is determined by regulatory, technical and market factors. Figure 2 represents the development steps of small end-users from having explicit DR available to them to having at least primary legislation on independent aggregators, and finally to having independent aggregators of small end-users operating in the market (Figure 2).
Figure 2. Status of explicit DR and independent aggregators across the EU Member States in 2021 [37].
In 2021, the aggregation of end-users and their participation, at least at some level, is legally allowed and technically possible in 22 EU countries, although the availability of service is not equal to the actor’s activity in the market. However, the status of Independent Aggregators can be defined as a spectrum rather than a clear category, because the range of services and multitude of markets vary from one Member State to another at different levels of maturity.
Based on that, in 2021 there were only seven EU countries where independent aggregators of end-users exist and participate in at least one electricity market: Belgium, Denmark, Estonia, Finland, France, as well as Hungary and Romania, where the market was just emerging. Across the abovementioned countries, only in France do independent aggregators of end-users have access to all markets. Meanwhile, in Denmark, the high level of taxes makes the business case difficult for the independent aggregators. The DR development progress during the past five years has been the most remarkable in Croatia, Hungary and Estonia. The middle part between Austria and Sweden is extremely diverse and includes countries where end-users can aggregate through a comprehensive legal framework, but the market does not reflect the range of possibilities, as well as countries where aggregation of end-users is possible through their supplier, and countries where there are locally developed entities through which end-users can participate in the markets (Figure 3) [37].
Figure 3. Degrees of market representation for explicit DR across EU Member states in 2021 [37].

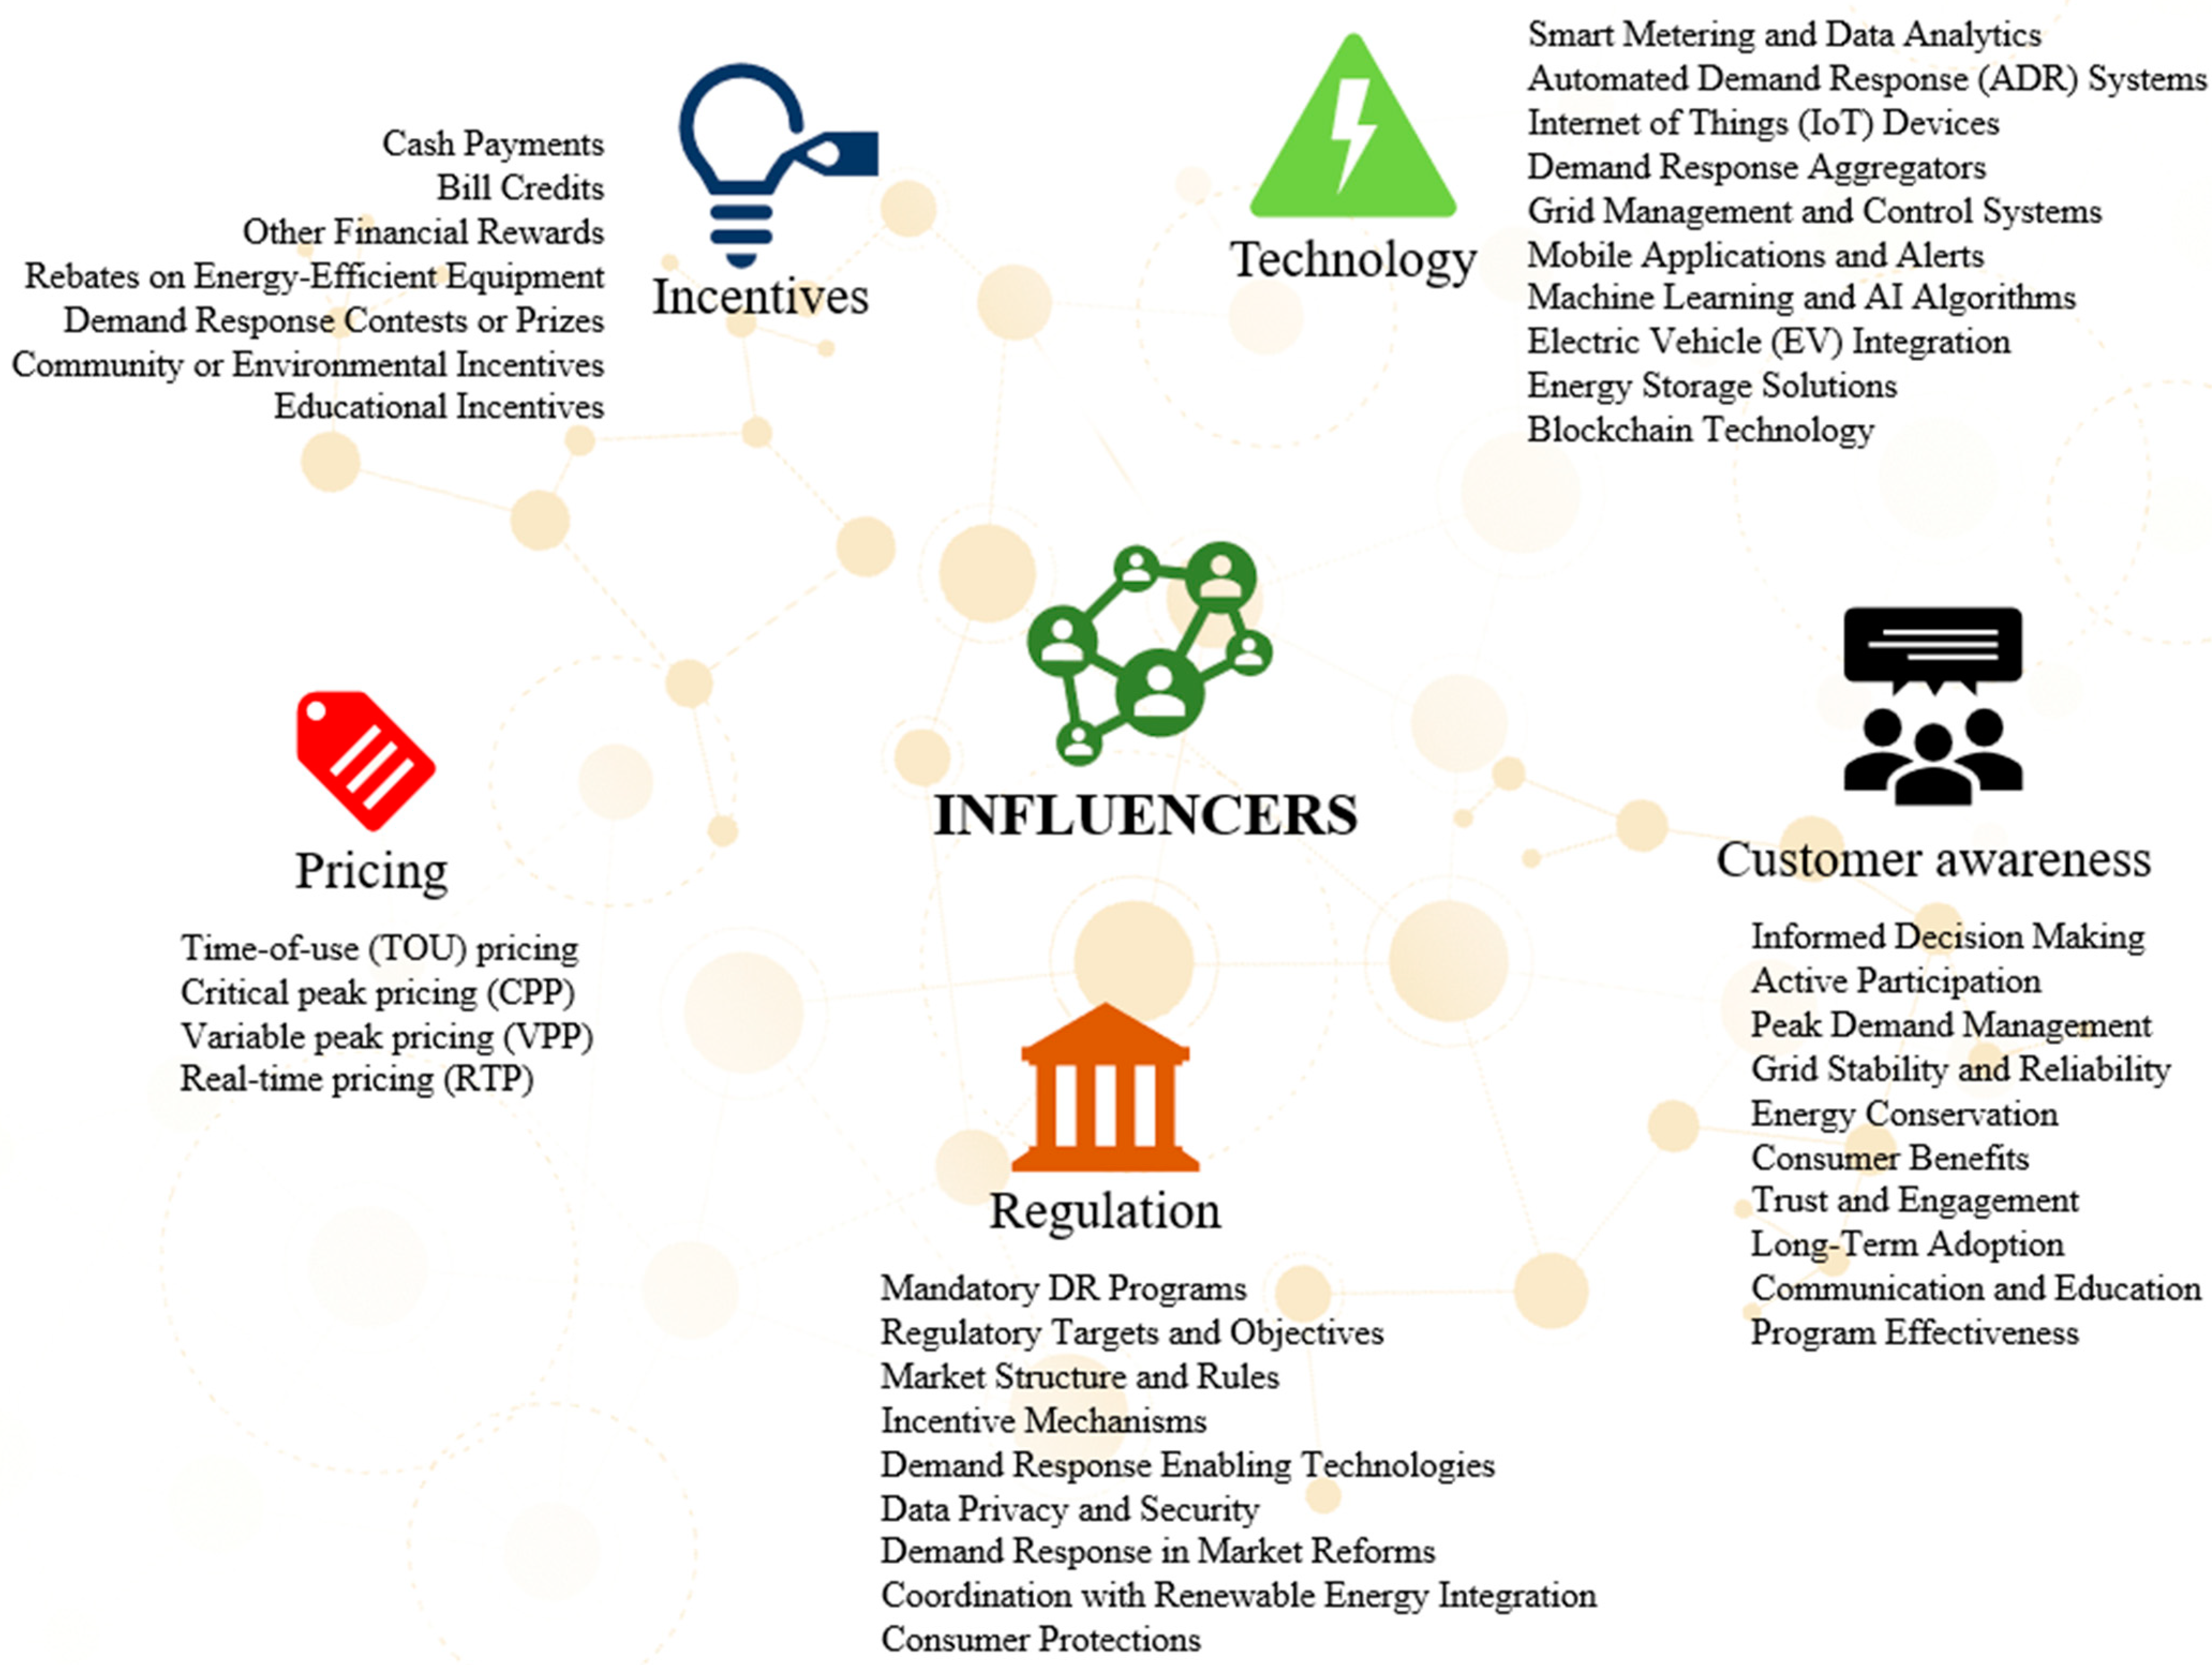
3. The Influencers of Demand Response Implementation and Performance

DR is a complex system and consists of many various players: service providers, schemes participants, policy makers, regulators, authorities, etc. Meanwhile, DR cannot be explored as a completely separate component amid modern, well-integrated energy systems. That is why it is also important to investigate the coherence of DR with other smart solutions and technologies. The following are the main influencers of DR implementation and performance (Figure 4):
Figure 4. The Influencers of DR implementation and performance.
  • The type of pricing mechanism used can have a significant impact on DR participation. TOU pricing, which charges different rates for electricity at different times of the day, is one of the most common DR pricing mechanisms. Other pricing mechanisms include CPP, VPP, RTP [38][39].
  • Incentives can be used to encourage consumers to participate in DR programs. These incentives can include cash payments, bill credits, or other rewards [32].
  • The availability of technology can also influence DR implementation and performance. For example, smart meters can be used to track and manage energy consumption, which can make it easier for consumers to participate in DR programs [40].
  • Government regulations can also influence DR implementation and performance. For example, some governments require utilities to offer DR programs to their customers [32][41].
  • Customer awareness of DR programs is also important. If consumers are not aware of the benefits of DR, they are less likely to participate in those programs [42].
By effectively considering these influencers, utilities and policymakers can design DR programs that are attractive and beneficial to both consumers and the overall energy system. Next, the research describes the implementation of each initiative, its barriers, enables and real examples.
For easier comprehension of further discussion, the authors introduce the summary of main enables and barriers of DR implementation and performance influencers (Table 1).
Table 1. Main enables and barriers of DR implementation and performance influencers.

Influencers

Enables

Barriers

Pricing

TOU

Understandable and straightforward implementation

Less effective in sharp peak curtailments

CPP

Effectively empowers grid stability

Additional revenue for utilities during peak periods

Poor management can result in lower participation level

VPP

Moderate stimulus for load shifting

Quite dynamic pricing signals

RTP

Electricity consumption optimization based on real-time market

Advanced information and communication infrastructure

Incentives

Financial rewards or other benefits for consumers

Financial resources for incentives from utilities and grid operators

Higher customer loyalty

Overcompensation risk

Promote environmentally friendly energy system and eco-friendly technologies

Budget constraints of utilities may limit incentives and lead to lower participation rates

Cost savings for utilities and grid operators

Complex and time-consuming administration


Technical requirements

Technology

Real-time monitoring and control

Upfront costs for utilities and consumers

Informed decision making

Privacy and security concerns

Faster, more precise responses

Digital divide between consumers

Optimized DR strategies

Complexity that requires technical expertise and trainings

Automated DR

Malfunctioning issues or lack of compatibility

Emergence of DR aggregators


Customer awareness

Familiarity and knowledge

Unfamiliarity and lack of knowledge

Social motivations

Distrust

Innovativeness

Technology requirements and technical issues

Financial and other benefits

Financial costs

Environmental motivations

Risks—finance, autonomy, comfort, adaptability

Reputation


Regulation

Financial incentives

Additional compliance (administrative, financial) costs for utilities and other stakeholders

Regulatory support

Complex and challenging compliance process

Promotion of technology adoption

Slow and changeable regulation

Standardization

Government-mandated DR programs may lack flexibility

Regulations and clear guidelines on data privacy and security


Empowerment of market competition


Transparent and fair regulations build trust and enhance participation rates


References

  1. Canizes, B.; Silveira, V.; Zita, V. Demand response and dispatchable generation as ancillary services to support the low voltage distribution network operation. Energy Rep. 2022, 8, 7–15.
  2. Bogdanova, O.; Pigeons, K. Factors affecting energy costs: Green deal impact. In Towards Climate Neutrality: Economic Impacts, Opportunities and Risks, 1st ed.; Šteinbuka, I., Bogdanova, O., Eds.; University of Latvia Press: Riga, Latvia, 2023; pp. 70–86.
  3. National Renewable Energy Laboratory. Potential Roles for Demand Response in High-Growth Electric Systems with Increasing Shares of Renewable Generation. Available online: https://www.nrel.gov/docs/fy19osti/70630.pdf (accessed on 24 July 2023).
  4. Stanelyte, D.; Radziukyniene, N.; Radziukynas, V. Overview of demand-response services: A review. Energies 2022, 15, 1659.
  5. Gellings, C.W. The concept of demand-side management for electric utilities. Proc. IEEE 1985, 73, 1468–1470.
  6. Gellings, C.W.; Chamberlin, J.H. Introduction. In Demand-Side Management: Concepts and Methods, 1st ed.; The Fairmont Press, Inc.: Atlanta, GA, USA, 1988; pp. 1–11.
  7. Gellings, C.W. Evolving practice of demand-side management. J. Mod. Power Syst. Clean Energy 2017, 5, 1–9.
  8. Gellings, C.W. The smart grid—Enabling demand response—The dynamic energy systems concept. In The Smart Grid: Enabling Energy Efficiency and Demand Response; River Publishers: Aalborg, Denmark, 2020; pp. 131–151.
  9. Gellings, C.W.; Chamberlin, J.H. Introduction. In Demand-Side Management: Concepts and Methods, 2nd ed.; The Fairmont Press, Inc.: Atlanta, GA, USA, 1993; pp. 2–3.
  10. Beesley, M.; Littlechild, S. The regulation of privatized monopolies in the United Kingdom. Rand J. Econ. 1989, 20, 454–472.
  11. Joskow, P.L. Regulatory failure, regulatory reform, and structural change in the electrical power industry. Brook. Pap. Econ. Act. 1989, 20, 125–208.
  12. Joskow, P.L. Introducing competition into regulated network industries: From hierarchies to markets in electricity. Ind. Corp. Change 1996, 5, 341–382.
  13. Joskow, P.L. Lessons learned from electricity market liberalization. Energy J. 2008, 29, 9–42.
  14. Synapse Energy Economics Inc. Demand Response as a Power System Resource. Available online: https://www.synapse-energy.com/sites/default/files/SynapseReport.2013-03.RAP_.US-Demand-Response.12-080.pdf (accessed on 15 July 2023).
  15. U.S. Energy Information Administration. US Electric Utility Demand-Side Management. 2000. Available online: https://www.eia.gov/electricity/data/eia861/dsm/ (accessed on 15 July 2023).
  16. Greening, L.A. Demand response resources: Who is responsible for implementation in a deregulated market? Energy 2010, 35, 1518–1525.
  17. Eissa, M.M. Demand side management program evaluation based on industrial and commercial field data. Energy Policy 2011, 39, 5961–5969.
  18. Warren, P. A Review of demand-side management policy in the UK. Renew. Sustain. Energy Rev. 2014, 29, 941–951.
  19. Warren, P. Demand-Side Management Policy: Mechanisms for Success and Failure. Ph.D. Thesis, UCL Energy Institute, University College London, London, UK, August 2015.
  20. U.S. Energy Information Administration. National Action Plan for Energy Efficiency. Coordination of Energy Efficiency and Demand Response. Available online: https://www.epa.gov/sites/default/files/2015-08/documents/ee_and_dr.pdf (accessed on 16 July 2023).
  21. Morales-Espana, G.; Martínez-Gordon, R.; Sijm, J. Classifying and modelling demand response in power systems. Energy 2022, 242, 122544.
  22. Kinhekar, N.; Padhy, N.P.; Gupta, H.O. Multiobjective demand side management solutions for utilities with peak demand deficit. J. Int. Electr. Power Energy Syst. 2014, 55, 612–619.
  23. Lampropoulos, I.; Kling, W.L.; Ribeiro, P.F.; Berg, J. History of demand side management and classification of demand response control schemes. In Proceedings of the IEEE Power and Energy Society (PES) General Meeting, Vancouver, BC, Canada, 21–25 July 2013.
  24. Akbari-Dibavar, A.; Farahmand-Zahe, A.; Mohammadi-Ivatloo, B. Concept and glossary of demand response programs. In Demand Response Application in Smart Grids: Concepts and Planning, 1st ed.; Nojavan, S., Zare, K., Eds.; Springer: Berlin/Heidelberg, Germany, 2020; Volume 1, pp. 1–15.
  25. Bakr, S. Dynamic Demand Response in Residential Prosumer Collectives. Ph.D. Thesis, University of Otago, Dunedin, New Zealand, 30 June 2018.
  26. U.S. Department of Energy, Office of Scientific and Technical Information. Energy Efficiency and Electric System Reliability: A Look at Reliability-Focused Energy Efficiency Programs Used to Help Address the Electricity Crisis of 2001. Available online: https://www.osti.gov/servlets/purl/812819 (accessed on 16 July 2023).
  27. Behrangrad, M. A review of demand side management business models in the electricity market. Renew. Sustain. Energy Rev. 2015, 47, 270–283.
  28. Tronchin, L.; Manfren, M.; Nastasi, B. Energy efficiency, demand side management and energy storage technologies—A critical analysis of possible paths of integration in the built environment. Renew. Sustain. Energy Rev. 2018, 95, 341–353.
  29. World Energy Council. The World in 2050: Explore MAP Phase Insights. Visionario Project Map Phase Analysis. Available online: https://www.worldenergy.org/assets/downloads/FEL_Visionario_MAP_Phase_Analysis_Presentation.pdf?v=1662554370 (accessed on 10 August 2023).
  30. FERC. Assessment of Demand Response and Advanced Metering. Available online: https://www.smartgrid.gov/files/documents/2010-dr-report.pdf (accessed on 17 July 2023).
  31. Albadi, M.H.; El-Saadany, E.F. Demand response in electricity markets: An overview. In Proceedings of the IEEE Power Engineering Society General Meeting, Tampa, FL, USA, 24–28 June 2007; pp. 1–5.
  32. International Energy Agency. Demand Response. Available online: https://www.iea.org/energy-system/energy-efficiency-and-demand/demand-response#programmes (accessed on 17 July 2023).
  33. Usman, R.; Mirzania, P.; Alnaser, S.W.; Hart, P.; Long, C. Systematic review of demand-side management strategies in power systems of developed and developing countries. Energies 2022, 15, 7858.
  34. De Zotti, G. Leveraging Consumers’ Flexibility for the Provision of Ancillary Services. Ph.D. Thesis, Technical University of Denmark, Kongens Lyngby, Denmark, 2019.
  35. TNO. The Role of Demand Response in the Power System of The Netherlands, 2030–2050. Available online: https://publications.tno.nl/publication/34639481/emVYyq/TNO-2022-P10131.pdf (accessed on 21 July 2023).
  36. Assad, U.; Hassan, M.A.S.; Farooq, U.; Kabir, A.; Khan, M.Z.; Bukhari, S.S.H.; Jaffri, Z.u.A.; Oláh, J.; Popp, J. Smart Grid, Demand Response and Optimization: A Critical Review of Computational Methods. Energies 2022, 15, 2003.
  37. Saviuc, I.; Lopez, C.; Puskas, A.; Rollert, K.; Bertoldi, P. Explicit Demand Response for Small End-Users and Independent Aggregators, EUR 31190 EN; Publications Office of the European Union: Luxembourg, 2022; pp. 1–132.
  38. Wang, Z.; Sun, M.; Gao, C.; Wang, X.; Ampimah, B.C. A new interactive real-time pricing mechanism of demand response based on an evaluation model. Appl. Energy 2021, 295, 117052.
  39. Eid, C.; Koliou, E.; Valles, M.; Reneses, J.; Hakvoort, R. Time-based pricing and electricity demand response: Existing barriers and next steps. Util. Policy 2016, 40, 15–25.
  40. Jasevics, A.; Zemite, L.; Kunickis, M. Demand load control with smart meters. In Proceedings of the 2017 IEEE 58th Annual International Scientific Conference on Power and Electrical Engineering of Riga Technical University, Riga, Latvia, 10–12 October 2017.
  41. Sauhats, A.; Zemite, L.; Petrichenko, L.; Moshkin, I.; Jasevics, A. A estimating the economic impacts of net metering schemes for residential PV systems with profiling of power demand, generation, and market prices. Energies 2018, 11, 3222.
  42. Ferreira, P.; Rocha, A.; Araújo, M. Awareness and attitudes towards demand response programs—A pilot study. In Proceedings of the International Conference on Smart Energy Systems and Technologies (SEST), Seville, Spain, 10–12 September 2018.
More
Information
Contributors MDPI registered users' name will be linked to their SciProfiles pages. To register with us, please refer to https://encyclopedia.pub/register : , ,
View Times: 202
Revisions: 2 times (View History)
Update Date: 19 Oct 2023
1000/1000