Your browser does not fully support modern features. Please upgrade for a smoother experience.
Submitted Successfully!
 +1 credit
Thank you for your contribution! You can also upload a video entry or images related to this topic.
For video creation, please contact our Academic Video Service.
| Version | Summary | Created by | Modification | Content Size | Created at | Operation |
|---|---|---|---|---|---|---|
| 1 | Manob Saikia | -- | 3610 | 2023-10-18 14:45:14 | | | |
| 2 | Lindsay Dong | + 5 word(s) | 3615 | 2023-10-20 02:51:50 | | |
Video Upload Options
We provide professional Academic Video Service to translate complex research into visually appealing presentations. Would you like to try it?
Cite
If you have any further questions, please contact Encyclopedia Editorial Office.
Flanagan, K.; Saikia, M.J. Wearable Neurofeedback Technologies. Encyclopedia. Available online: https://encyclopedia.pub/entry/50469 (accessed on 08 July 2026).
Flanagan K, Saikia MJ. Wearable Neurofeedback Technologies. Encyclopedia. Available at: https://encyclopedia.pub/entry/50469. Accessed July 08, 2026.
Flanagan, Kira, Manob Jyoti Saikia. "Wearable Neurofeedback Technologies" Encyclopedia, https://encyclopedia.pub/entry/50469 (accessed July 08, 2026).
Flanagan, K., & Saikia, M.J. (2023, October 18). Wearable Neurofeedback Technologies. In Encyclopedia. https://encyclopedia.pub/entry/50469
Flanagan, Kira and Manob Jyoti Saikia. "Wearable Neurofeedback Technologies." Encyclopedia. Web. 18 October, 2023.
Copy Citation
Neurofeedback, utilizing an electroencephalogram (EEG) and/or a functional near-infrared spectroscopy (fNIRS) device, is a real-time measurement of brain activity directed toward controlling and optimizing brain function. This treatment has often been attributed to improvements in disorders such as attention deficit hyperactivity disorder (ADHD), anxiety, depression, and epilepsy, among others.
neurofeedback
EEG
fNIRS
wellbeing
1. Introduction
Neurofeedback training began as a study of consciousness through the elicitation of alpha brain wave activities (associated with relaxation). Using a reward-based system, a study noted that subjects were able to increase their production of alpha amplitudes over time by correctly determining what brain wave stage they were in [1]. Neurofeedback is a form of self-regulation based on physiological variables that are modified by the individual that were previously thought to be involuntary. Significant interest in these noninvasive applications led to studies of the efficacy of neurofeedback training for epilepsy, attention deficit disorder, hyperactive disorder, and later, anxiety and mental wellness [2].
Advancements in the field of neuroscience have led to the proliferation of brain-mapping devices, including functional magnetic resonance imaging (fMRI), electroencephalography (EEG), functional near-infrared spectroscopy (fNIRS), and magnetoencephalography (MEG), in order to expand and deepen our understanding of the neural mechanisms underlying various psychological and neurological conditions. Neuroplasticity research has also provided new insights into the mechanisms that underlay neurofeedback training, such as showing the connectivity of the regions of the amygdala and hippocampus during training and how to improve neural synchrony [3].
Consumer neurofeedback devices are increasingly being used for mental health monitoring and treatment. These devices are based on electroencephalogram (EEG) and fNIRS technology. These devices are portable, affordable, and can be used outside of traditional clinical settings, making them more accessible to a wider range of clients. However, there are challenges to consider.
2. Wearable Neurofeedback Technologies
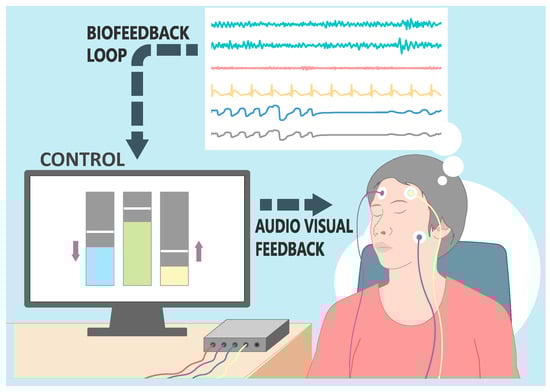
Figure 1 will serve as a visual summary of the components in a neurofeedback system, illustrating the interplay between data collection devices, signal processing algorithms, and the stimulus.
Figure 1. Illustration of a real-time biofeedback system. The image captures a female participant outfitted with an EEG head cap. Visible on the display are the dynamic brainwave patterns. These patterns are processed in real-time, with key oscillatory metrics extracted and fed into a control system. The control subsequently modulates audio–visual feedback being presented to the participant, establishing an interactive biofeedback loop.
2.1. EEG Consumer-Grade Devices
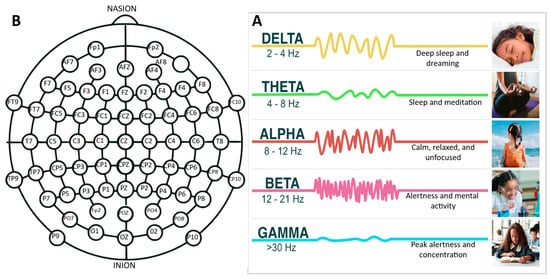
Electroencephalography (EEG) is a measurement of the brain’s voltage potentials from the postsynaptic activity of neurons and of the cortex via electrode arrays. In numerous studies, there are key parameters and categories that experts frequently emphasize, including aspects of sampling frequencies capabilities and signal processing functionalities that are tailored for specific research goals. Sampling frequency, a category that refers to how often the EEG records data within a second, is an important construct. A higher sampling frequency enables the capture of increasing high-frequency oscillations of the brain’s activity. EEG systems often incorporate specialized signal processing functionalities. These functions filter, refine, or amplify raw data to isolate specific brainwave patterns and phenomena, such as the K complex, which are distinctive waveforms often observed during sleep stages. Detecting and understanding such patterns is paramount in studies pertaining to sleep disorders or cognitive processes during rest. These signals can be used to generate an understanding of the correlation of the cognitive processes of attention [4][5], memory [6], language [7], and emotion [8][9][10][11][12]. The delineation between raw EEG data and the derivative insights obtained from Quantitative EEG (QEEG) is an important construct. While EEG affords a raw electrocortical snapshot, QEEG delves deeper, furnishing an analytical framework that underpins individualized neurofeedback therapeutic strategies. A key advantage of EEG is its high temporal resolution, where continuously monitored brain activity can be captured on the order of milliseconds [13]. A system with a sampling rate of 500 Hz records EEG data 500 times every second. This enables it to detect even fleeting changes in brain activity, essential for understanding rapid neural responses. For certain research and clinical scenarios, where precise timing and rapid responses are crucial, such as the detection of seizure onset in epilepsy, higher sampling frequencies become indispensable. Furthermore, when analyzing these signals, there are prominent characteristics that are isolated and examined for the determination of a cognitive or neurological state. For example, the K complex is a hallmark of non-REM (rapid eye movement) sleep and can indicate sleep quality and disturbances. EEG can focus on the oscillations of electrical activity that occur at different frequency bands, such as alpha waves, which occur at a frequency of around 8–12 Hz [14]. As shown in Figure 2B, these frequency bands are associated with particular brain activities and mental states. In addition to research, EEG has a variety of clinical applications [15], such as diagnoses and tracking of various neurological [16] and psychiatric conditions [17].
Figure 2. (A) A detailed schematic representation of electrode placements across the scalp, highlighting standardized locations. (B) An informative chart elucidating various EEG frequency bands—delta, theta, alpha, beta, and gamma—and their associated cognitive and physiological activities. This component serves to emphasize the distinct brain activities and states associated with each frequency range.
EEG devices offer several advantages over other brain imaging techniques, such as functional magnetic resonance imaging (fMRI) and positron emission tomography (PET), which involve ionizing radiation and contrast agents. Consumer-grade EEG devices are portable, user-friendly, and cost-effective compared to fMRI and PET technologies, making them suitable for various settings, including schools, home care, and field work.
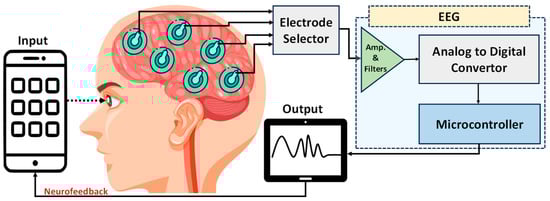
Consumer electroencephalographic devices commonly consist of a sensor array, an amplifier, and an interface for data acquisition and analysis, as shown in Figure 3. A biomedical sensor array is characterized by a group of sensors or electrodes laid in a geometric pattern, used for collecting electrical, electromagnetic, electrochemical, acoustic, optical signals, etc., from the human body. In the case of EEG, the accurate placement of the electrode over the scalp or cortex is important in order to obtain comprehensive and accurate measurements of brain electrical activity. The sensor arrays used in these devices can vary in terms of the number and placement of electrodes, as well as the types of additional sensors included. Fixed, flexible, multimodal, and wireless array types are commonly used. These arrays may be incorporated into lightweight, flexible caps made of materials such as silicone or neoprene or integrated into molded headset configurations.
Figure 3. Conceptual diagram of an EEG neurofeedback system. Electrodes placed on the scalp capture neural activity, which is amplified and filtered. These analog signals are converted to digital by an analog-to-digital converter, processed by a microcontroller, and then relayed back to a smartphone for real-time feedback. The design illustrates the closed-loop nature of contemporary EEG feedback systems.
In EEG, channels correspond to the specific electrical connections established between electrodes positioned on the scalp and other anatomical sites, as presented in Figure 2A. Each channel represents the electrical activity between two electrodes and can be used to detect and measure different aspects of brain activity [18]. The number and arrangement of channels in EEG devices may vary depending on the specific device and intended application. Some EEG systems may comprise a limited number of channels, while others can incorporate dozens or even hundreds of channels. Generally, a higher number of channels provides more comprehensive and accurate measurements of brain activity. Notably, consumer-grade EEG devices commonly employ reference electrodes, which serve as electrophysiological constant reference potentials for measuring electrical activity within brain tissue [19]. These reference electrodes enable a comparison of the voltage potentials across different electrode locations with respect to a common reference point, facilitating the acquisition of precise and reliable data.
EEG systems typically consist of sensor and electrode arrays that are applied to the scalp using a conductive gel or solution. These arrays can encompass a range of electrodes, with some systems accommodating up to 256 electrodes positioned around the head, as depicted in Figure 2A. However, commercial EEG products generally employ fewer electrodes, commonly adopting configurations such as the 10–20 system, with 19 or 21 electrodes, or the 10–10 system, with 64 or more electrodes spaced at shorter intervals [20][21][22][23]. Each channel of these systems corresponds to a specific region on the scalp, with electrodes placed accordingly and labeled to indicate their respective locations. It is important to note that not all channels on an EEG device are dedicated to measuring brain electrical activity; some are used for capturing additional physiological signals such as heart rate, electrooculogram (EOG), or muscle activity. For example, select channels can be tailored to record the electrooculogram (EOG), which measures eye movement and can be crucial for studies involving rapid eye movement during sleep or visual tracking tasks. Similarly, channels detecting heart rate can provide insights into the interplay between cognitive processes and cardiac responses, offering a holistic understanding of certain experimental conditions or clinical scenarios. Moreover, it should be acknowledged that the scalp regions shown in Figure 2A can exhibit considerable variation depending on the specific experimental or clinical parameters being considered.
Although consumer EEG devices hold promise for elucidating brain activity and mental states, it is crucial to recognize that these devices lack medical-grade certification and should not be employed for clinical diagnosis purposes unless subjected to rigorous validation and regulatory approvals. Moreover, careful interpretation of the collected data is warranted due to potential limitations in signal quality. Sampling rate problems can arise, impacting the accuracy of the captured signals, as consumer devices often operate at lower sampling rates compared to medical-grade EEG systems. This lower sampling rate may result in an incomplete representation of the underlying neural activity and may hinder the detection of rapid changes or high-frequency components. Furthermore, the noise levels inherent in consumer EEG devices can be significant, stemming from various sources such as suboptimal electrode placement, inadequate electrode–scalp contact, inherent device limitations, motion artifacts induced by user movement, and environmental noise [24]. These noise factors introduce distortions into the acquired signals, thereby diminishing the fidelity of the recorded data and potentially complicating the interpretation of neural activity patterns [25].
2.2. fNIRS Consumer-Grade Devices
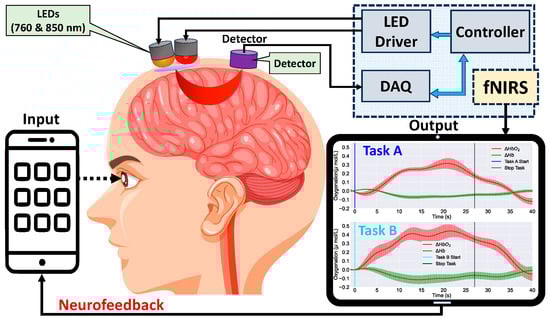
Functional near-infrared spectroscopy (fNIRS) is a non-invasive imaging application that utilizes optics and NIR light (e.g., 760 and 850 nm wavelengths) to penetrate the scalp and skull to reach brain tissue. When the emitted light reaches the brain, it is absorbed by the oxygenated and deoxygenated hemoglobin in the cortical area of the brain. The absorption ability depends on the oxygenated level of hemoglobin, which is a proxy for blood flow to the activated brain regions [26][27][28]. The detected light on the scalp using light detectors is then used to calculate the changes in blood oxygenation levels to determine neural activity [29][30]. Figure 4 presents the conceptual diagram of fNIRS. Similar to EEG, fNIRS also has several advantages over fMRI, PET, and MEG. It is less sensitive to motion artifacts, has a higher temporal resolution compared to fMRI, and is more portable and affordable [31][32][33]. fNIRS is increasingly being used in various applications, including cognitive neuroscience [34][35][36], sleep studies [37], clinical research, brain–computer interfaces, and neurofeedback [38][39].
Figure 4 . Conceptual diagram of an fNIRS neurofeedback system. Optodes positioned on the scalp emit and detect near-infrared light to measure cerebral blood flow changes. The acquired data are processed and digitized, then sent to a microcontroller, which in turn relays information back to a smartphone for real-time feedback. This representation underscores the closed-loop design of modern fNIRS feedback systems.
While fNIRS devices can be more common than other modalities, they are still costly and not as pervasive as EEG devices. However, fNIRS offers several advantages over electroencephalography (EEG) in neuroimaging. Firstly, fNIRS provides greater spatial resolution, allowing us to pinpoint brain activity with superior precision. Since fNIRS can detect changes in the oxygenated and deoxygenated hemoglobin concentrations within specific brain regions, it offers a more localized view of neural activity. Its lower susceptibility to movement artifacts also makes fNIRS suitable for studies requiring participants to be in naturalistic environments. A significant advantage of fNIRS is the absence of conductive gels and electrodes on the scalp, which minimizes setup times and improves participant comfort. The cost of fNIRS devices can range from a few thousand to tens of thousands of dollars depending on the type of device and its capabilities. This cost variation is influenced by several parameters such as the number of channels, types of detectors, and processing software capabilities that accompany the device. Institutions and research organizations must weigh these factors carefully against their budget constraints when considering an fNIRS device for purchase. For example, devices equipped with a larger array of channels to cover a broader area of the brain tend to be at a higher end of the price range. These high-channel configurations are often required for advanced neurological studies that need to capture a comprehensive set of data points from different brain regions. These types of devices all require proper training as well in order to interpret the data, often necessitating specialized expertise or even certified courses. This training not only encompasses how to operate the device but also delves into data analysis, ensuring that findings are accurate and not subject to common pitfalls or misinterpretations. Despite their growing popularity, fNIRS devices remain uncommon in comparison to the fMRI systems available in clinical settings and the EEG devices available for both clinical and commercial purposes. It is worth noting that fMRI and EEG technologies have a longer history, providing them with a more extensive user base and a wider range of applications. The longevity of these technologies has also resulted in a more extensive knowledge base, extensive troubleshooting insights, and a broader range of training resources. The technology still remains in the early stages of development, and this is paired with a smaller market [40].
However, even with the scarcity of commercial fNIRS devices, there is a growing number of companies that are manufacturing and selling these devices. These companies are spearheading the drive to bring fNIRS to both the research community and potentially the broader consumer market. Much like the wide range of EEG devices on the market, fNIRS devices can come with varying capabilities, different channels, multiple detectors, and differing spatial resolutions. This emerging marketplace indicates that fNIRS technology is maturing, suggesting that as competition grows and technology improves, there may be a drive towards more standardized, user-friendly, and potentially more affordable options in the future. A few companies to consider are Artinis, NIRx Medical Technologies, Mendi, and Obelab.
fNIRS devices have their own strengths and limitations to consider. These devices have a higher spatial resolution and the ability to localize activity to specific regions of the brain, positioning them as a powerful intermediary tool that blends some of the advantages of both fMRI and EEG devices. This means that while they may not offer the full spatial resolution of fMRI devices, they can give more detailed spatial information than EEG devices. fNIRS has proven to pick up activity in deeper regions [41]. This depth of penetration, while not as deep as fMRI, offers insights into the subcortical regions, providing valuable data that are not easily obtained with surface-level EEG electrodes. While the cost of the majority of fNIRS devices is lower, EEG equipment is commonly accepted and widely available due to its straightforward and well-established data analysis interfaces [42]. The EEG’s legacy in neuroimaging research and its simplistic yet effective functionality make it a staple in many labs. However, the increasing sophistication of fNIRS data-processing tools is starting to bridge this gap, making fNIRS a more accessible and appealing choice for a wider range of researchers. There is limited availability on the market, with the available consumer devices being relatively new and not widely available to consumers. However, they have several limitations, including their limited spatial resolution and signal contamination issues. As technology continues to develop, fNIRS may become a valuable tool for home and clinical usage.
2.3. Data Acquisation
Data acquisition refers to a process of collecting raw data from a specific source in a controlled and systematic procedure. In neuroscience research, data acquisition typically features specialized devices, such as EEG or fNIRS devices, that measure electrical and optical signals generated by the brain. There are several steps involved that include the placement of sensors to clean scalp and calibration to optimize the signal-to-noise ratio.
EEG devices are equipped with an array of electrodes that measure the differential amplification of thousands of postsynaptic potentials produced in the brain in microvolts (μV). The voltage fluctuations measured are diminutive and require a sensitive data acquisition (DAQ) system comprising an amplifier and analog-to-digital converter (ADC). The amplifier is designed to increase the signal amplitude by a factor of several thousand through a high-gain and low-noise amplifier circuit for detection and usable data. An important characteristic of EEG amplifiers is the input impedance, which is a measure of the opposition to current in a static and dynamic form to determine signal behavior. Scalp–electrode interfaces have a relatively high impedance, which requires a high input impedance at the amplifier to avoid the distortion and attenuation of signals. Noise performance is another important characteristic due to the nature of the microvolt signals being received to limit the introduction of additional noise [11][43][44][45]. This can be limited through the design of the circuit, noise isolation, and the quality of the components used. Another aspect of the DAQ system is the characteristics of the ADC, such as the bit resolution and sampling rate of the ADC, which also influence the quality of the EEG signal and the maximum frequency of the EEG signal. Therefore, through strategic attention to the design and optimization of the DAQ system, researchers can effectively address challenges related to signal quality in EEG recordings. By implementing noise isolation measures, utilizing high-quality components, and selecting suitable ADC characteristics, the recorded EEG data can exhibit improved accuracy, reliability, and the capability to capture signals across a wide frequency range.
2.4. Signal Pre-Processing
Both EEG and fNIRS are susceptible to various types of noise and artifacts, including muscle activity, eye movements, environmental noise, electrode artifacts, and signal penetration. As an example, muscle activity can introduce high-frequency noise in EEG data, while motion artifacts are a common issue in fNIRS, often necessitating specialized techniques for each modality.
Preprocessing techniques are used to minimize the impact of noise to the enhance signals of interest in EEG and fNIRS devices. The overarching aim here is to obtain a signal that accurately represents the neural or hemodynamic activity under study, isolating it from non-neural factors that could compromise the integrity of the data. Common preprocessing techniques for these devices include filtering, artifact removal, re-referencing, epoching, baseline correction, and types of Fourier transforms. The choice among these techniques often hinges on the specific goal of the analysis; studies focusing on event-related potentials in EEG might prioritize epoching and baseline correction, whereas fNIRS studies looking at sustained cognitive activity might employ sophisticated filtering techniques. Filtering involves the attenuation of specific frequency ranges from the signal. This is particularly important when investigating phenomena that are known to occur at specific frequencies, such as alpha waves in EEG or the slower oscillations related to hemodynamic responses in fNIRS. High-pass filters can be used to remove low-frequency noises such as Mayer waves and slow drift, while a low-pass filter can be used to remove high-frequency noises such as the removal of sudden physiological movements from fNIRS signals [46]. For EEG, high-pass filters are often critical when the aim is to study fast neural oscillations, such as gamma waves. For fNIRS, removing high-frequency noise can be crucial when the focus is on slower hemodynamic changes. Another common noise, 50/60 Hz line noise, is often removed using a notch filter in the case of EEG. This is universally important for any EEG study because electrical noise from the environment can profoundly skew the data. This is less of a concern for fNIRS data, which typically focus on slower oscillations that are far removed from the frequencies of electrical noise. There are additional techniques involved in cleaning this raw data, such as a Principal Component Analysis (PCA), which is designed to eliminate artifacts from EEG data [47]. PCA can be particularly effective when the goal is to separate multiple sources of neural activity or to distinguish neural signals from noise. It operates by transforming the original variables into a new set of variables, the principal components, which are orthogonal (uncorrelated) and reflect the maximum variance. Epoching refers to the segmentation of the continuous EEG signal into shorter segments known as epochs to isolate and analyze specific events. This is often essential in studies that are event-related, such as those investigating responses to stimuli, where the neural activity of interest occurs within a brief time window following the stimulus. A baseline correction is the removal of the average activity during a baseline session from each time interval in the signal in order to remove issues of drift. This is useful in both EEG and fNIRS when you want to normalize the signals to a reference point, making it easier to compare activity across different time points or conditions. A wavelet transform (WT) is a time-frequency mathematical analysis that breaks a signal into its constituent wavelets at different frequencies. Wavelet transforms are beneficial when the frequency content of a signal changes over time, as they can provide information on both the frequency and the time at which specific frequencies are present. This is highly valuable for analyzing non-stationary signals such as human EEG or fNIRS data. A small, oscillating signal is used to analyze a much larger signal via discrete or continuous functions [48][49]. While this format is an improvement to the Fourier transform, it has a sensitivity to noise, making it difficult to extract meaningful information without redundancy. The wavelet transform is often used in EEG for identifying changes in oscillatory activity over time, such as during sleep stages, or in fNIRS when studying rapid changes in oxygenation levels during cognitive tasks.
References
- Nowlis, D.P.; Kamiya, J. The Control of Electroencephalographic Alpha Rhythms through Auditory Feedback and The Associated Mental Activity. Psychophysiology 1970, 6, 476–484.
- Whitehead, J.C.; Neeman, R.; Doniger, G.M. Preliminary Real-World Evidence Supporting the Efficacy of a Remote Neurofeedback System in Improving Mental Health: Retrospective Single-Group Pretest-Posttest Study. JMIR Form. Res. 2022, 6, e35636.
- Quevedo, K.; Liu, G.; Teoh, J.Y.; Ghosh, S.; Zeffiro, T.; Ahrweiler, N.; Zhang, N.; Wedan, R.; Oh, S.; Guercio, G.; et al. Neurofeedback and neuroplasticity of visual self-processing in depressed and healthy adolescents: A preliminary study. Dev. Cogn. Neurosci. 2019, 40, 100707.
- Chen, C.; Chang, C.L.; Chang, M.H.; Ko, L.W. Atypical functional connectivity during rest and task-related dynamic alteration in young children with attention deficit hyperactivity disorder: An analysis using the phase-locking value. Psychiatry Clin. Neurosci. 2022, 76, 235–245.
- Chang, D.; Xiang, Y.; Zhao, J.; Qian, Y.; Li, F. Exploration of Brain-Computer Interaction for Supporting Children’s Attention Training: A Multimodal Design Based on Attention Network and Gamification Design. Int. J. Environ. Res. Public Health 2022, 19, 15046.
- Luján, M.Á.; Jimeno, M.V.; Sotos, J.M.; Ricarte, J.J.; Borja, A.L. A Survey on EEG Signal Processing Techniques and Machine Learning: Applications to the Neurofeedback of Autobiographical Memory Deficits in Schizophrenia. Electronics 2021, 10, 3037.
- Lum, J.A.G.; Clark, G.M.; Bigelow, F.J.; Enticott, P.G. Resting state electroencephalography (EEG) correlates with children’s language skills: Evidence from sentence repetition. Brain. Lang. 2022, 230, 105137.
- Moontaha, S.; Schumann, F.E.F.; Arnrich, B. Online Learning for Wearable EEG-Based Emotion Classification. Sensors 2023, 23, 2387.
- Sarma, P.; Barma, S. Emotion Recognition by Discriminating EEG Segments with High Affective Content from Automatically Selected Relevant Channels. IEEE Trans. Instrum. Meas. 2022, 71, 4000812.
- Chen, J.X.; Zhang, P.W.; Mao, Z.J.; Huang, Y.F.; Jiang, D.M.; Zhang, Y.N. Accurate EEG-Based Emotion Recognition on Combined Features Using Deep Convolutional Neural Networks. IEEE Access 2019, 7, 44317–44328.
- Sawangjai, P.; Hompoonsup, S.; Leelaarporn, P.; Kongwudhikunakorn, S.; Wilaiprasitporn, T. Consumer Grade EEG Measuring Sensors as Research Tools: A Review. IEEE Sens. J. 2020, 20, 3996–4024.
- Xie, Z.; Pan, J.; Li, S.; Ren, J.; Qian, S.; Ye, Y.; Bao, W. Musical Emotions Recognition Using Entropy Features and Channel Optimization Based on EEG. Entropy 2022, 24, 1735.
- Gevins, A.; Smith, M.E.; McEvoy, L.K.; Leong, H.; Le, J. Electroencephalographic imaging of higher brain function. Philos. Trans. R. Soc. Lond. B Biol. Sci. 1999, 354, 1125–1134.
- Marzbani, H.; Marateb, H.R.; Mansourian, M. Neurofeedback: A Comprehensive Review on System Design, Methodology and Clinical Applications. Basic Clin. Neurosci. 2016, 7, 143.
- Ratti, E.; Waninger, S.; Berka, C.; Ruffini, G.; Verma, A. Comparison of medical and consumer wireless EEG systems for use in clinical trials. Front. Hum. Neurosci. 2017, 11, 398.
- Alvi, M.; Siuly, S.; Wang, H. Neurological abnormality detection from electroencephalography data: A review. Artif. Intell. Rev. 2022, 55, 2275–2312.
- Newson, J.J.; Thiagarajan, T.C. EEG Frequency Bands in Psychiatric Disorders: A Review of Resting State Studies. Front. Hum. Neurosci. 2019, 12, 423390.
- Sur, S.; Sinha, V.K. Event-related potential: An overview. Ind. Psychiatry J. 2009, 18, 70.
- Moore, B.A.; Barnett, J.E. Niedermeyer’s Electroencephalography: Basic Principles, Clinical Applications, and Related Fields. In Case Studies in Clinical Psychological Science: Bridging the Gap from Science to Practice; Oxford University Press: New York, NY, USA, 2017; pp. 1–7.
- Scrivener, C.L.; Reader, A.T. Variability of EEG electrode positions and their underlying brain regions: Visualizing gel artifacts from a simultaneous EEG-fMRI dataset. Brain Behav. 2022, 12, e2476.
- Klem, G.; Lüders, H.; Jasper, H.; Elger, C. The ten-twenty electrode system of the International Federation. The International Federation of Clinical Neurophysiology. Electroencephalogr. Clin. Neurophysiol. Suppl. 1999, 52, 3–6.
- Giacometti, P.; Perdue, K.L.; Diamond, S.G. Algorithm to find high density EEG scalp coordinates and analysis of their correspondence to structural and functional regions of the brain. J. Neurosci. Methods 2014, 229, 84–96.
- Hill, N.J.; Gupta, D.; Brunner, P.; Gunduz, A.; Adamo, M.A.; Ritaccio, A.; Schalk, G. Recording human electrocorticographic (ECoG) signals for neuroscientific research and real-time functional cortical mapping. J. Vis. Exp. 2012, 26, 3993.
- Peterson, V.; Galván, C.; Hernández, H.; Spies, R. A feasibility study of a complete low-cost consumer-grade brain-computer interface system. Heliyon 2020, 6, 3425.
- Domingos, C.; Marôco, J.L.; Miranda, M.; Silva, C.; Melo, X.; Borrego, C. Repeatability of Brain Activity as Measured by a 32-Channel EEG System during Resistance Exercise in Healthy Young Adults. Int. J. Environ. Res. Public Health 2023, 20, 1992.
- Saikia, M.J.; Besio, W.G.; Mankodiya, K. WearLight: Toward a Wearable, Configurable Functional NIR Spectroscopy System for Noninvasive Neuroimaging. IEEE Trans. Biomed. Circuits Syst. 2019, 13, 91–102.
- Tsow, F.; Kumar, A.; Hosseini, S.H.; Bowden, A. A low-cost, wearable, do-it-yourself functional near-infrared spectroscopy (DIY-fNIRS) headband. HardwareX 2021, 10, e00204.
- Hong, F.W.; Chia, K.S. A review on recent near infrared spectroscopic measurement setups and their challenges. Measurement 2021, 171, 108732.
- Logothetis, N.K.; Pauls, J.; Augath, M.; Trinath, T.; Oeltermann, A. Neurophysiological investigation of the basis of the fMRI signal. Nature 2001, 412, 150–157.
- Rahman, M.A.; Siddik, A.B.; Ghosh, T.K.; Khanam, F.; Ahmad, M. A Narrative Review on Clinical Applications of fNIRS. J. Digit. Imaging 2020, 33, 1167–1184.
- Boas, D.A.; Elwell, C.E.; Ferrari, M.; Taga, G. Twenty years of functional near-infrared spectroscopy: Introduction for the special issue. Neuroimage 2014, 85, 1–5.
- Li, M.; Gong, A.; Nan, W.; Xu, B.; Ding, P.; Fu, Y. Neurofeedback technology based on functional near infrared spectroscopy imaging and its applications. Sheng Wu Yi Xue Gong Cheng Xue Za Zhi 2022, 39, 1041–1049.
- Ferrari, M.; Quaresima, V. A brief review on the history of human functional near-infrared spectroscopy (fNIRS) development and fields of application. Neuroimage 2012, 63, 921–935.
- Stangl, M.; Maoz, S.L.; Suthana, N. Mobile cognition: Imaging the human brain in the ‘real world’. Nat. Rev. Neurosci. 2023, 24, 347–362.
- Saikia, M.J. K-means Clustering Machine Learning Approach Reveals Groups of Homogeneous Individuals with Unique Brain Activation, Task, and Performance Dynamics using fNIRS. IEEE Trans. Neural Syst. Rehabil. Eng. 2023, 31, 2535–2544.
- Saikia, M.J. Internet of things-based functional near-infrared spectroscopy headband for mental workload assessment. In Optical Techniques in Neurosurgery, Neurophotonics, and Optogenetics; SPIE: Bellingham, DC, USA, 2021; Volume 11629, pp. 149–156.
- Huang, X.; Tang, J.; Luo, J.; Shu, F.; Chen, C.; Chen, W. A Wearable Functional Near-Infrared Spectroscopy (fNIRS) System for Obstructive Sleep Apnea Assessment. IEEE Trans. Neural Syst. Rehabil. Eng. 2023, 31, 1837–1846.
- Mihara, M.; Miyai, I.; Hattori, N.; Hatakenaka, M.; Yagura, H.; Kawano, T.; Okibayashi, M.; Danjo, N.; Ishikawa, A.; Inoue, Y.; et al. Neurofeedback Using Real-Time Near-Infrared Spectroscopy Enhances Motor Imagery Related Cortical Activation. PLoS ONE 2012, 7, e32234.
- Torricelli, A.; Contini, D.; Pifferi, A.; Caffini, M.; Re, R.; Zucchelli, L.; Spinelli, L. Time domain functional NIRS imaging for human brain mapping. Neuroimage 2014, 85 Pt 1, 28–50.
- Doherty, E.J.; Spencer, C.A.; Burnison, J.; Čeko, M.; Chin, J.; Eloy, L.; Haring, K.; Kim, P.; Pittman, D.; Powers, S.; et al. Interdisciplinary views of fNIRS: Current advancements, equity challenges, and an agenda for future needs of a diverse fNIRS research community. Front. Integr. Neurosci. 2023, 17, 1059679.
- Irani, F.; Platek, S.M.; Bunce, S.; Ruocco, A.C.; Chute, D. Functional near infrared spectroscopy (fNIRS): An emerging neuroimaging technology with important applications for the study of brain disorders. Clin. Neuropsychol. 2007, 21, 9–37.
- Maskeliunas, R.; Damasevicius, R.; Martisius, I.; Vasiljevas, M. Consumer-grade EEG devices: Are they usable for control tasks? PeerJ 2016, 2016, e1746.
- Puce, A.; Hämäläinen, M.S. A Review of Issues Related to Data Acquisition and Analysis in EEG/MEG Studies. Brain Sci. 2017, 7, 58.
- Herrmann, S.; Strüber, D.; Helfrich, R.F.; Engel, A.K. EEG oscillations: From correlation to causality. Int. J. Psychophysiol. 2016, 103, 12–21.
- Radüntz, T. Signal quality evaluation of emerging EEG devices. Front. Physiol. 2018, 9, 98.
- Saikia, M.J.; Besio, W.G.; Mankodiya, K. The Validation of a Portable Functional NIRS System for Assessing Mental Workload. Sensors 2021, 21, 3810.
- Chakrabarty, S.; Levkowitz, H. A New Index for Measuring Inconsistencies in Independent Component Analysis Using Multi-sensor Data. Coop. Des. Vis. Eng. 2019, 11792, 98.
- Huang, Z.; Wang, M. A review of electroencephalogram signal processing methods for brain-controlled robots. Cogn. Robot. 2021, 1, 111–124.
- Adeli, H.; Zhou, Z.; Dadmehr, N. Analysis of EEG records in an epileptic patient using wavelet transform. J. Neurosci. Methods 2003, 123, 69–87.
More
Information
Subjects:
Engineering, Biomedical
Contributors
MDPI registered users' name will be linked to their SciProfiles pages. To register with us, please refer to https://encyclopedia.pub/register
:
View Times:
1.8K
Revisions:
2 times
(View History)
Update Date:
20 Oct 2023
Table of Contents


Notice
You are not a member of the advisory board for this topic. If you want to update advisory board member profile, please contact office@encyclopedia.pub.
OK
Confirm
Only members of the Encyclopedia advisory board for this topic are allowed to note entries. Would you like to become an advisory board member of the Encyclopedia?
Yes
No
${ textCharacter }/${ maxCharacter }
Submit
Cancel
Back
Comments
${ item }
|
${ item.createdUser.fullName }
${ item.createdAt }
${ item.vote }
${ item.reply }
Delete
${ reply.createdUser.fullName }
${ reply.createdAt }
${ reply.vote }
Delete
There is no reply to this comment~
${ item.replyTextCharacter }/${ item.replyMaxCharacter }
Submit
Cancel
More
No more~
There is no comment~
${ textCharacter }/${ maxCharacter }
Submit
Cancel
${ selectedItem.replyTextCharacter }/${ selectedItem.replyMaxCharacter }
Submit
Cancel
Confirm
Are you sure to Delete?
Yes
No