Your browser does not fully support modern features. Please upgrade for a smoother experience.
Submitted Successfully!
 +1 credit
Thank you for your contribution! You can also upload a video entry or images related to this topic.
For video creation, please contact our Academic Video Service.
| Version | Summary | Created by | Modification | Content Size | Created at | Operation |
|---|---|---|---|---|---|---|
| 1 | Santiago Felici-Castell | -- | 1032 | 2023-10-16 12:55:46 | | | |
| 2 | Rita Xu | -7 word(s) | 1025 | 2023-10-17 03:15:42 | | |
Video Upload Options
We provide professional Academic Video Service to translate complex research into visually appealing presentations. Would you like to try it?
Cite
If you have any further questions, please contact Encyclopedia Editorial Office.
Felici-Castell, S.; Fernandez-Vargas, E.; Segura-Garcia, J.; Perez-Solano, J.J.; Fayos-Jordan, R.; Lopez-Ballester, J. Accurate Estimation of Air Pollution in Outdoor Routes. Encyclopedia. Available online: https://encyclopedia.pub/entry/50349 (accessed on 25 June 2026).
Felici-Castell S, Fernandez-Vargas E, Segura-Garcia J, Perez-Solano JJ, Fayos-Jordan R, Lopez-Ballester J. Accurate Estimation of Air Pollution in Outdoor Routes. Encyclopedia. Available at: https://encyclopedia.pub/entry/50349. Accessed June 25, 2026.
Felici-Castell, Santiago, Emilio Fernandez-Vargas, Jaume Segura-Garcia, Juan J. Perez-Solano, Rafael Fayos-Jordan, Jesus Lopez-Ballester. "Accurate Estimation of Air Pollution in Outdoor Routes" Encyclopedia, https://encyclopedia.pub/entry/50349 (accessed June 25, 2026).
Felici-Castell, S., Fernandez-Vargas, E., Segura-Garcia, J., Perez-Solano, J.J., Fayos-Jordan, R., & Lopez-Ballester, J. (2023, October 16). Accurate Estimation of Air Pollution in Outdoor Routes. In Encyclopedia. https://encyclopedia.pub/entry/50349
Felici-Castell, Santiago, et al. "Accurate Estimation of Air Pollution in Outdoor Routes." Encyclopedia. Web. 16 October, 2023.
Copy Citation
There is clear evidence of the effects of air pollution on health. The aim is to provide this information to citizens based on their health profile (medical history or requirements) before and during outdoor trips of their choice, both walking and cycling, empowering them to proactively make informed personal decisions about their route choices and identifying potentially unhealthy travel environments.
air quality
pollution
official AQ monitoring stations
1. Introduction
According to the World Health Organization (WHO), approximately 90% of the global population is exposed to air containing elevated pollutant concentrations. Recent assessments underscore a distressing fatality count of 7 million individuals annually due to the effects of outdoor and indoor air pollution [1]. People die and suffer many illnesses from exposure to poor air quality (AQ), due to pollutants such as particulate matter (PM2.5 and PM10), carbon monoxide (CO), ozone (O3), nitrogen dioxide (NO2), and sulfur dioxide (SO2) to name a few, mainly due to the burning of fossil fuels. Moreover, of significant concern for public health, 96% of the urban population is exposed to pollution levels surpassing the WHO AQ Guideline (AQG) [2] and in many large cities by more than five times.
It is crucial to emphasise that exposure to elevated levels of fine particulate matter and nitrogen dioxide surpassing the WHO’s recommendations resulted in an estimated 238,000 and 49,000 premature deaths, respectively, in 2020 [3]. These pollutants have been associated with asthma, heart disease, and stroke. Additionally, chronic exposure to fine particulate matter accounted for 275,000 premature deaths in Europe in 2020, while chronic nitrogen dioxide exposure was responsible for 64,000 deaths, and acute ozone exposure contributed to 28,000 deaths [4].
There is a growing recognition and active involvement of local governments and authorities in addressing the concerns surrounding air pollution. They are implementing control and supervision plans, striving to mitigate the harmful effects. This global public health challenge has sparked an accelerated political interest, reflecting a heightened commitment to tackle the issue [1][5]. The notable increase in the number of cities monitoring air pollution data indicates a growing emphasis on assessing and monitoring air quality.
In Europe, air pollution emissions have declined in the last two decades. Despite this positive trend, air pollution remains the most important environmental health risk in this region. The Directive 2008/50/EC of 21 May 2008 on ambient AQ and cleaner air for Europe is one of these AQ measures. According to this directive, the number of sampling points in each zone or agglomeration should be at least one sampling point per 2 million inhabitants or one sampling point per 50,000 km2, where the latter criterion results in a higher number of sampling points, but not less than one sampling point per zone or agglomeration. For instance, Valencia city (Spain) is an example where these networks are deployed, with a set of AQ official monitoring stations for polluting gases (the network of stations of the Generalitat Valenciana [6]) and the stations deployed in the city of Valencia incorporated into open data, also known as Valencia minute by minute [7]. Figure 1 shows some of these AQ monitoring stations in different cities, such as Burjassot city (SP), Glasgow city (UK), and Valencia city (SP).
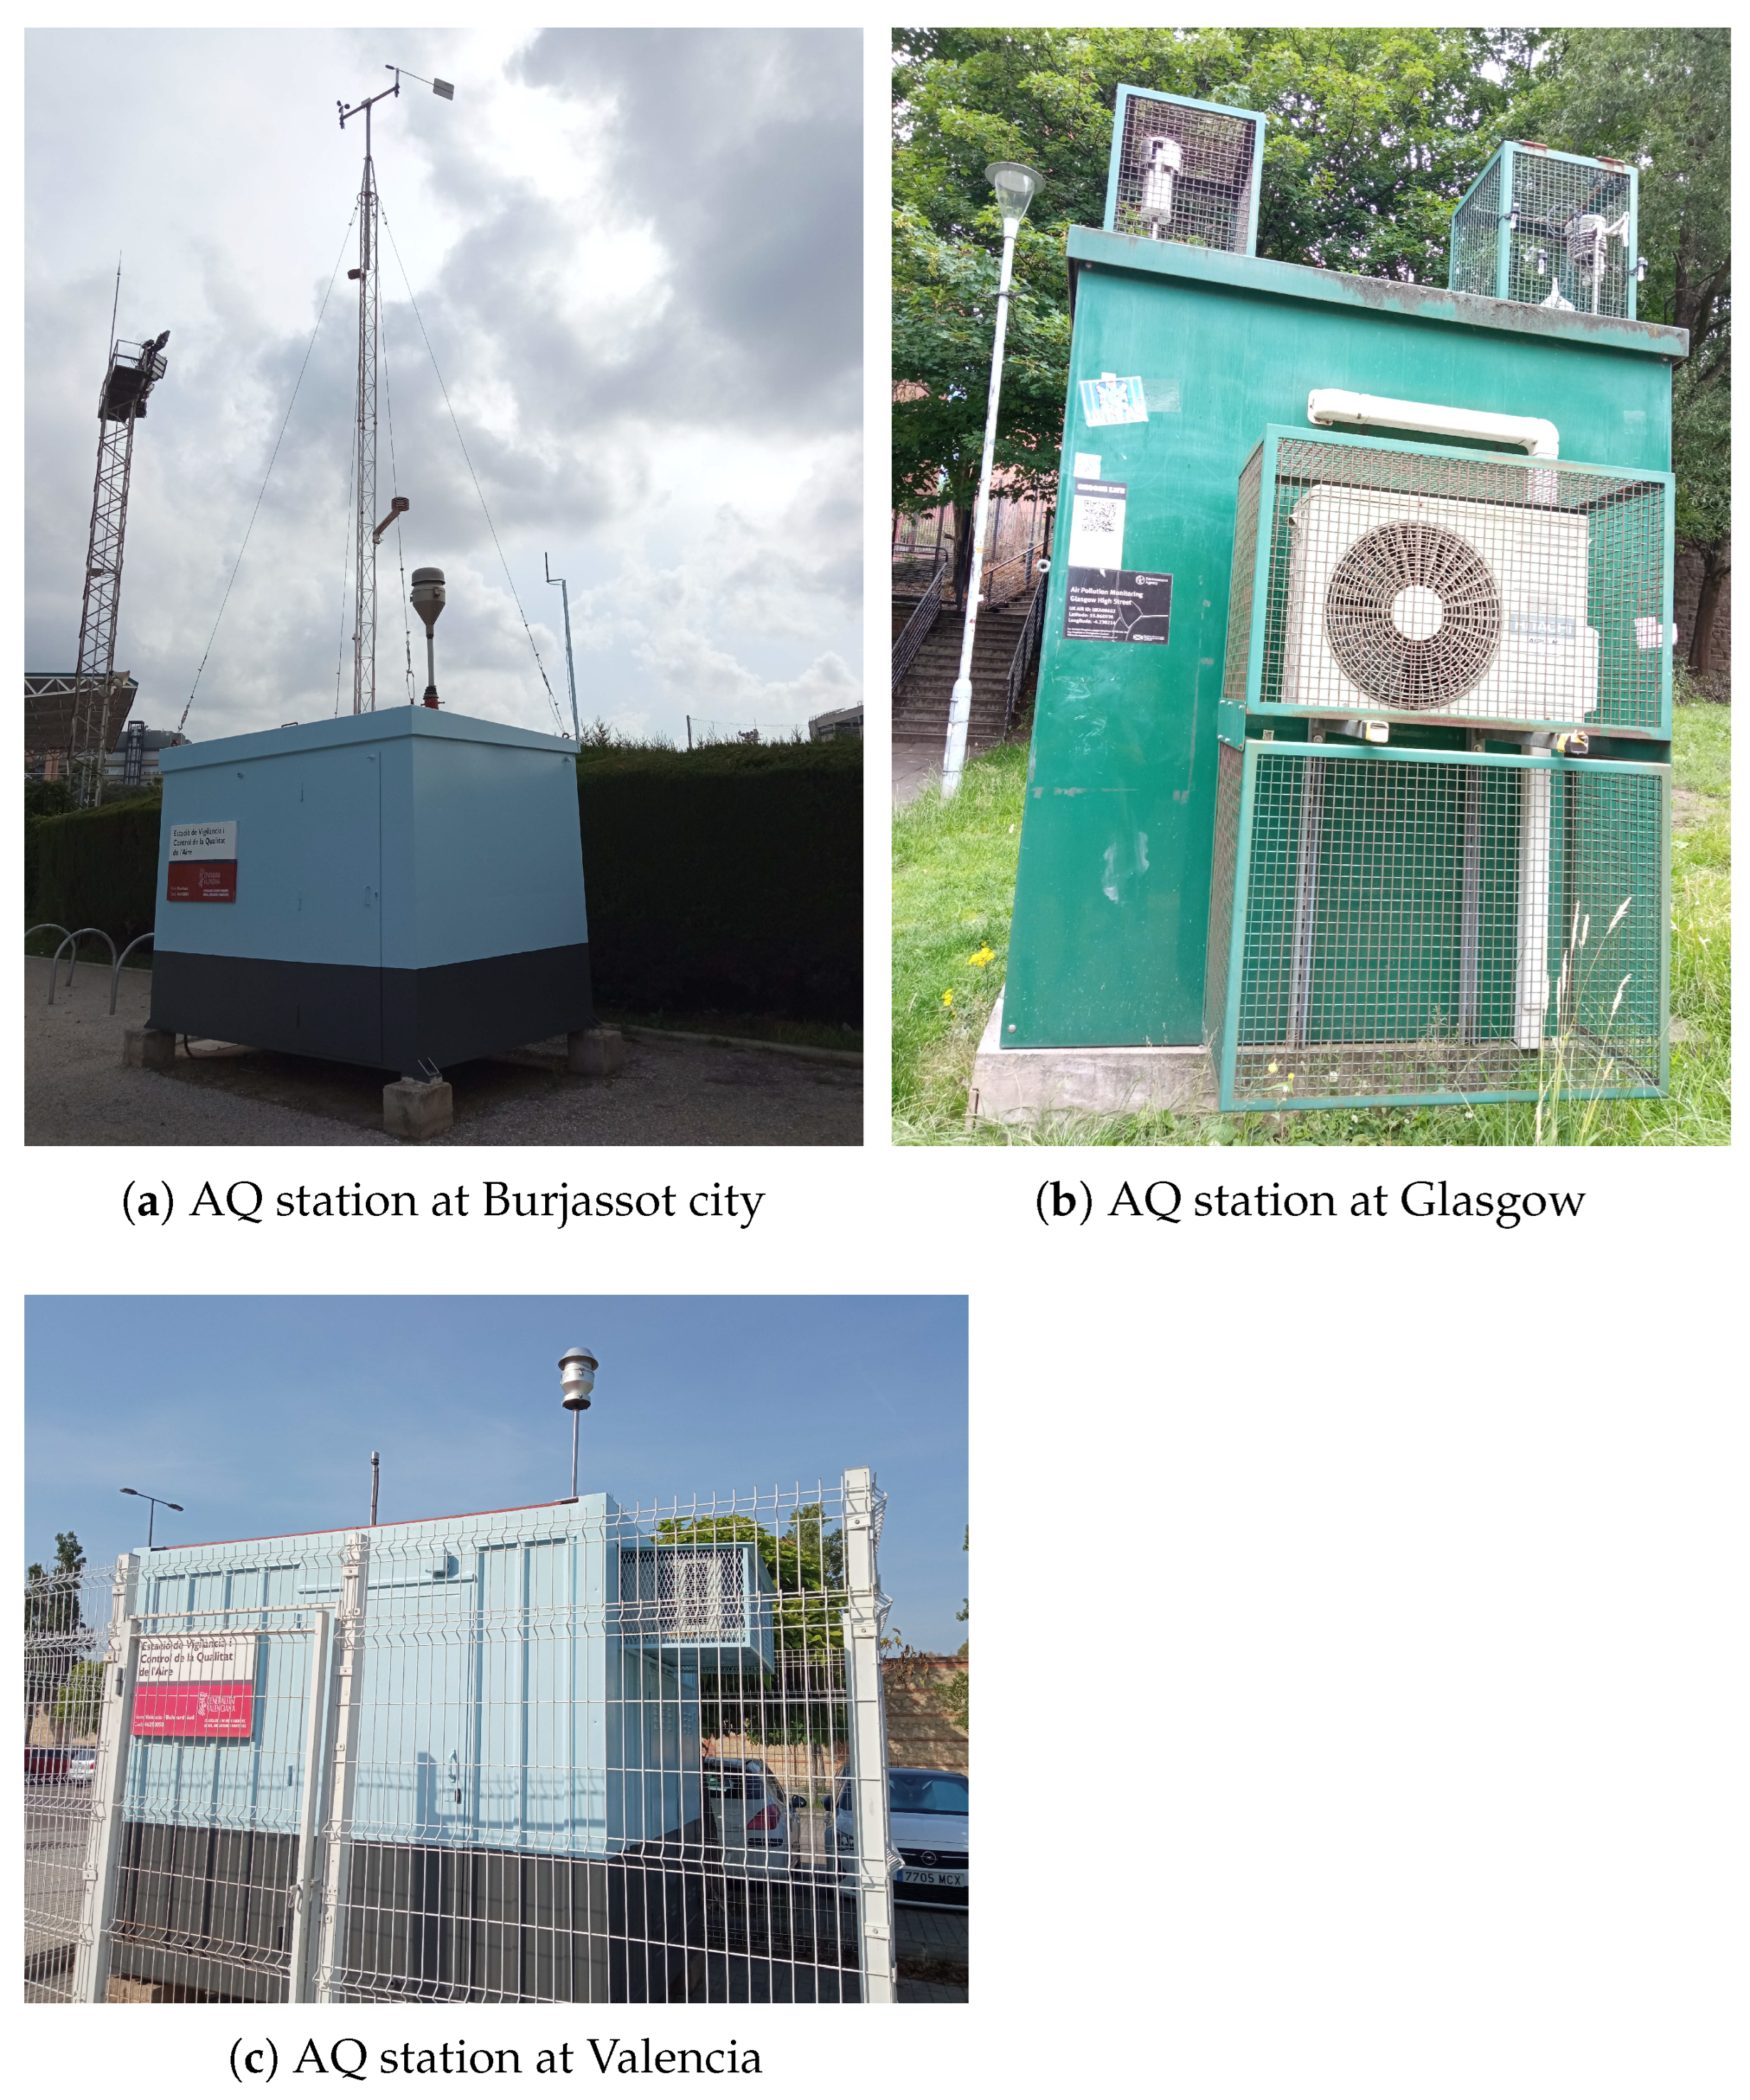
Figure 1. Example of AQ monitoring stations at (a): Burjassot city (Spain), (b): Glasgow city (United Kingdom), and (c): Valencia city (Spain).
2. Accurate Estimation of Air Pollution in Outdoor Routes
Citizens’ route choice decisions are often about minimising travel time, although in many situations, the risk of illness causes citizens to apply other criteria, such as reducing air pollution, particularly when the citizen suffers from respiratory diseases or allergies. In a study by [8], it was found that cyclists could opt for alternative routes with approximately 20% less exposure to pollution (given by nitrogen and carbon oxides) compared to shorter routes in a Danish city. Similarly, in [9] it is demonstrated that pedestrians in California could reduce PM2.5 exposure, around 40%, by choosing appropriate routes. Additionally, in [10] a web application for cyclists is shown which can help to find alternative routes with 4% less pollution. Furthermore, numerous previous studies examining exposure at the route level, such as [11], have consistently demonstrated that different routes within cities exhibit different levels of air pollution.
From a different point of view, regarding the trade-off between emissions and exposure to pollution, in [12], the feasibility of utilising emission and exposure metrics as benchmarks for assessing real-world policy is considered. The authors propose, based on the type of vehicle used, air pollution tolls given by time, taking into account the emission costs. However, the specific trade-off between the impact of exposure as a factor in route choice has not been extensively evaluated. In this line, in [13], an application is presented that does not systematically reduce travel distance or travel time, when CO2 emissions are considered as a vehicle cost factor.
In [14], the authors present a population-based assessment, carried out in Helsinki (Finland), of multiple environmental exposures for active commuting, allowing urban-scale exposure analyses to inform exposure levels. It highlights that cyclists have more noise exposure and pollution, which exceed healthy thresholds. In [15], the authors show a summary of different studies focusing on main air pollutants and their impact on cyclists. In [16] is detailed the Green Paths software (v.1), an open-source routing method (based on shortest path algorithm) and exposure assessment tool for a route planner for Helsinki which takes into account exposure metrics given by air quality, noise, and greenery. This software uses OpenStreetMap, both with walking and cycling street network maps, with pre-calculated exposure cost attributes assigned to the network edges.
In addition, it is worth mentioning several commercial platforms that offer you AQ information in your route, such as AirNow [17], BreezoMeter [18], and PlumeLabs [19]. Their use can be beneficial although they are not open-source. Airnow provides only AQ at the source and destination, and is constrained to North America and limited to specific roads, considering only O3 and PM as pollutants. BreezoMeter shows AQ index (AQI) only at the monitoring spots and is limited to specific roads. Finally, PlumeLabs analyses the AQ in your location. The information provided by these platforms is constrained to the source or destination, as well as the locations with monitoring systems, but it does not include information for your whole route. The information that these platforms report is simpler than the researchers' approach.
References
- Osseiran, N.; Lindmeier, C. 9 out of 10 People Worldwide Breathe Polluted Air, but More Countries are Taking Action. 2023. Available online: https://www.who.int/news/item/02-05-2018-9-out-of-10-people-worldwide-breathe-polluted-air-but-more-countries-are-taking-action (accessed on 27 February 2023).
- WHO Agency. WHO Global Air Quality Guidelines. 2023. Available online: https://apps.who.int/iris/bitstream/handle/10665/345329/9789240034228-eng.pdf (accessed on 15 March 2023).
- European Economic Area Agency. Health Impacts of Air Pollution in Europe, 2022. 2023. Available online: https://www.eea.europa.eu/en/topics/in-depth/air-pollution (accessed on 27 February 2023).
- WHO Organization. Global Air Quality Guidelines: Particulate Matter (PM2.5 and PM10), Ozone, Nitrogen Dioxide, Sulfur Dioxide and Carbon Monoxide; World Health Organization: Geneva, Switzerland, 2021.
- WHO Agency. Air Quality and Health. 2023. Available online: https://www.who.int/teams/environment-climate-change-and-health/air-quality-and-health/health-impacts/types-of-pollutants (accessed on 27 March 2023).
- Conselleria d’Agricultura, Desenvolupament Rural, Emergència Climàtica i Transició Ecològica. Red Valenciana de Vigilancia y Control de la Contaminación Atmosférica. 2023. Available online: https://agroambient.gva.es/va/web/calidad-ambiental/datos-on-line (accessed on 27 May 2023).
- Ajuntament de Valencia, Minut a Minut. Estaciones Contaminación Atmosféricas. 2023. Available online: https://valencia.opendatasoft.com/explore/dataset/estacions-contaminacio-atmosferiques-estaciones-contaminacion-atmosfericas/table/ (accessed on 21 May 2023).
- Hertel, O.; Hvidberg, M.; Ketzel, M.; Storm, L.; Stausgaard, L. A proper choice of route significantly reduces air pollution exposure—A study on bicycle and bus trips in urban streets. Sci. Total Environ. 2008, 389, 58–70.
- Luo, J.; Boriboonsomsin, K.; Barth, M. Potential for Reducing Pedestrian’s Exposure to Traffic-Related Air Pollution through Route Choice Decision. J. Transp. Health 2016, 3, S55.
- Hatzopoulou, M.; Weichenthal, S.; Barreau, G.; Goldberg, M.; Farrell, W.; Crouse, D.; Ross, N. A web-based route planning tool to reduce cyclists’ exposures to traffic pollution: A case study in Montreal, Canada. Environ. Res. 2013, 123, 58–61.
- McNabola, A.; Broderick, B.; Gill, L. Relative exposure to fine particulate matter and VOCs between transport microenvironments in Dublin: Personal exposure and uptake. Atmos. Environ. 2008, 42, 6496–6512.
- Kickhöfer, B.; Kern, J. Pricing local emission exposure of road traffic: An agent-based approach. Transp. Res. Part D Transp. Environ. 2015, 37, 14–28.
- Ahn, K.; Rakha, H.A.; Moran, K. System-wide Impacts of Eco-routing Strategies on Large -scale Networks. In Proceedings of the Transportation Research Board Annual Meeting, Washington, DC, USA, 22–26 January 2012.
- Willberg, E.; Poom, A.; Helle, J.; Toivonen, T. Cyclists’ exposure to air pollution, noise, and greenery: A population-level spatial analysis approach. Transp. Res. Part D Transp. Environ. 2023, 22, 5.
- Gelb, J.; Apparicio, P. Cyclists’ exposure to atmospheric and noise pollution: A systematic literature review. Transp. Rev. 2021, 41, 742–765.
- Helle, J.; Poom, A.; Willberg, E.S.; Toivonen, T. The Green Paths Route Planning Software for Exposure-Optimised Travel. 2021. Available online: https://osf.io/vxcp3/download (accessed on 27 July 2023).
- Airnow. Available online: https://www.airnow.gov/ (accessed on 7 May 2023).
- BreezoMeter. Available online: https://www.breezometer.com/ (accessed on 7 May 2023).
- PlumeLabs. Available online: https://plumelabs.com/en/ (accessed on 7 May 2023).
More
Information
Contributors
MDPI registered users' name will be linked to their SciProfiles pages. To register with us, please refer to https://encyclopedia.pub/register
:
View Times:
603
Revisions:
2 times
(View History)
Update Date:
17 Oct 2023
Table of Contents


Notice
You are not a member of the advisory board for this topic. If you want to update advisory board member profile, please contact office@encyclopedia.pub.
OK
Confirm
Only members of the Encyclopedia advisory board for this topic are allowed to note entries. Would you like to become an advisory board member of the Encyclopedia?
Yes
No
${ textCharacter }/${ maxCharacter }
Submit
Cancel
Back
Comments
${ item }
|
${ item.createdUser.fullName }
${ item.createdAt }
${ item.vote }
${ item.reply }
Delete
${ reply.createdUser.fullName }
${ reply.createdAt }
${ reply.vote }
Delete
There is no reply to this comment~
${ item.replyTextCharacter }/${ item.replyMaxCharacter }
Submit
Cancel
More
No more~
There is no comment~
${ textCharacter }/${ maxCharacter }
Submit
Cancel
${ selectedItem.replyTextCharacter }/${ selectedItem.replyMaxCharacter }
Submit
Cancel
Confirm
Are you sure to Delete?
Yes
No