1. Definitions of Urban Vacant Land
There is no single, widely recognized definition of urban vacant land (UVL)
[1][2]. However, the literature on UVL is vast and discusses the topics from different disciplinary angles, including urban geography, city planning, real estate, urban design, and landscape architecture
[1][3]. Most recent definitions of vacant land encompass a variety of land conditions, including recently razed land, derelict land, land with abandoned buildings and structures, brownfields, bare soils, greenfields, and agricultural soils
[3].
Academic interpretations traditionally diverge from definitions adopted by city planning offices to construct land inventories
[4]. The latter defines vacant land primarily according to the following characteristics: tax parcels with zero-dollar building value in the local tax assessor’s records; tax parcels with no structures; and underutilized and developable city-owned properties, such as surface parking.
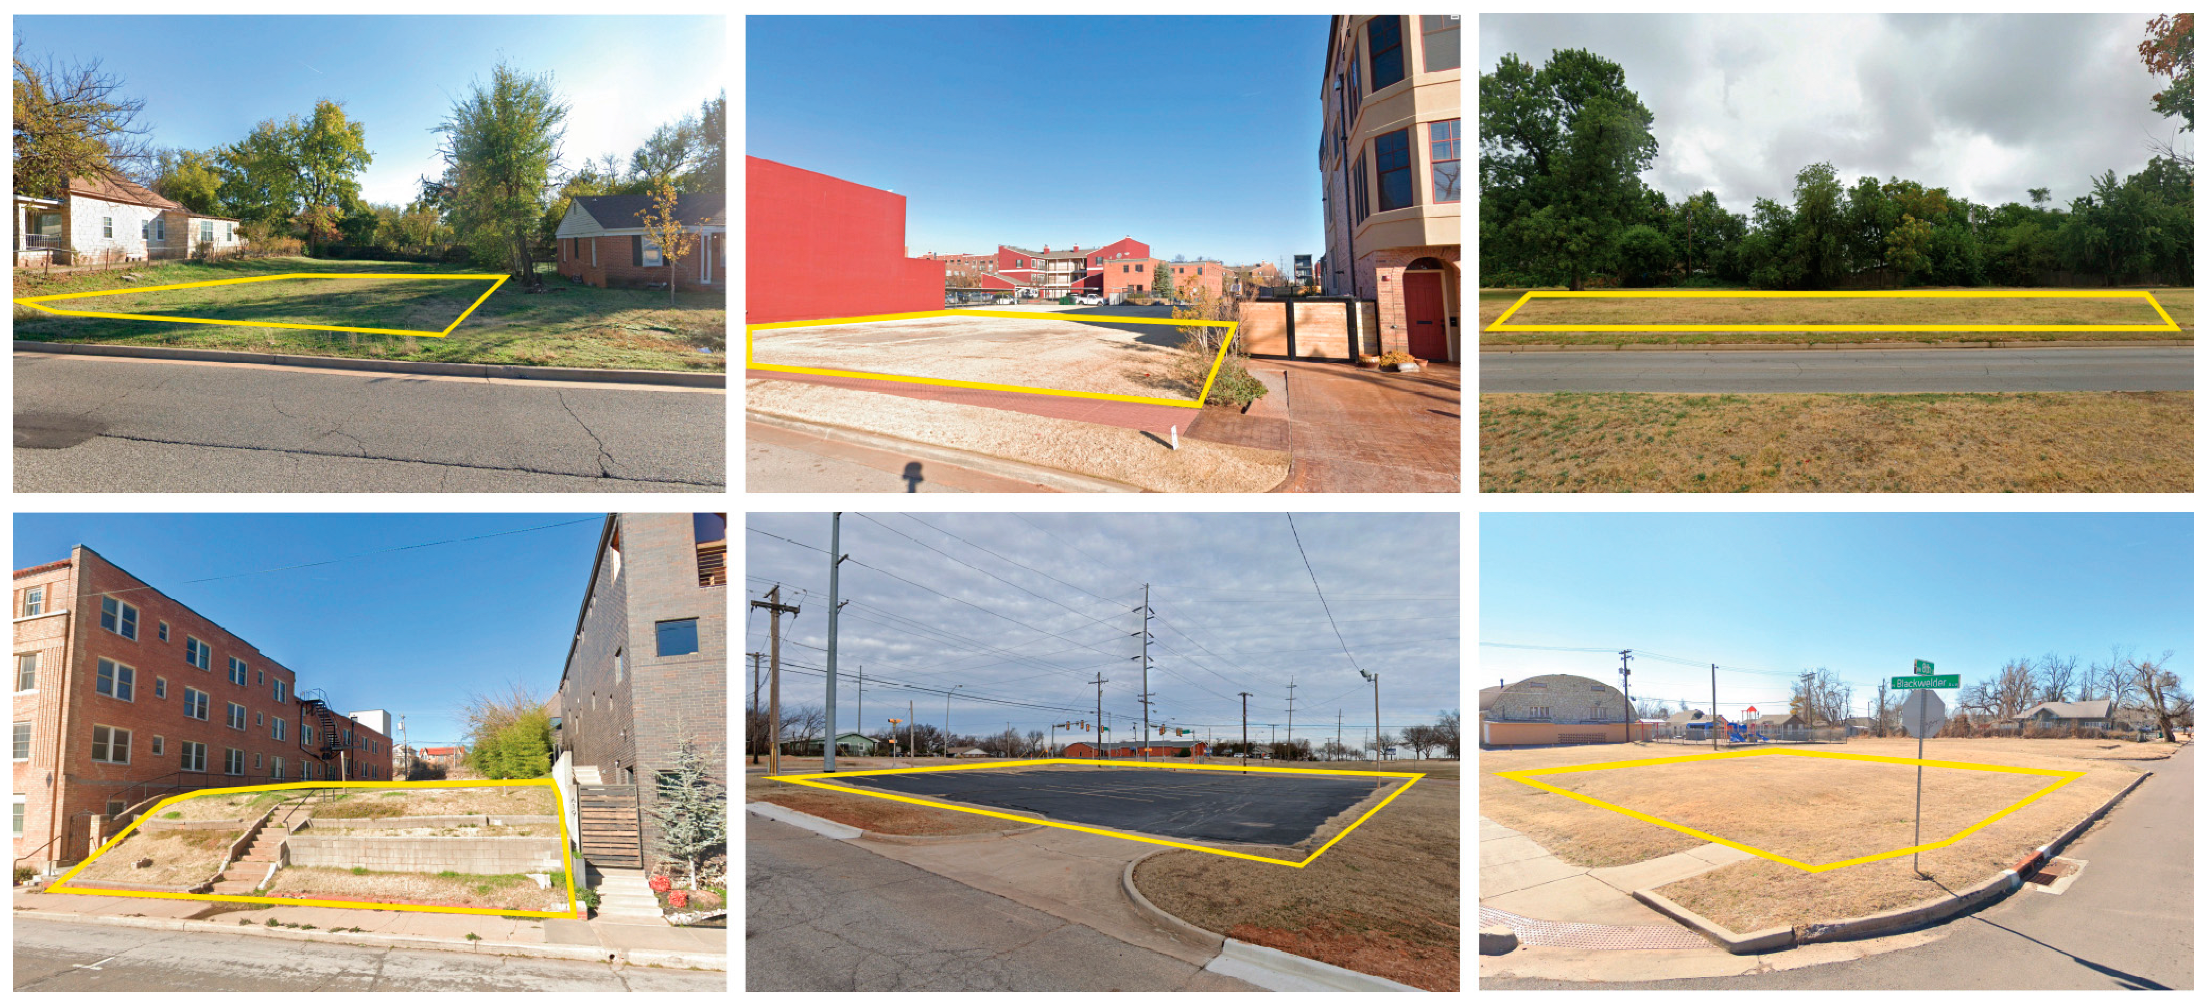
Our definition of vacant land stems from the above-mentioned ones, referring to UVL as residual public and private parcels located in a city core, with no area or width limitation and no permanent buildings. For this research, researchers' description of UVL includes the case of formerly developed lots, never-developed parcels, and underutilized parcels with minimum developments, such as surface parking areas (Figure 1).
Figure 1. Pictures of vacant land in OKC’s urban core. The yellow box is the parcel perimeter. Original photos data: Google Street View, ©2022 Google,
https://www.google.com/maps (accessed on 20 August 2023), images adapted by the authors.
2. Causes and Characteristics of the Urban Vacant Land Phenomenon
The land vacancy phenomenon can be detected in both inner cores and suburban fringes, either in expanding or shrinking cities
[5][6][7][8].
However, there is a broad academic consensus in identifying disinvestment (or lack of reinvestment of capital), suburbanization, annexation, and deindustrialization, as primary causes of land vacancy increase
[5]. Similarly, changes in people’s preferences for new housing types, housing foreclosures, subsequent abandonment, demolition, and environmental issues, including contamination, can result in vacant land
[2].
Conversely, among the reasons for low UVL rates, studies cite a growing local economy, city incentives that favor infill, population in-migration, and less restrictive city land-use policies
[5].
In the past, research on the U.S. context has associated land vacancy with recurring urbanistic reasons. Indeed, studies on U.S. cities have often associated the UVL phenomenon with postwar federal policies that led to suburbanization, urban renewal, and interstate highway programs. Similarly, studies have discussed a correlation between redlining practices and land vacancy in U.S. urban cores
[7][9].
Other reasons, specific to the nature of the single parcel, can lead to vacancy. Research identifies the size and shape of vacant parcels as potential development barriers, as small and odd-shaped parcels are usually the most difficult to develop
[5][8][10]. In addition, zoning requirements can limit the development of small parcels
[11]. Furthermore, either small or large parcels can manifest other development barriers related, for example, to a problematic location in the city
[2][5][12]. Other recurring causes cited in the literature include real estate speculation, perceived contaminations, steep slopes, utility easements, infrastructure problems, or wetlands
[2][12].
The definitions suggest that the UVL phenomenon is intrinsic to cities, and land vacancy’s impact on urban communities depends on cities’ demographic and economic trends. As a result of such interdependency, researchers are very cautious about identifying positive and negative thresholds for UVL area percentages. Limiting the discussion to the U.S. context, over the years, studies have calculated the average vacancy rate in U.S. cities. According to Newman, the average vacant land to total land percentage in large U.S. cities is 16.7%
[5]. Another recent, comprehensive study on residential land vacancy in 65 American cities calculated a vacancy rate of 11.48%
[8].
The variation of results is related to multiple reasons, including different definitions and analysis criteria for UVL detection and classification. Regional variations exist for the amount and typology of vacant land detected, as well as for the types of cities surveyed, which range from growing metropolises to shrinking mid-cities.
3. Reasons for Oklahoma City as a Case Study
OKC (pop. 688361, as of 2021) is an ideal case study to consider UVL, as it encapsulates the main features of a growing middle U.S. city
[13]. The city was founded in 1889, at the intersection between the Southern Kansas Railway and the Oklahoma River. The first additions that further defined its original rectangular gridiron were made of walkable blocks (approximately 122 × 91 m), with sixteen 15 × 43 m parcels. Low-rise residential neighborhoods, connected to downtown by a robust streetcar network, and middle housing types, like duplexes or fourplexes, had characterized the city’s growth until the 1940s
[14]. For most of the twentieth century, OKC has continuously expanded its boundaries. Such land annexation policy was exasperated during the postwar years. In 1941, the city had a physical extent of 65 km
2. In the following twenty years, OKC launched an aggressive land annexation program, by adding about 1554 km
2 to its area, to prevent surrounding towns from expanding their territories and reducing the city’s economic growth opportunities
[4]. Like other U.S. cities, the rapid postwar migration of middle-class white households from downtown OKC towards the suburbs led to population loss and land vacancy in the urban core. In 1940, downtown OKC hosted roughly 54,000 residents. According to recent studies, the same area currently hosts about 9000 residents
[15].
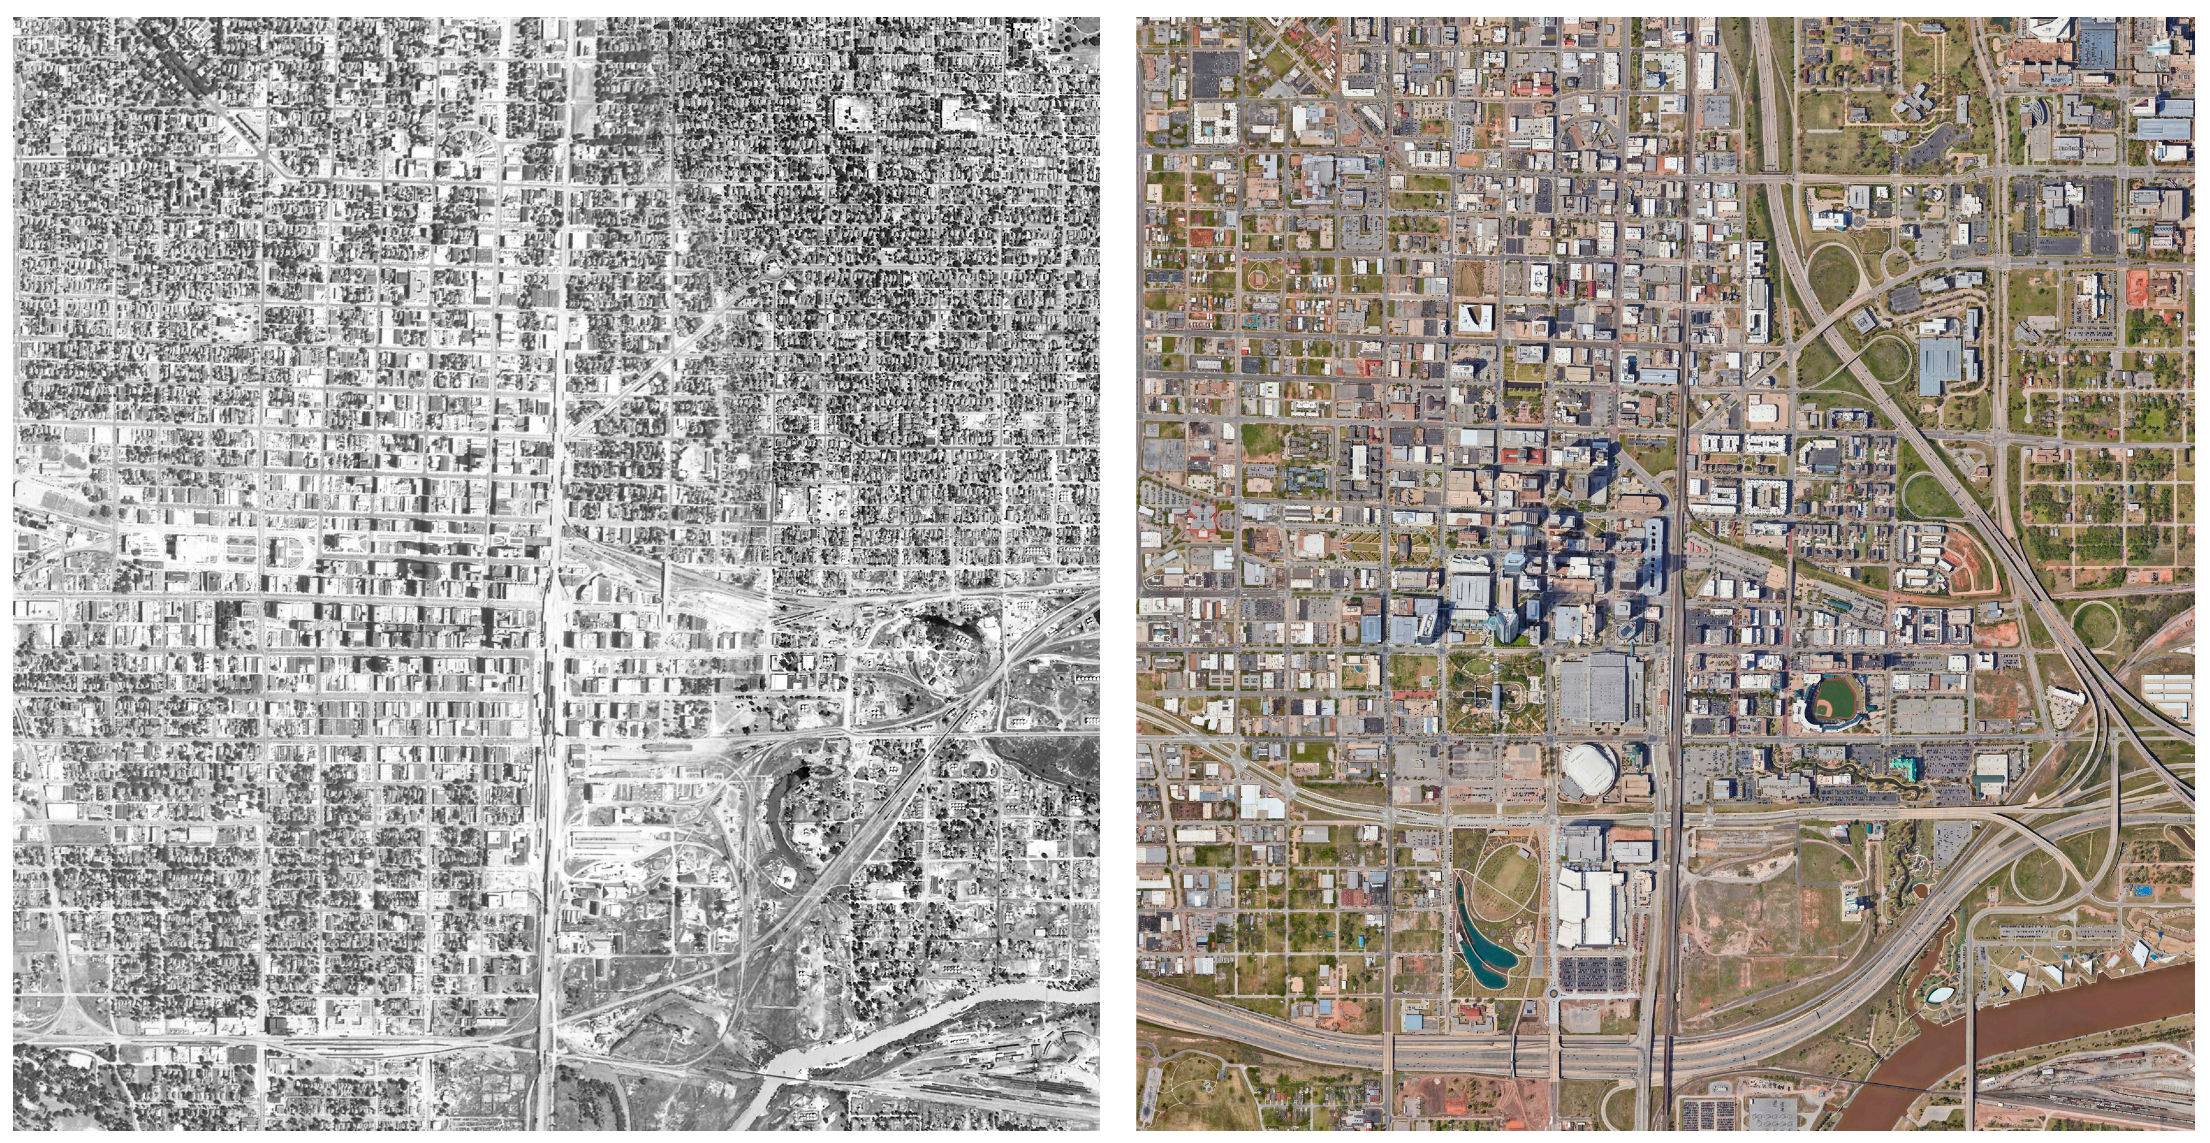
In the postwar years, the decline of OKC’s urban core was accelerated by extensive urban renewal programs, such as architect I.M. Pei’s downtown redevelopment plan
[16]. Adopted in 1965, Pei’s plan aimed to turn approximately 200 hectares of mixed-use, walkable blocks into modern superblocks. However, due to financial restrictions, the renewal plan was only capable of implementing massive demolitions in the historic downtown and failed to rebuild its social and physical fabric (
Figure 2). This disinvestment led to a landscape of abandoned properties and vacant land, negatively affecting the city for decades
[17].
Figure 2. Aerial view of OKC in 1941 (
left, before urban renewal) and 2022 (
right). Photos: Department of Agriculture. Agricultural Stabilization and Conservation Service. Aerial Photography Field Office. Oklahoma County, Oklahoma, 1941. 2B-141, 1B-145. 1:20,000, original source. Oklahoma Historical Aerial Digitization Project, 2022, electronic source:
https://www.oklahoma.gov/content/dam/ok/en/occ/documents/og/ohadp/oklahoma/sns_oklahoma_1941/2B-141.jpg,
https://www.oklahoma.gov/content/dam/ok/en/occ/documents/og/ohadp/oklahoma/sns_oklahoma_1941/1B-145.jpg (accessed on 20 August 2023), images adapted by the authors. Google Maps, ©2022 Airbus, CNES/Airbus, Maxar Technologies, U.S. Geological Survey, USDA/FPAC/GEO, Map data ©2022, (accessed on 20 August 2023).
Like urban renewal, during the 1970s, the extent of the interstate highway network in OKC wiped out several downtown mixed-use neighborhoods with a fine-grained pattern of development. In particular, the implementation of Interstate 235 bisected downtown and hit particularly hard the historic African-American communities of Deep Deuce and Harrison-Walnut
[18].
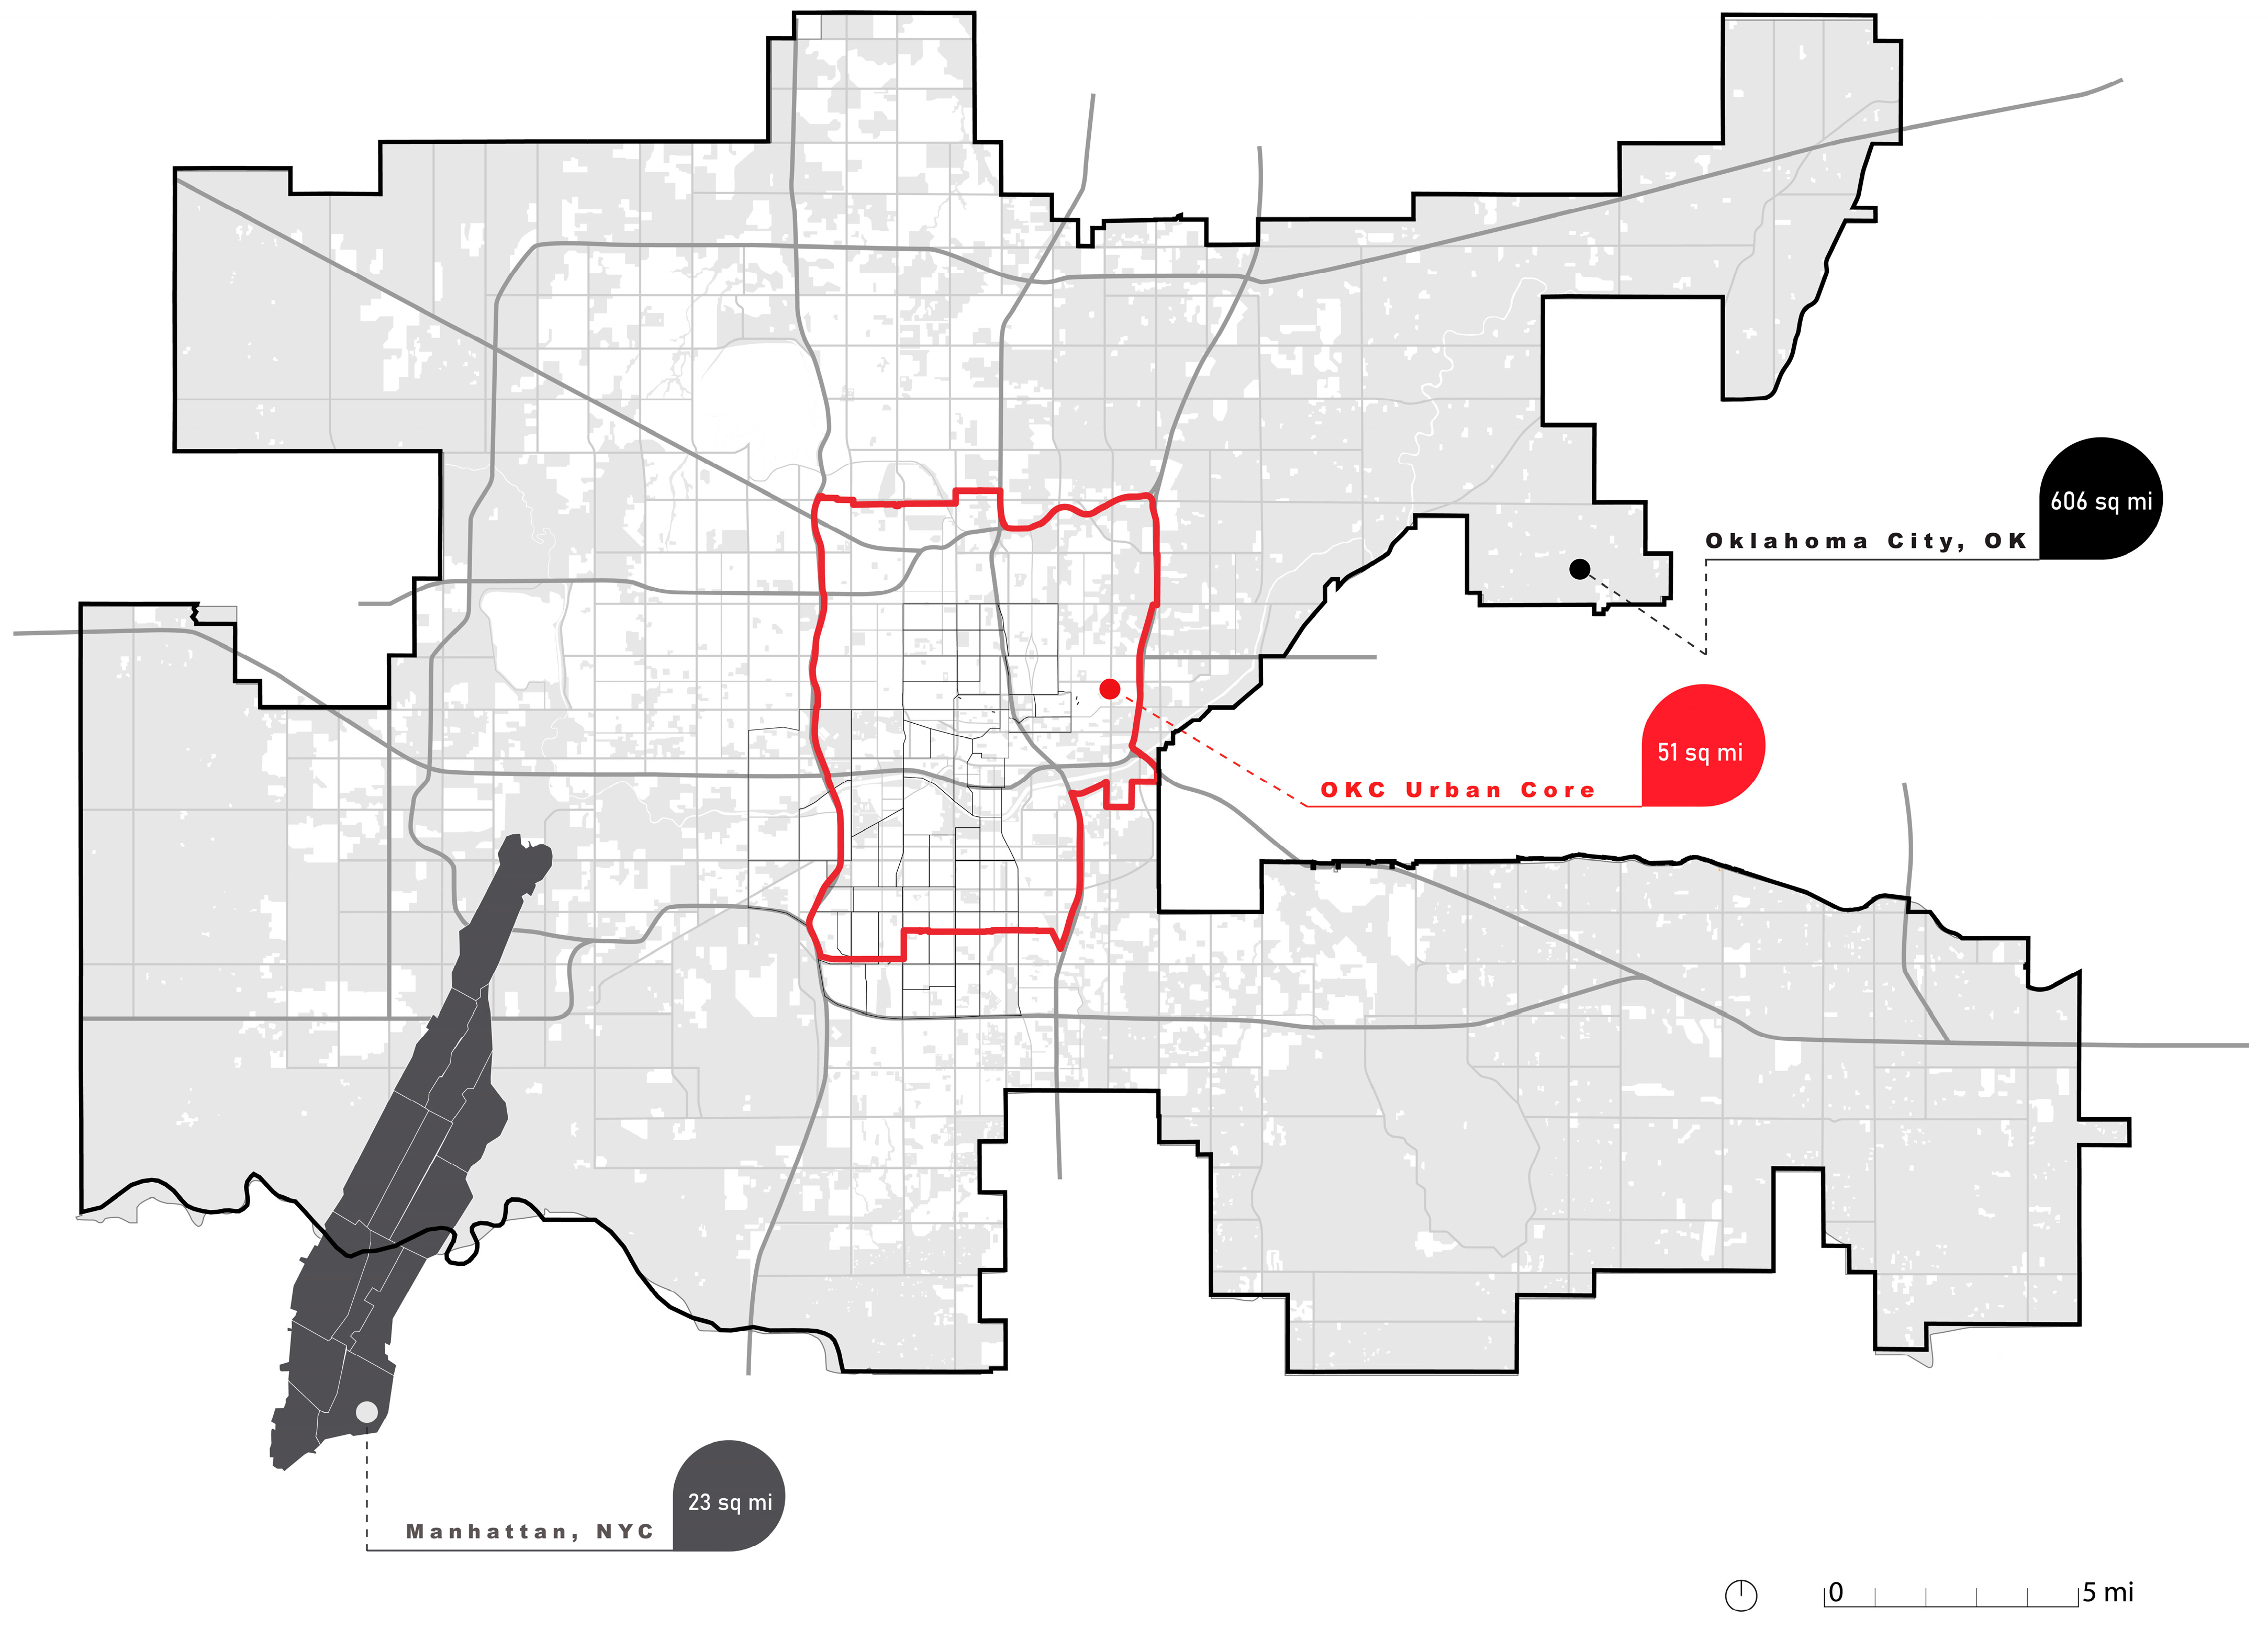
OKC’s great land area (1570 km
2) and low population density (435 inhabitants per km
2) make it an ideal example of a car-dependent city. Its considerable land extension and suburban development that happened in the last century have forced the city to stretch its vehicular infrastructure dramatically. Consequently, according to most recent municipality documents, 4% of the total OKC area is dedicated to parking lots, which corresponds to roughly 62 km
2 (
Figure 3), more or less the area of Manhattan in New York City
[19].
Figure 3. OKC’s urban core land area compared to Manhattan, NY, and the whole OKC territory.
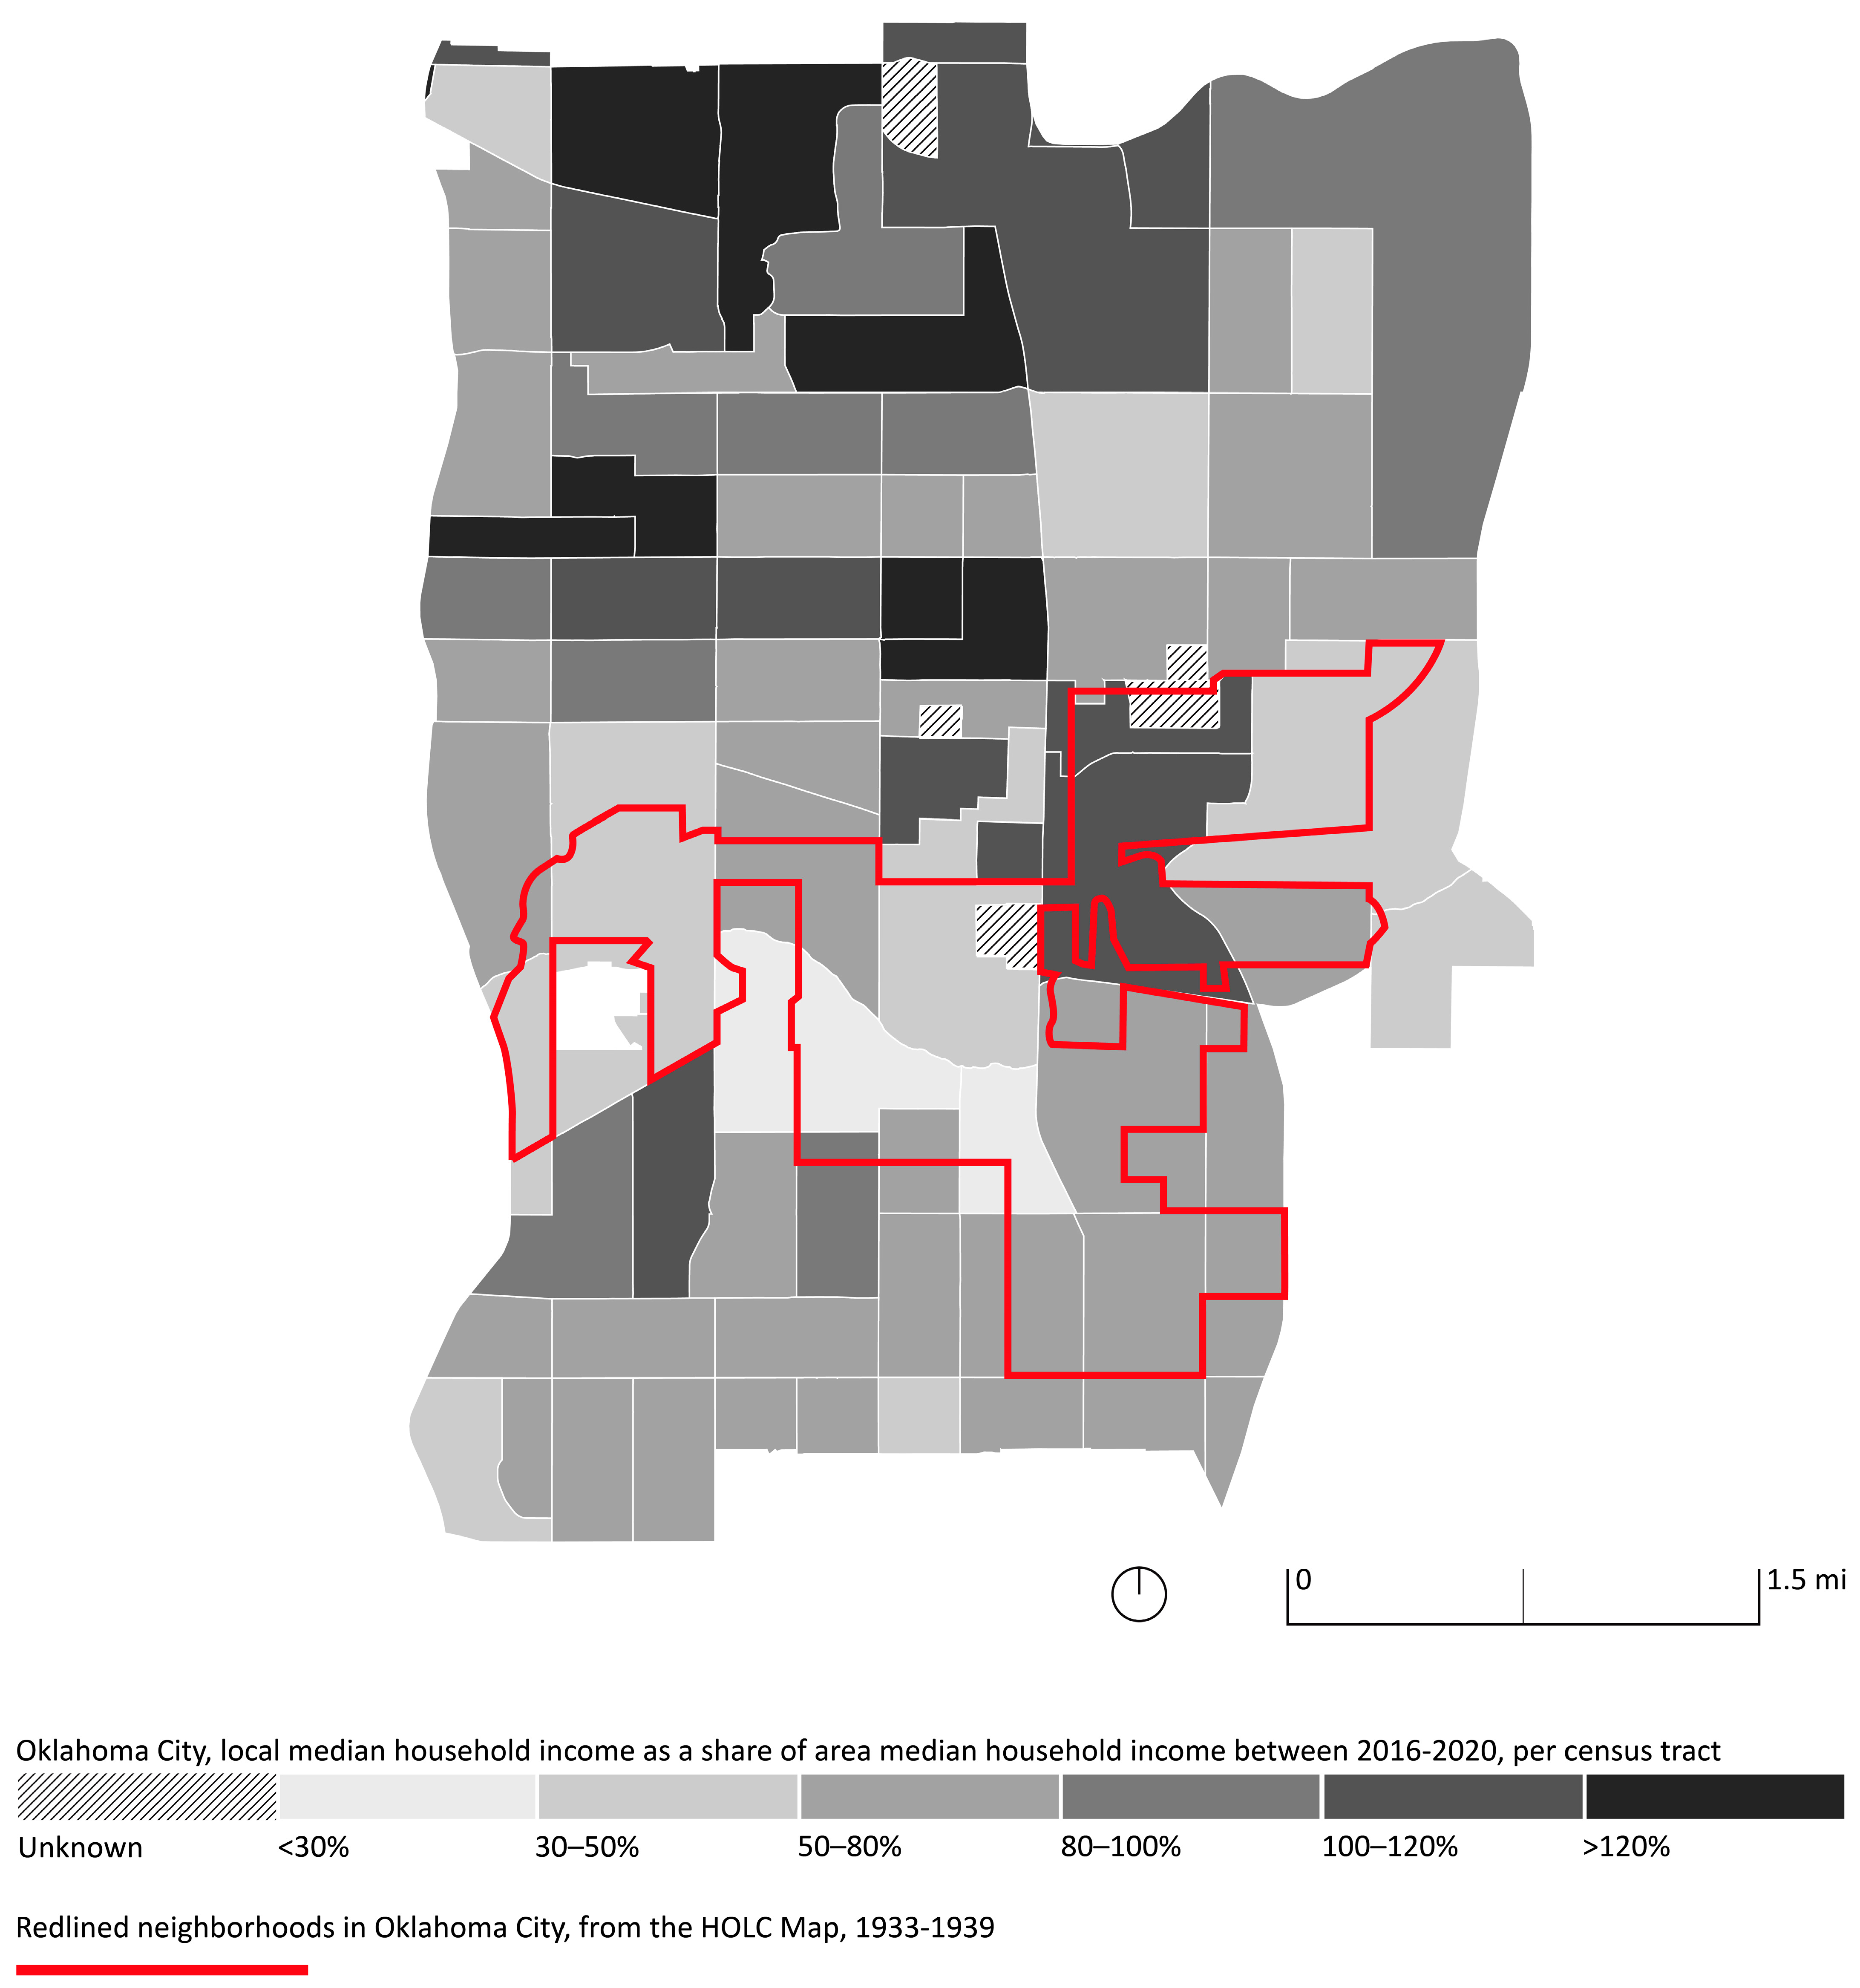
Updated census data show that poverty in OKC’s core is concentrated in the east and south quadrants of the city, where, respectively, mostly African American and Hispanic communities live. Conversely, most of OKC’s white population lives in the northwest neighborhoods, usually inhabited by higher-income households
[20]. This demographic sorting mirrors decades of exclusionary planning policies. An overlay of a redlining map with a 2020 OKC’s urban core income map shows that the wealth distribution in OKC is still affected by early twentieth-century discriminatory practices (
Figure 4).
Figure 4. Map of median household income in OKC’s urban core census tracts as a share of area median household income between 2016–2020, with redlined neighborhoods in a 1930s Home Owners’ Loan Corporation (HOLC) map. Income data: United States Census Bureau and PolicyMap, (accessed on 20 August 2023). Original HOLC map data: Records of the Federal Home Loan Bank Board, Record Group 195, National Archives at College Park, College Park, MD, available online:
https://www.docsteach.org/documents/document/redlining-map-of-oklahoma-city-oklahoma (accessed on 20 August 2023), image adapted by the authors.
The housing market in OKC is still oriented towards single-family housing. Between 2010 and 2019, single-family homes accounted for 89% of all new units built, while 11% of new residential construction was multifamily projects. Only 5% of the new residential units between 2010 and 2019 were collectively built within the downtown and the central subarea
[21].
These urbanistic and socioeconomic factors still significantly impact the quantity of vacant land in OKC’s urban core. However, over the last 20 years, OKC’s central core has experienced signs of growth. This was made possible by a general economic upturn in the city. A series of municipal capital improvement programs and private investments introduced new land uses and activities downtown
[17]. Since then, the urban core has steadily continued growing until today, but slowly when compared to the suburban areas of the city
[21].
Based on recent studies on land vacancy
[5], OKC can be classified as a “compressing city,” or a city that has gained population while not gaining land area over the last 10 years. This situation makes vacant urban land a key competitive asset for the city’s growth. However, like other mid-size U.S. cities, in OKC, sustainable infill is made difficult by structural aspects. One reason for such a persistent land vacancy is related to the city’s tax revenue structure. Compared to national data, in OKC, property taxes for UVL are very low, resulting in owners who are encouraged to keep their vacant parcels underutilized for long periods. Additionally, few development incentives in the urban core area motivate landowners to develop or sell their properties.
The current zoning ordinance represents another obstacle to UVL development. Bulk standards for residential districts make affordable housing developments in parcels less than 557.41 m
2 (6000 sq ft) and less than 15.24 m (50′) wide difficult
[22].
Such financial and regulatory disincentives limit the city’s ability to tackle the housing shortage problem, especially for low- and moderate-income households. By relying on the most recent gap analyses for housing demand, Oklahoma City has a total current need for approximately 44,600 units, including 10,400 new housing units for rental and ownership
[21].
 +1 credit