1. Water Line Detection
The key of computer-vision-based water level measurement is water line detection. No matter what kind of approach, the estimation of actual water level is based on the position of water line in the image.
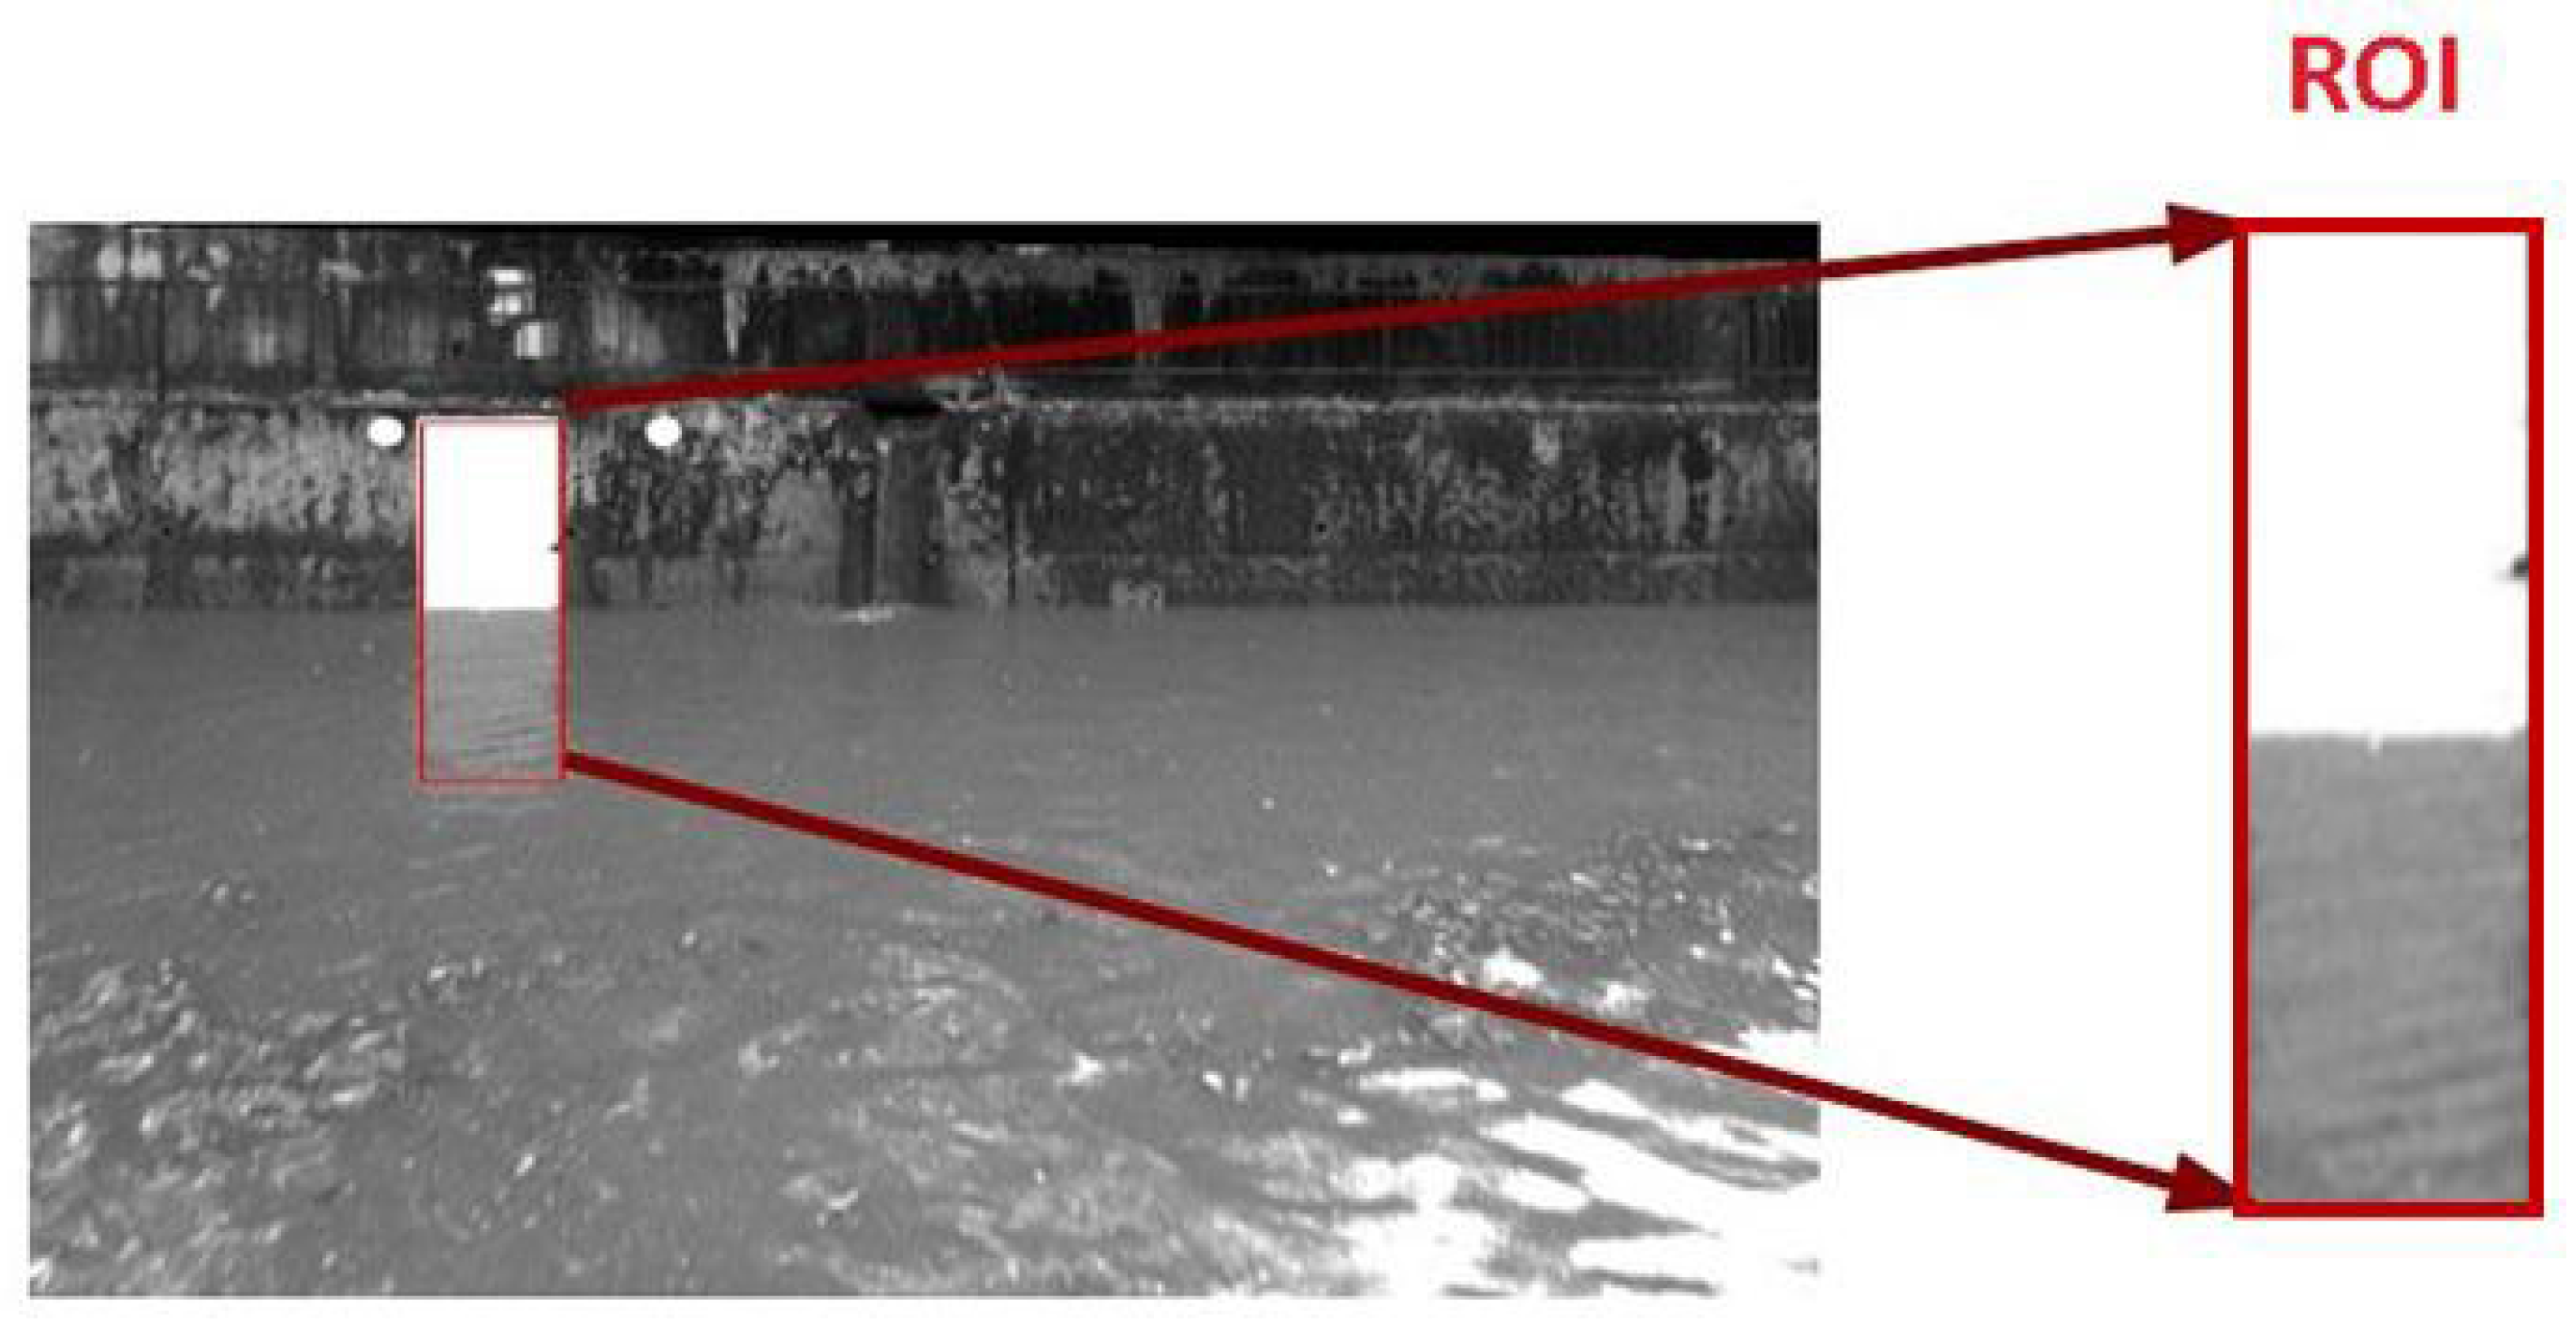
In order to improve search efficiency, the region of interest (ROI) is prior identified in an image such as
Figure 1 [1]. The ROI is defined as a k-pixel buffer around the water gauge or the calibration points according to the image size and camera pose.
Figure 1. Region of interest.
1.1. Horizontal Projection Methods
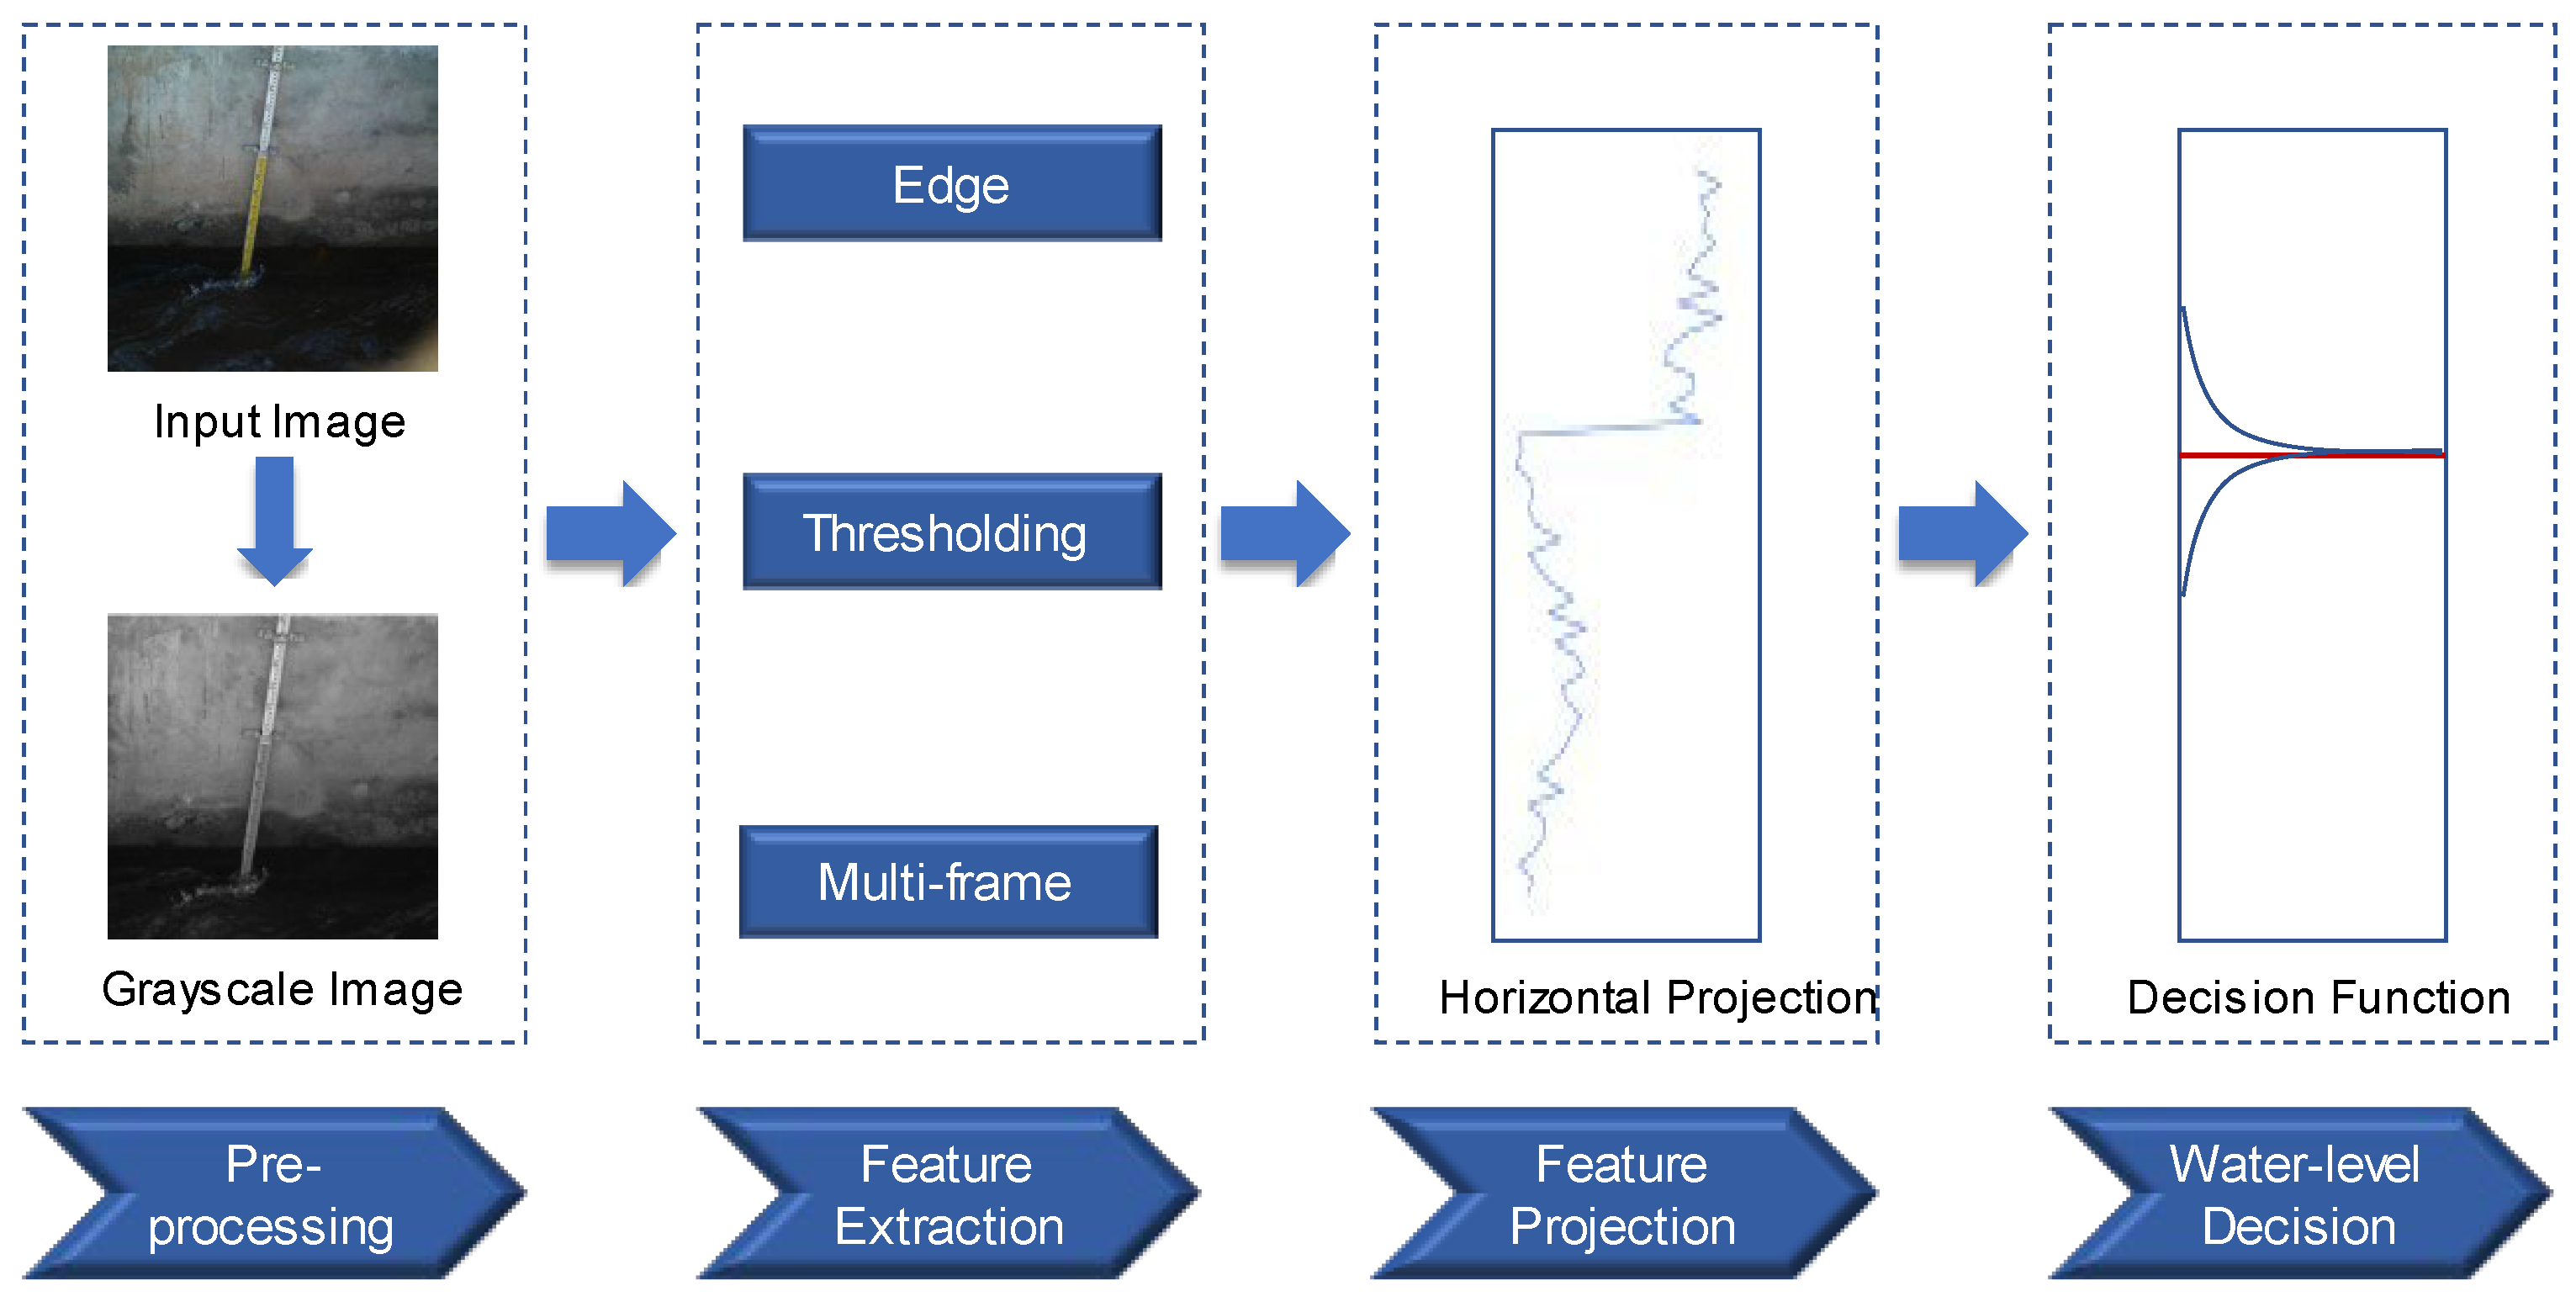
Horizontal projection methods are the most common image processing methods for water line detection of image containing water gauge. Normally, the sum of grayscale values of each row of pixels in the ROI constitutes the horizontal projection curve. The steps are shown in Figure 2: firstly, the image is preprocessed with grayscale processing and noise removal, then the features are extracted, and finally, the mutation point of the feature projection curve is the corresponding water line position. Feature extraction methods can be divided into three categories according to principle: edge detection method, thresholding method and multi-frame accumulation method.
Figure 2. Diagram of the horizontal projection methods.
Edge detection algorithms applied on images are based on the assumptions that discontinuities of the intensities of pixels of images are linked to the physical changes, e.g., material changes, surface orientation changes, etc. The water line marks the boundary between the water surface and land, and is a recognizable edge feature in an image. Udomsiri et al.
[2] developed a computer-vision-based water level detection system using a horizontal edge detector and finite impulse response (FIR) filter to extract features in different lighting conditions. Shin et al.
[3] used the Marr–Hildreth operator to detect the edge pixels of the ruler within ROI. However, the scale line and the water line often have similar edge features in the standard water gauge image, which makes it difficult to identify accurately. Zhang et al.
[4] fused greyscale and edge features to determine the water line by coarse-to-fine detecting the position of the maximum mean difference (MMD) between the horizontal projections of the greyscale image and the edge image.
Thresholding methods use the difference between the grayscale distribution of water surface and gauge in an image to convert the image into a binary image by setting the threshold value to detect the water line. The selection of the threshold for binarization processing usually adopts a maximum inter-class variance algorithm (OTSU), which is an adaptive threshold method
[5][6][7]. In field observation affected by random noise such as the flare of the water gauge or the reflection and shadow of the water surface, the grayscale distribution of the water gauge and the water surface is uneven, and it is difficult to distinguish the water line clearly. Xu et al.
[8] transformed images from the RGB to the HSV, abstracted the hue component to replace grayscale image, and then rebuilt the images based on color spatial distribution information and the color priori information, considering the component map. Chen et al.
[9] adopted the color space conversion of the HSV as well to enhance the contrast of the gauge to water surface. Cai et al.
[10] used the k-means clustering algorithm to segment the scene in the RGB color space and the region growing algorithm to select the target water body from the segmented scene.
Multi-frame accumulation methods can be located the water line by accumulating the variation of multiple frames
[11][12] because the change of water surface is more obvious than that of the water gauge in the case of flow and fluctuation. The cumulative histogram that emphasized the cumulative grayscale variation in the water surface in image sequence similar to feature projection curve has been proposed. However, whether the cumulative variation in the grayscale value and optical flow can be effectively distinguished depends on the degree of movement of the water. It is easy to identify the water line under the condition of fast velocity and the sharp fluctuation of the water surface.
1.2. Dictionary Learning Methods
The horizontal projection technique relies on a solitary feature, such as grayscale or color, to differentiate the water gauge from the water surface. However, the extraction of a single, basic feature might not adequately capture the nuanced distinctions between water and non-water regions. This limitation poses challenges in accommodating the intricate and dynamic conditions encountered in field applications.
Dictionary learning method is a data-driven machine learning method to extract the most essential features for the target task contained in training samples. The main problem to be solved in dictionary learning can be expressed as Formula (1):
where
Y is a matrix defined as [
Y0,
Y1,…,
YC], in which every sub-matrix
Yi is the
ith class of images collection with a label.
D is a dictionary that preserves the essential features of an image.
X is a sparse representation, which represents the category information of image blocks in water line detection.
The solution of
D is regarded as an optimization problem as Formula (2):
Briefly, the method based on dictionary learning can be divided into three steps, as seen in
Figure 3 [13]. Initially, the training images undergo conversion into a training matrix, denoted as
Y, wherein each column corresponds to a specific training sample alongside its designated label. Subsequently, the training matrix
Y is fed into the learning model for the acquisition of a dictionary
D. Eventually, leveraging the acquired dictionary
D, the water-related imagery can be subjected to classification, effectively discerning between gauge and water, thereby facilitating the detection of the water line.
Figure 3. Diagram of the dictionary learning method.
1.3. Deep Learning Methods
Deep learning methods mainly train deep convolutional neural networks driven by plenty of various scenarios’ data
[14]. Compared with dictionary learning, more generalized features of images can be extracted, thus improving the accuracy and robustness of water level measurement. Deep learning methods in water line detection involve object detection algorithms and semantic segmentation algorithms. The object detection algorithms identify the smallest rectangle box of the water gauge location and take the bottom of the rectangle box as the water line. Bai et al.
[15] used an object detection network called SSD to locate the gauge area. Semantic segmentation algorithms can classify instances of the image at the pixel level and obtain a more precise location of the water line than object detection algorithms. In photogrammetric techniques where water gauges are absent, researchers employ semantic segmentation models. This approach allows the extraction of a more accurate water–land boundary as opposed to relying on an estimated straight demarcation. Liang et al.
[16] developed a video object segment pipeline called WaterNet and built a dataset named “WaterDataset” of 2388 images and 20 videos with labeling. Jafari et al.
[17] used the fully convolutional network for segmentation, which was verified during Hurricane Harvey. Xie et al.
[18] used an improved SegFormer-UNet segmentation model to accurately segment the water body from a given image. However, semantic segmentation networks are often trained using supervised learning methods, which need the prior construction of a dataset. The limited scale of available datasets specifically designed for water body segmentation constrains the generalizability of these networks. Vandaele et al.
[19] applied transfer learning methodology to semantic segmentation networks to migrate models to unfamiliar datasets and overcome the lack of available data. Zhang and Tong
[20] adapted appearance-based data augmentation (ADA) and random extension in the direction (RED) to cover more environmental conditions.
2. Water Gauge Reading Recognition Approaches
Water gauge reading recognition approaches obtain the water gauge readings based on the image containing the water gauge, which is inspired by the manual observation of the gauge. When using the manual observation method, it is necessary to first find the water line and estimate water level according to the gauge scale remains above the water surface. The approach uses a computer instead of human eyes to calculate the water level by analyzing the scale bars and characters after locating the position of water line.
A typical approach is the template-matching algorithm, which searches and finds the location of the target image in the template image. The template image is usually partitioned from an orthographic water gauge which is the same as the gauge to be read, with known physical resolution and is not placed in water, meaning that the number of pixels between each scale bar is determined. The target image is the image block of the detected water line according to the captured gauge image, which is always a binary image. The actual water level can be calculated by locating the position of the detected water line region of the captured image in the template image. Shin et al.
[3] evaluated the similarity of the water line region image and target feature mask and calculated the water level with polynomial interpolation. Similarly, Kim et al.
[12] divided the template image into multiple uniform sub-regions and used template matching to determine which sub-region the detected water line was located in.
In the above studies, the water gauge images are usually captured at the orthographic angle, which does not take into account the perspective distortion caused by oblique shooting in the field observation scene, resulting in a large template matching error. Zhang et al.
[21] combined the idea of template matching and photogrammetry to carry out distortion correction on the original image, so that the corrected image and the template image were in the unified coordinate system, meaning that the pixel position of the water line in the corrected image is consistent with that of the template image, without calculating the similarity between them.
Another approach is pattern recognition, which estimates the water level by identifying and counting characters and scale bars, based on the fact that the height of each character is determined in a standard two-color water gauge. Bruinink et al.
[22] applied Gaussian Mixture Model segmentation followed by optical character recognition based on a random forest classifier and bar detection using shape moments to obtain the characters and tick marks. The method is simple and efficient, but it would be difficult to extract information in the situation of incomplete scale bars. Guo et al.
[23] used sparse learning to recognize scale bars and characters, and performed well when some pixels were missing. Chen et al.
[9] proposed a multi-template matching and sequence verification algorithm to achieve a high recognition rate of characters. By collecting characters from different angles to build a rich template library and considering the context information of characters, this method can effectively recognize incomplete characters. Furthermore, since CNNs perform well in object detection, especially in handwritten digit recognition, many convolutional neural network models have also been applied for gauging character location and recognition tasks, such as Yolov5s
[24], FCOS
[25] and CornerNet
[26]. Fleury et al.
[27] used the character recognition and counting method to make training set. Thereafter, the CNN was trained to estimate the water level end-to-end. Since all the water gauge image data used for training were captured at the Jirau Hydroelectric Plant located on the Madeira River, this method does not have generalization; that is to say, plenty of images need to be collected at new observation sites for retraining the model to adapt to local flow and gauge features.
The water gauge visibility in an image greatly affects the accuracy of the water gauge reading recognition approaches. Whether it is to identify characters of water gauge surface or to match the template image, it will be difficult to recognize the water level if the water gauge surface is damaged, shielded or reflective. As for the template-matching method, the application is limited because the type of water gauge may be different from the template image in practical application, such as a difference in width, material, bending degree and surface character characteristics.
3. Photogrammetric Approaches
The photogrammetric approaches obtain the geometrical information and three-dimensional coordinates according to the corresponding two-dimensional pixel coordinates in a photo.
3.1. Pinhole Camera Model
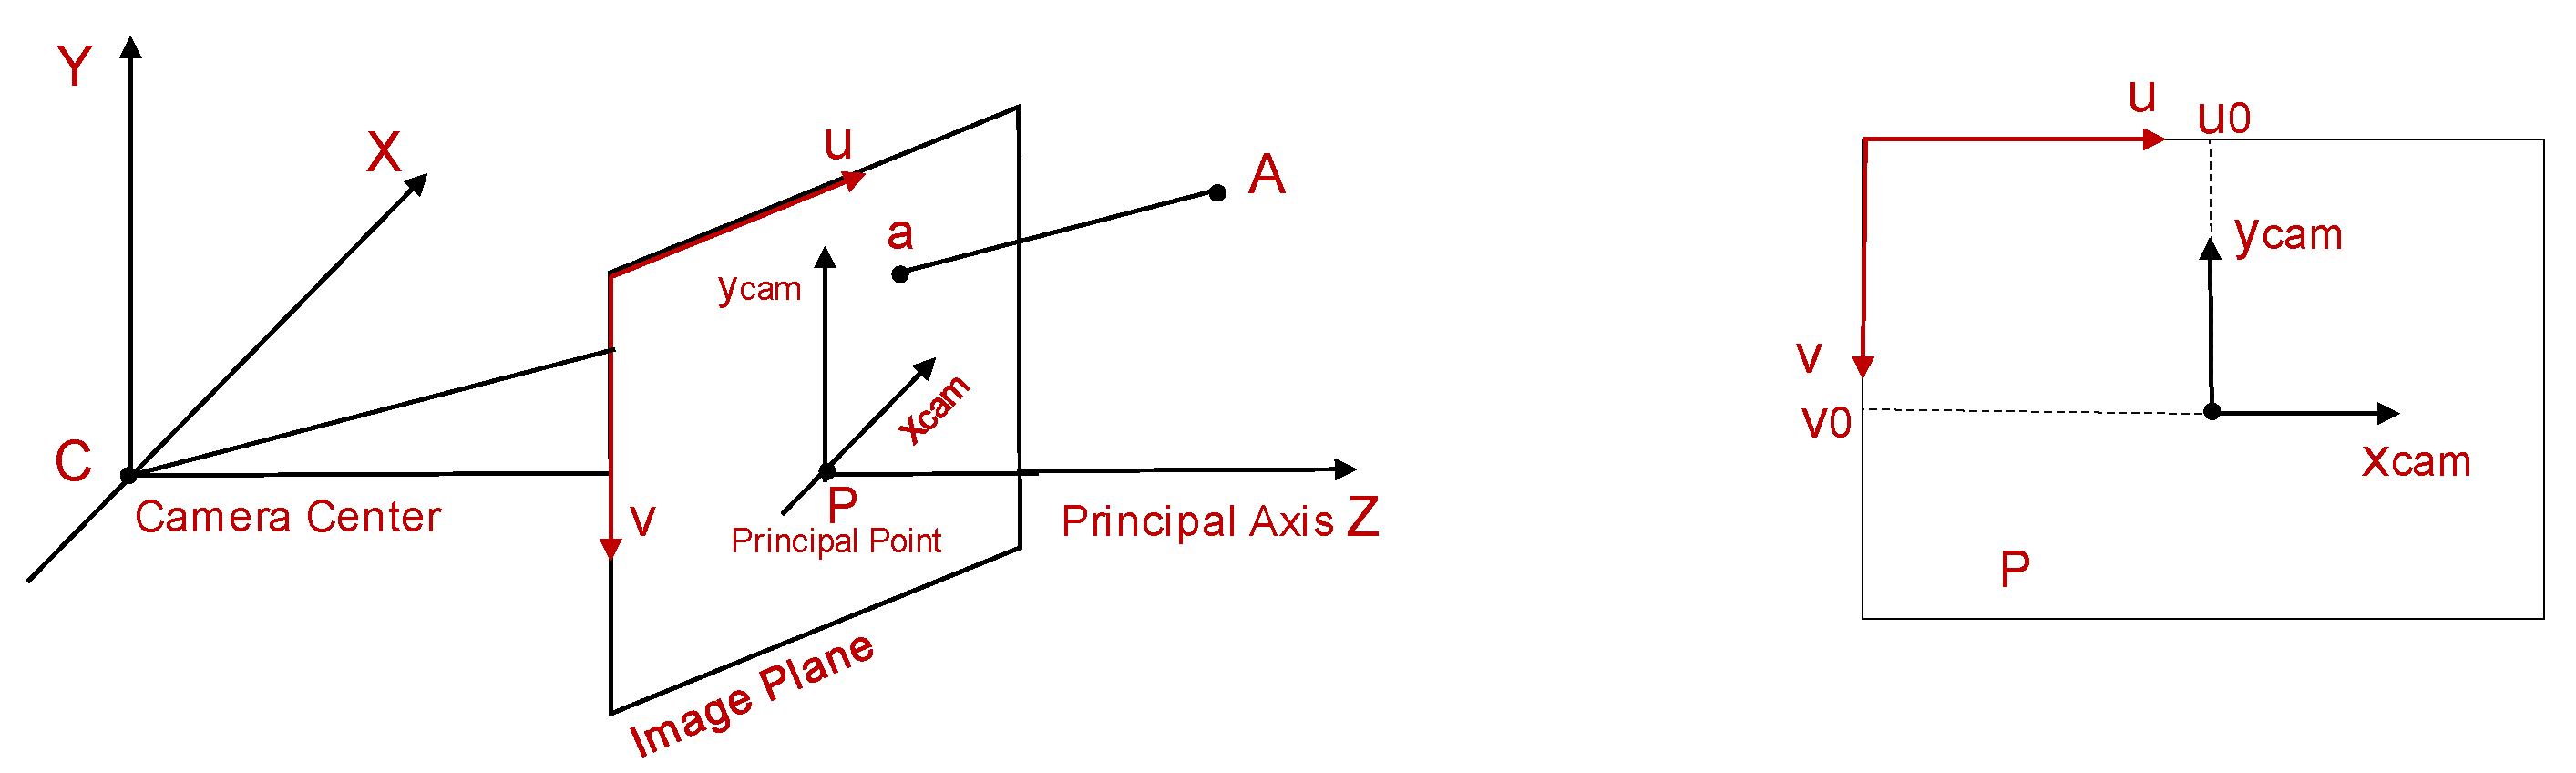
The most widely used camera model is the pinhole camera model as
Figure 4, which describes the process in an ideal state without the distortion that an object represented by a three-dimensional point (
X,
Y,
Z) in the world coordinate system changes to the camera coordinate system by rigid transformation, and then further projective transforms to the corresponding pixel coordinates (u, v) in the image plane pixel coordinate system. The point with coordinates (
X,
Y,
Z) in the world coordinate system is first projected to the corresponding point (
Xc,
Yc,
Zc) in the camera coordinate system with the optical center as the origin through the rotation transformation described by the rotation matrix
R3×3 and the translation transformation described by the offset vector
t, which is shown as Formula (3).
Figure 4. Pinhole camera model.
Then, the point is projected from the camera coordinate system into the image plane coordinate system with the principal point on the optical axis as origin. The projection transformation can be described by the similar triangle relation expressed in Formula (4).
The image unit of the pixel coordinate system is the pixel point, which is the discrete expression of the image coordinate system adopting the geometric unit of measurement (mm). The pixel located in the image plane coordinate system is transformed to the pixel coordinate system whose origin is at the upper left corner, as shown in Formula (5), where
dx and
dy are pixel resolution(mm per pixel values) and (
u0,
v0) is the principal point’s pixel coordinate.
To sum up, the perspective projection relationship between a point in the world coordinate system and the pixel coordinate system without distortion is shown as Formula (6)
[28]. [
R|
t] are the external parameters of the camera,
fx,
fy,
s,
cx and
cy are the internal parameters and
s reflects the skew of the image plane. The parameters of the projection model can be solved by selecting multiple ground control points and measuring their world coordinates and pixel coordinates, which is called camera calibration.
3.2. Ground-Based Photogrammetric Approaches
The actual water level can be calculated according to the projection model after water line detection. The simplest method is to measure the actual distance between multiple points on a line of the captured image in advance. The elevation of each pixel point on the line can be calculated by linear interpolation, and the water level can be obtained based on the intersection of this line and the detected water line. Such processing oversimplifies the projection relationship between pixel distance and object distance, resulting in potential inaccuracies in the water level measurement.
In order to complete more accurate measurements, the world–pixel coordinate homography must be determined according to multiple ground control points (GCPs) with known world coordinates. Yu and Hann
[29] used four points marked at the known positions of a bridge support column to decide the external variables. Gilmore et al.
[30] developed a lab software called GaugeCam Remote Image Manager-Educational (GRIME) to measure the water level with an accuracy of ±3 mm under tightly controlled laboratory conditions based on calculating the transfer matrix between pixel and world coordinates using fiducial grid patterns. On this basis, Chapman et al.
[31] released the user-friendly and open-source software GRIME2 for reliable field measurements. GRIME2 calibrates the camera using a target background containing eight bow-tie fiducials. Although this calibration scheme is good in terms of the accommodation of variability and accessibility, these benefits are offset by the need to rigidly place the target plane orthogonally to the water surface. In the above research, the optical axis of the camera was strictly perpendicular to the detection target plane without considering the strict geometric modeling of interior and exterior camera geometry, and the image distortion was ignored.
In actual field monitoring, lens distortion, caused by lens processing, and assembly and perspective distortion, caused by the camera’s optical axis tilt, always exist. In addition, strong winds can cause small camera motion, which results in change of the calibration parameters. To complete a stable and precise measurement, it is necessary to correct distortion and adapt to camera motion. Lin et al.
[32] obtained the coefficient of the lens distortion and the internal parameters such as the focal length, the location of the principle point in the laboratory prior to installing the camera in the field, acquired the external parameters by solving the collinearity equations which is another representation of the pinhole camera model, and detected camera movement or rotation and adjusted the external parameters by matching the calibration points in sequential images. Similarly, in the research of Kuo and Tai
[33], the internal parameters of the camera and its distortion coefficients were obtained in the laboratory for lens distortion correction, the inverse perspective mapping (IPM) rectified method was implemented to rectify the perspective distortion caused by the inclination angle between the camera’s optical axis and water gauge plane, and the normalized cross correlation (NCC) technology was used to adapt to the camera vibration. Azevedo and Bras
[34] calculated the camera motion compensation based on template-matching methods.
The smartphones with inbuilt cameras, sensor systems for location, rotation assessment and high-performance processing units have been applied for field water level measurement. Elias et al.
[35] developed a photogrammetric approach implemented on smartphone. The camera’s exterior orientation could be determined by a smartphone sensor system, including the global navigation satellite system (GNSS) receiver, accelerometer, gyroscope and magnetometer. The interior orientation was specified by the manufacturer. The algorithm constructed a synthetic 3D image representing the same global and local scene as the real camera-captured imagery. And, the world–pixel correspondence was established by using a feature-matching method for the real and the synthetic images. Eltner et al.
[36] employed CNNs for water body segmentation and converted image information into metric water level values by intersecting the derived water surface contour with a 3D model reconstructed using Structure-from-Motion (SfM) photogrammetry.
However, the location of the ground-based camera system always remains fixed, taking into account the image resolution and monitoring accuracy requirements, it is suitable for narrow channel water level monitoring. Although the smartphones are movable, the range of their movement is limited by the operators’ activities. Taking pictures in inaccessible locations may present threat to the photographer, such as the flood and the steep bank.
3.3. UAV-Based Photogrammetric Approaches
UAVs have the advantages of flexibility, mobility and teleoperation so that they are suitable for water level measurement in complex field environment (e.g., wide-channel, high-speed flow) and short-term urgent water surface change process measurement (e.g., dammed lake) and other inaccessible locations for ground-based monitoring systems. Ridolfi and Manciola
[37] used four GCPs on the upstream face of the dam as reference points for water level calculation by the drone in the Ridracoli reservoir and the mean error was around 0.05 m. Gao et al.
[38] provided a UAV offset correction method. In the test carried out at a river section with about 160 m width, the artificial recognition data and UAV detection data had relatively good consistency.
Combined with high-spatial-resolution terrain data obtained using UAV photogrammetry, such as the point clouds, digital elevation models (DEMs) and digital surface models (DSMs), the water surface water level field can be observed so to extend point-basis measurement to area-basis estimation. The terrain data are always restituted by the SfM algorithm. The SfM algorithm has been applied with great success in various environmental applications, effectively reconstructing 3D scenes by autonomously matching corresponding points from multiple viewpoint images
[39]. In combination with the appropriate number of GCPs, the ground sample distance (GMP) of the terrain model can reach the centimeter level with elevation error within a few centimeters. The water surface elevation based on the UAV terrain data could be estimated by extracting the elevation of the water–edge interface, the river centerline or the point clouds of the river polygon mask.
Pai et al.
[40] identified the water–edge interface and extracted the elevation along the interface at 1.5 cm intervals from the DSM corresponding to an area of about 400 m along the river channel length and about 180 m width. Giulietti et al.
[41] used images acquired by a UAV system to reconstruct dense point clouds of the Piave River and then applied the random sample consensus (RANSAC) method to retrieve the river surface plane. The water level could be estimated by the distance between a reference point with a known elevation and the free surface with a 0.98 R2_score. Lin et al.
[42] integrated VGI-classified images with UAV-based DSMs using photogrammetry techniques to quantify flood water levels.
Compared with the ground-based observations, the use of UAVs is supposed to be more suitable for those cases which do not require a continuous data acquisition and high-accuracy measurement. Although UAVs do not allow for long-term observation periods, the UAV-based measurement is a valid alternative for scenarios where continuous measurement system cannot be installed due to topography or other factors and an excellent solution for studies of the small rivers overall state over a specific period.
 +1 credit